Detailed Analysis of CommBank Retail Business Insights Report FY18
VerifiedAdded on 2021/11/23
|10
|2698
|162
Report
AI Summary
This report provides a comprehensive analysis of the CommBank Retail Business Insights Report FY18. It begins with an overview of CommBank's features and key information, followed by an abstract summarizing the report's objectives and findings. The report delves into regression analysis, providing examples, discussing scatter plots, regression line equations, R2 value calculations, and comparisons. It also explores classification and regression in business analysis, differentiating between classification and prediction, and examining various classification methods, including neural networks. The report concludes with a business case example utilizing clustering techniques. The analysis highlights the importance of data analysis in understanding business trends, making informed decisions, and improving overall performance. The report provides insights into the Australian retail sector, focusing on innovation, customer experience, and the adoption of new technologies, and also suggests improvements to address challenges faced by retailers and CommBank.

1
Paraphrase This Document
Need a fresh take? Get an instant paraphrase of this document with our AI Paraphraser
Table of Contents
CommBank Retail Business Insights Report FY18...................................................................2
1. Features of commBank...................................................................................................2
2. Key information..............................................................................................................2
3. Abstract...........................................................................................................................2
4. Suggestions.....................................................................................................................3
Regression analysis....................................................................................................................3
1. Example...........................................................................................................................3
2. Height and weight of friends...........................................................................................4
3. Scatter plot......................................................................................................................4
4. Regression line equation.................................................................................................5
5. R2 value calculation.........................................................................................................6
6. Comparison of R2 and regression line............................................................................6
Classification and regression on business analysis....................................................................7
1. Classification and prediction difference..........................................................................7
2. Example for classification methods................................................................................8
3. Neural network................................................................................................................8
4. Business case example with clustering...........................................................................8
References..................................................................................................................................9
1
Business analysis
CommBank Retail Business Insights Report FY18
1. Features of commBank
From the given case study and report of “CommBank Retail Business Insights Report FY18”,
the complete process of the bank and its information has established with an effective based
survey report. The report provided the information of retailing based business process and its
stakeholders information such as business owners, decision makers, suppliers and managers
[1]. The given commbank report could be depends on out subjective and inside subjective
interviews, and entrepreneurs review based on quantitative with wide-going subset. The 262
retailers and their reaction based on the retailing are included. They provided the information
and improved the report based on well qualitative analysis, and they presented the
information by well-structured manner in the report. Different retailing information like
homewares, clothing, food, footwear, liquor, and hardware are analysed and provided with an
effective manner into the given report. From the given report analysis, the report
presentability and visualisation are very effective [2].
2. Key information
The retailer business information and their profitability based information are analysed and
reported in the report. Comparative pressure among the companies and marketing growth
report of the retailing company are analysed and used in the report. The different retailing
information and CommBank report with inside subjective information are used in the given
report [3]. These information are used to improve the business case and insight growth of the
retailers. Their responding attitude among the retailers could make a comparative pressure on
the marketing industries, which also increased the desiring range retailing organisations.
These functions of desiring range and competitive pressure are used to improve the decision-
making increased the performance of the organisation on market. Their providing noteworthy
changes and insight information are improved the decision-making on their problems and
their productivity range [4].
3. Abstract
The Australian business and retailer sectors are providing the better response to their retailers
with competitive pressures and interview or drive efficiencies in business, their performance
and growth are maintained by these activities. For enhancing the customer experience and
2
⊘ This is a preview!⊘
Do you want full access?
Subscribe today to unlock all pages.
Trusted by 1+ million students worldwide
leveraging the technology, the retailers are appear to adopt the innovations for ensuring and
maximising the available opportunities. During the retailers gathering and returning by timely
from significance change in areas, these would be others yet for intangible, financial, and
harness benefits, which could be deliver [5]. The retailer business insight report provided the
information about 2,473 enterprisers, and decision makers, survey from the Commonwealth
Bank that would be conducted by the DBM Consultants. The report provides the information
about the annual turnover and growth of retailers and their organisation. The innovation
based performance, dynamics of the innovation, retailer behaviours, Drivers improvement,
Perceived benefits, Challenges, Investment in innovation of investment Areas investing
technologies and the Returns are analysed and examined by the insight report [5].
4. Suggestions
In the insight report, the retailing companies and the CommBank are faced many issues on
their business. The major lacking on the retailing and the business cases based on time-
dedicated human resources, financial, skill, and quantifying difficulty [6]. To improve the
insight report, the CommBank should monitor the issues and challenges by reducing these
impacts. The monitoring impacts and resolving the challenges are used to improve the insight
report based on the production and business improvement. The analysis of retailing
information with effective return arguments could be more useful for the decision-making
and business solution desiring process. Enhancing the enterprisers and decision makers on the
complex challenges and making their behaviours improvement on the business could be
increase the performance of the insight. By solving these issues on the retailing sector could
be used to increase the market position and Improved efficiencies by improving the
productivity with Better outcomes [7].
Regression analysis
1. Example
The regression analysis of the data mining concept has been used on where the large data
analysis required places, it provides a well known prediction of data and in forecasting. The
accuracy based results are analysed and predicted from the regression analysis, it also more
helpful to the independent based business functions. Relations among the constrains and data
could be identified using labels and the accurate results are identified for business
development and production increasing functions. The regression analysis could be used to
3
Paraphrase This Document
Need a fresh take? Get an instant paraphrase of this document with our AI Paraphraser
optimise the business process. In the rainfall data, the rain gauges could be predicted by the
regression analysis and its techniques, which could be used as OLS [8].
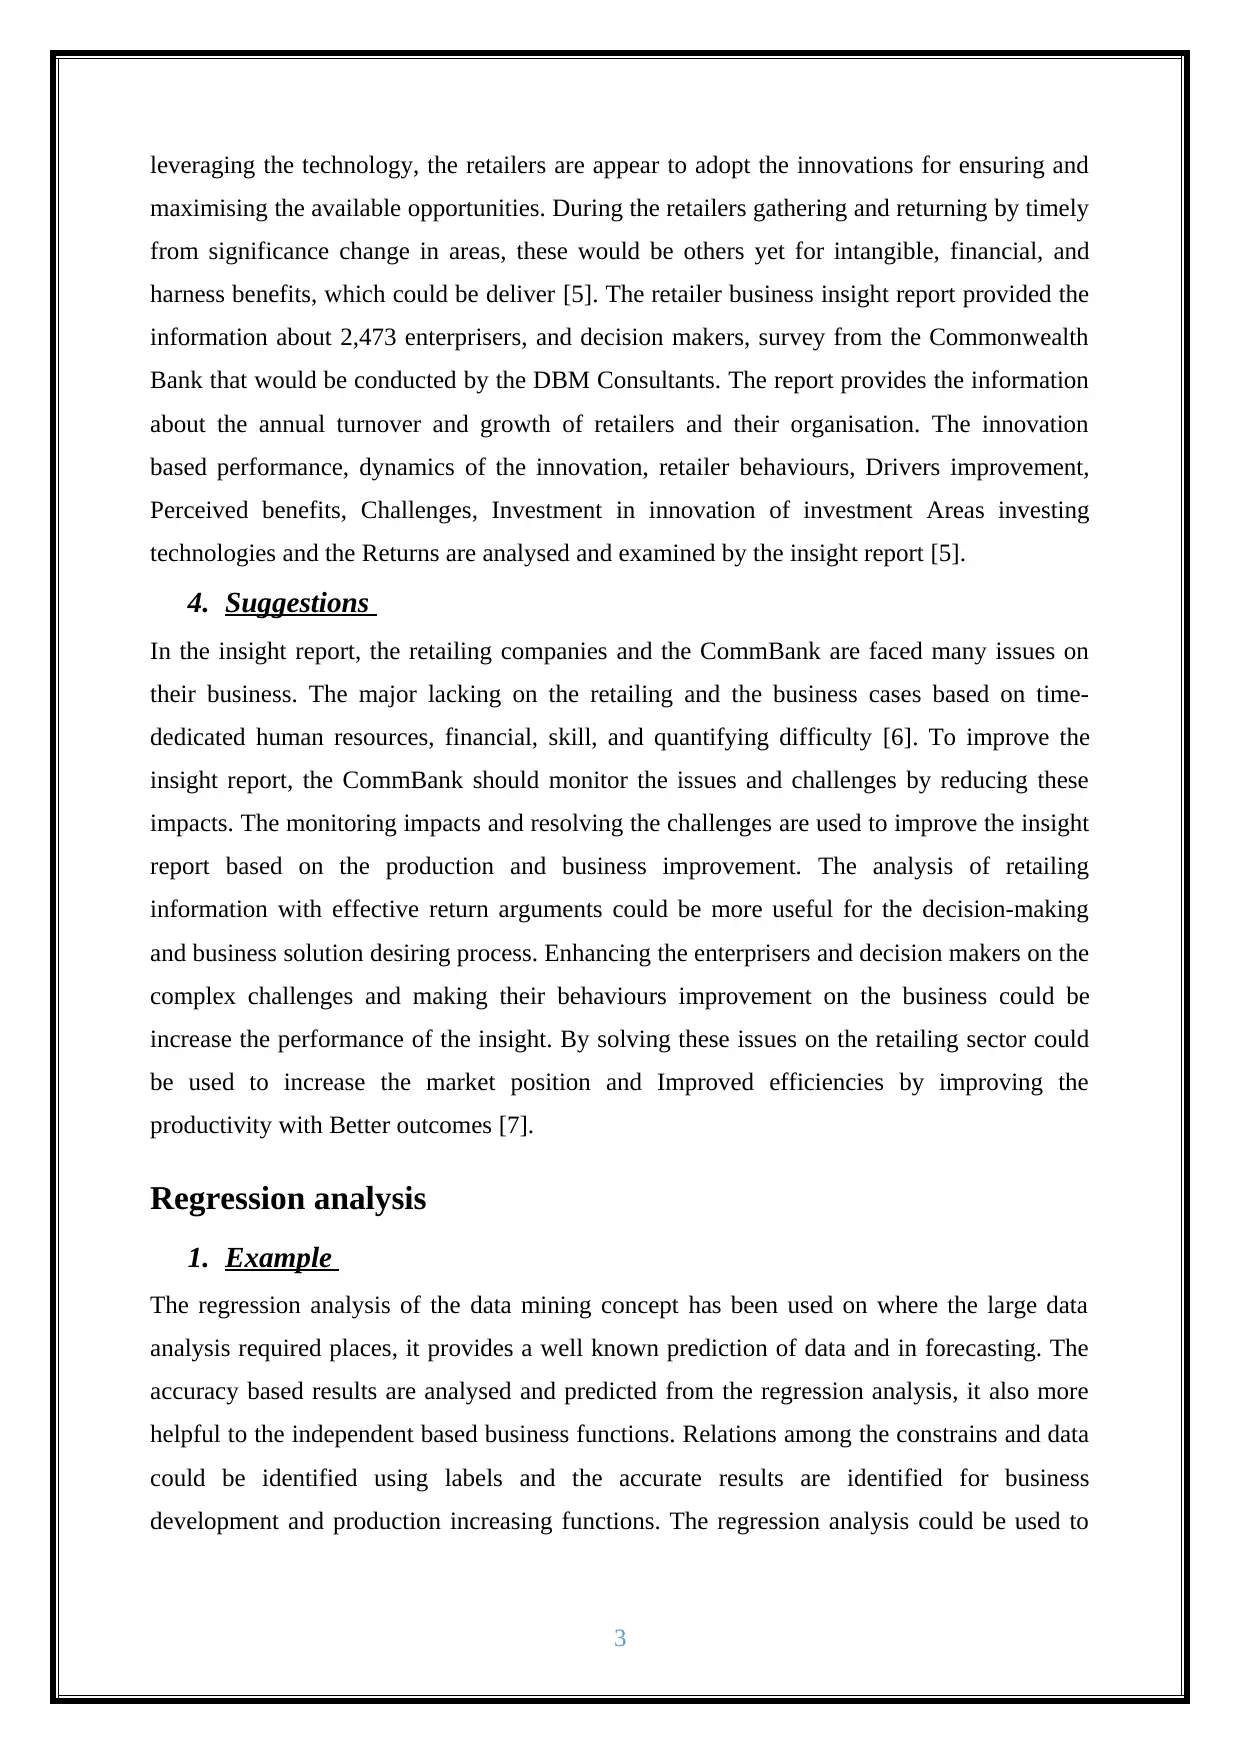
2. Height and weight of friends
The data sets of height and weight could be gathered and used for the data prediction analysis
of regression analysis.
Person Height Weight
1 120 40
2 160 45
3 140 50
4 150 67
5 110 60
6 130 65
7 180 70
8 170 72
9 210 80
10 190 65
The above given table contains 10 persons information like height and weight, every person
has different height and weight, so the information are differed in the dataset based on the
person [8].
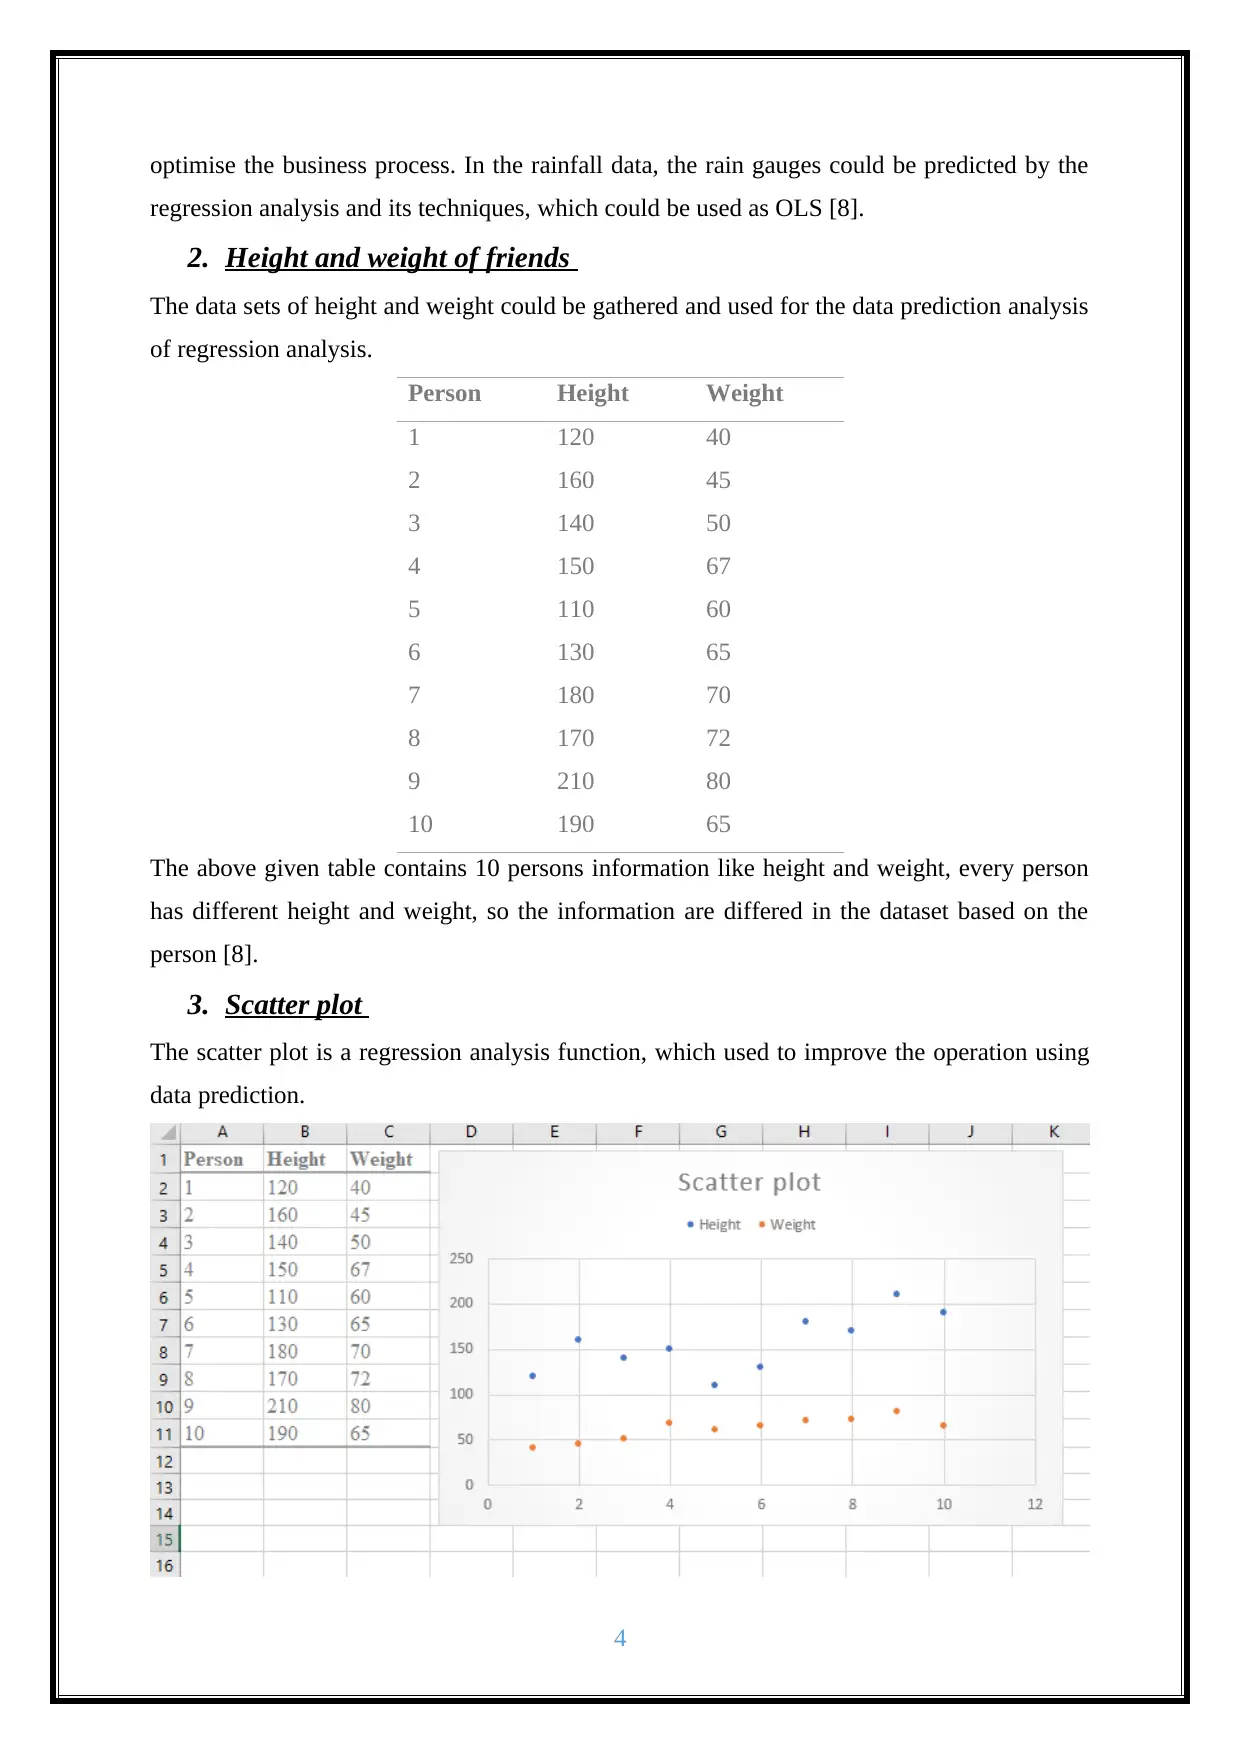
3. Scatter plot
The scatter plot is a regression analysis function, which used to improve the operation using
data prediction.
4
regression analysis and its techniques, which could be used as OLS [8].
2. Height and weight of friends
The data sets of height and weight could be gathered and used for the data prediction analysis
of regression analysis.
Person Height Weight
1 120 40
2 160 45
3 140 50
4 150 67
5 110 60
6 130 65
7 180 70
8 170 72
9 210 80
10 190 65
The above given table contains 10 persons information like height and weight, every person
has different height and weight, so the information are differed in the dataset based on the
person [8].
3. Scatter plot
The scatter plot is a regression analysis function, which used to improve the operation using
data prediction.
4
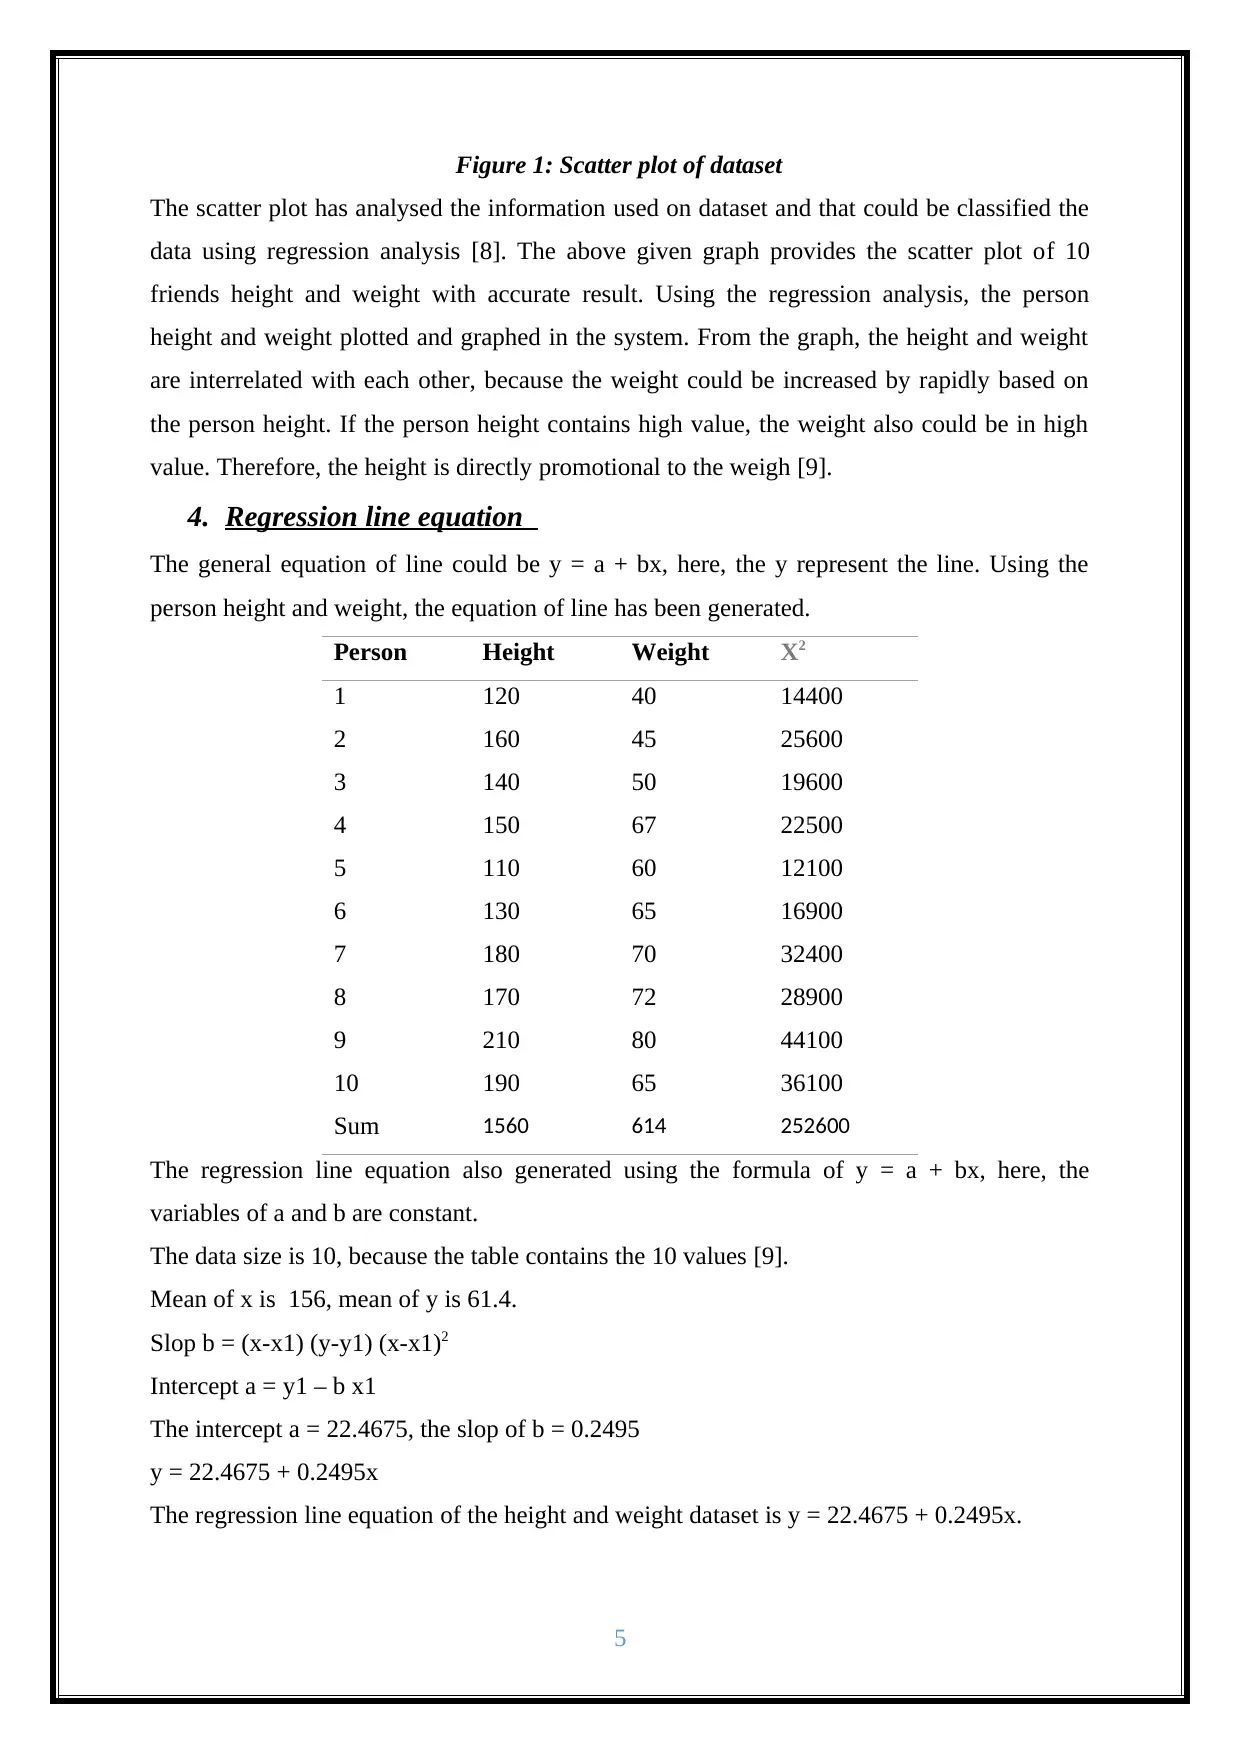
Figure 1: Scatter plot of dataset
The scatter plot has analysed the information used on dataset and that could be classified the
data using regression analysis [8]. The above given graph provides the scatter plot of 10
friends height and weight with accurate result. Using the regression analysis, the person
height and weight plotted and graphed in the system. From the graph, the height and weight
are interrelated with each other, because the weight could be increased by rapidly based on
the person height. If the person height contains high value, the weight also could be in high
value. Therefore, the height is directly promotional to the weigh [9].
4. Regression line equation
The general equation of line could be y = a + bx, here, the y represent the line. Using the
person height and weight, the equation of line has been generated.
Person Height Weight X2
1 120 40 14400
2 160 45 25600
3 140 50 19600
4 150 67 22500
5 110 60 12100
6 130 65 16900
7 180 70 32400
8 170 72 28900
9 210 80 44100
10 190 65 36100
Sum 1560 614 252600
The regression line equation also generated using the formula of y = a + bx, here, the
variables of a and b are constant.
The data size is 10, because the table contains the 10 values [9].
Mean of x is 156, mean of y is 61.4.
Slop b = (x-x1) (y-y1) (x-x1)2
Intercept a = y1 – b x1
The intercept a = 22.4675, the slop of b = 0.2495
y = 22.4675 + 0.2495x
The regression line equation of the height and weight dataset is y = 22.4675 + 0.2495x.
5
⊘ This is a preview!⊘
Do you want full access?
Subscribe today to unlock all pages.
Trusted by 1+ million students worldwide
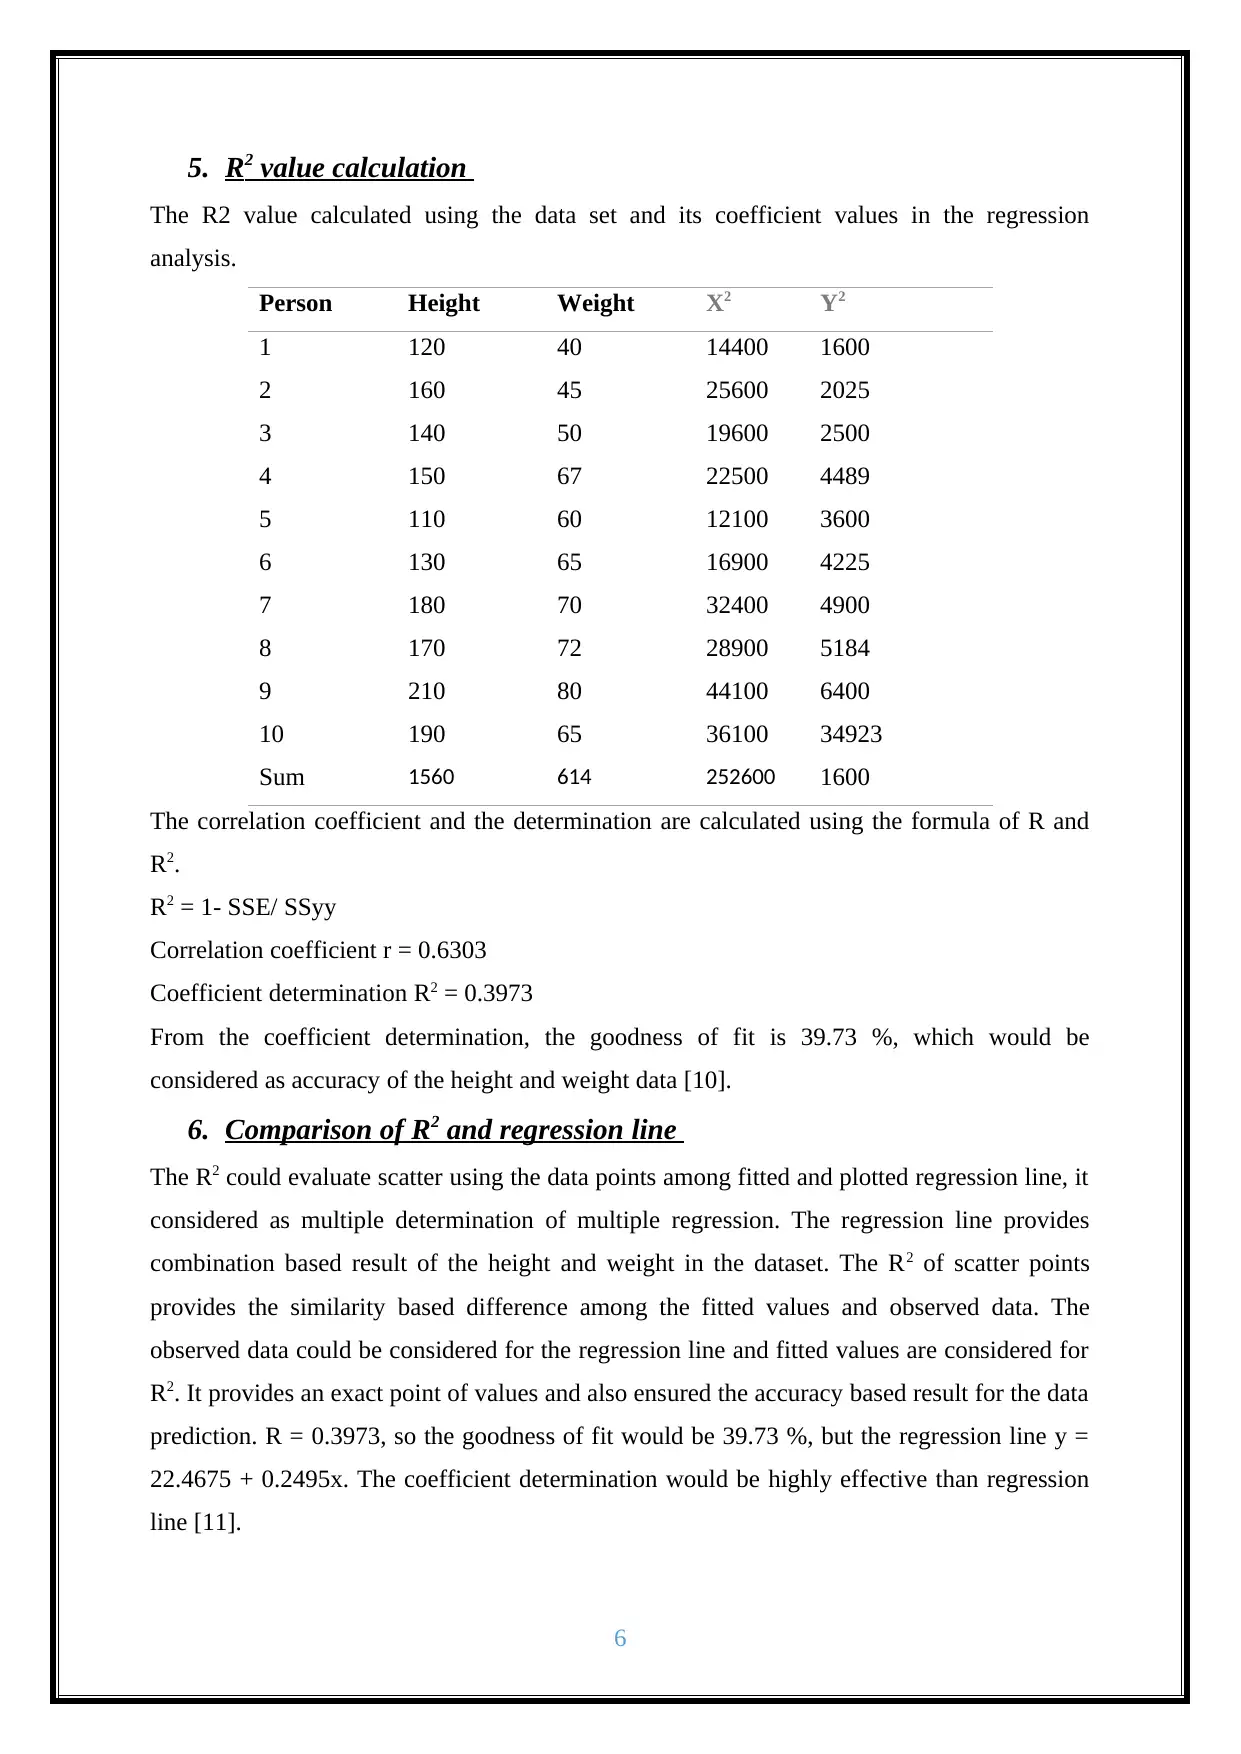
5. R2 value calculation
The R2 value calculated using the data set and its coefficient values in the regression
analysis.
Person Height Weight X2 Y2
1 120 40 14400 1600
2 160 45 25600 2025
3 140 50 19600 2500
4 150 67 22500 4489
5 110 60 12100 3600
6 130 65 16900 4225
7 180 70 32400 4900
8 170 72 28900 5184
9 210 80 44100 6400
10 190 65 36100 34923
Sum 1560 614 252600 1600
The correlation coefficient and the determination are calculated using the formula of R and
R2.
R2 = 1- SSE/ SSyy
Correlation coefficient r = 0.6303
Coefficient determination R2 = 0.3973
From the coefficient determination, the goodness of fit is 39.73 %, which would be
considered as accuracy of the height and weight data [10].
6. Comparison of R2 and regression line
The R2 could evaluate scatter using the data points among fitted and plotted regression line, it
considered as multiple determination of multiple regression. The regression line provides
combination based result of the height and weight in the dataset. The R2 of scatter points
provides the similarity based difference among the fitted values and observed data. The
observed data could be considered for the regression line and fitted values are considered for
R2. It provides an exact point of values and also ensured the accuracy based result for the data
prediction. R = 0.3973, so the goodness of fit would be 39.73 %, but the regression line y =
22.4675 + 0.2495x. The coefficient determination would be highly effective than regression
line [11].
6
Paraphrase This Document
Need a fresh take? Get an instant paraphrase of this document with our AI Paraphraser
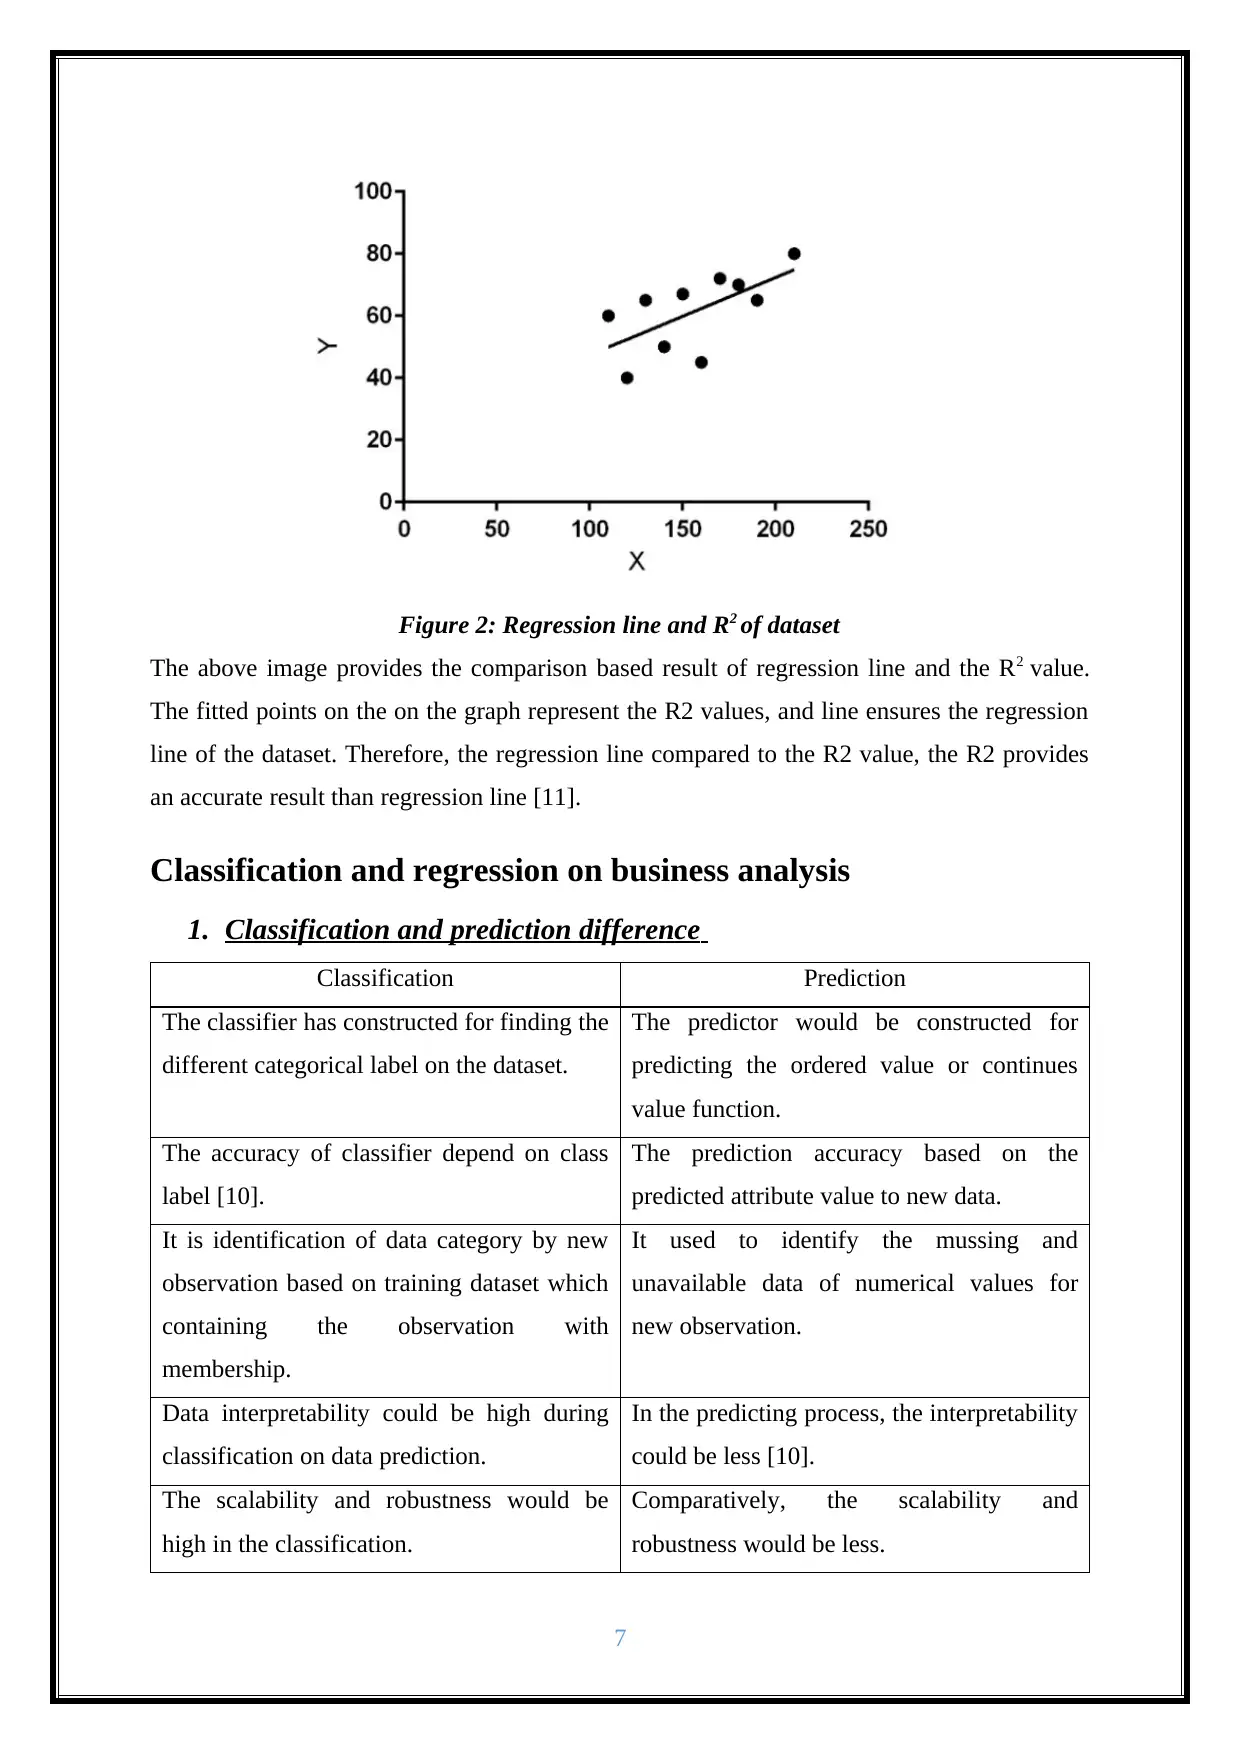
Figure 2: Regression line and R2 of dataset
The above image provides the comparison based result of regression line and the R2 value.
The fitted points on the on the graph represent the R2 values, and line ensures the regression
line of the dataset. Therefore, the regression line compared to the R2 value, the R2 provides
an accurate result than regression line [11].
Classification and regression on business analysis
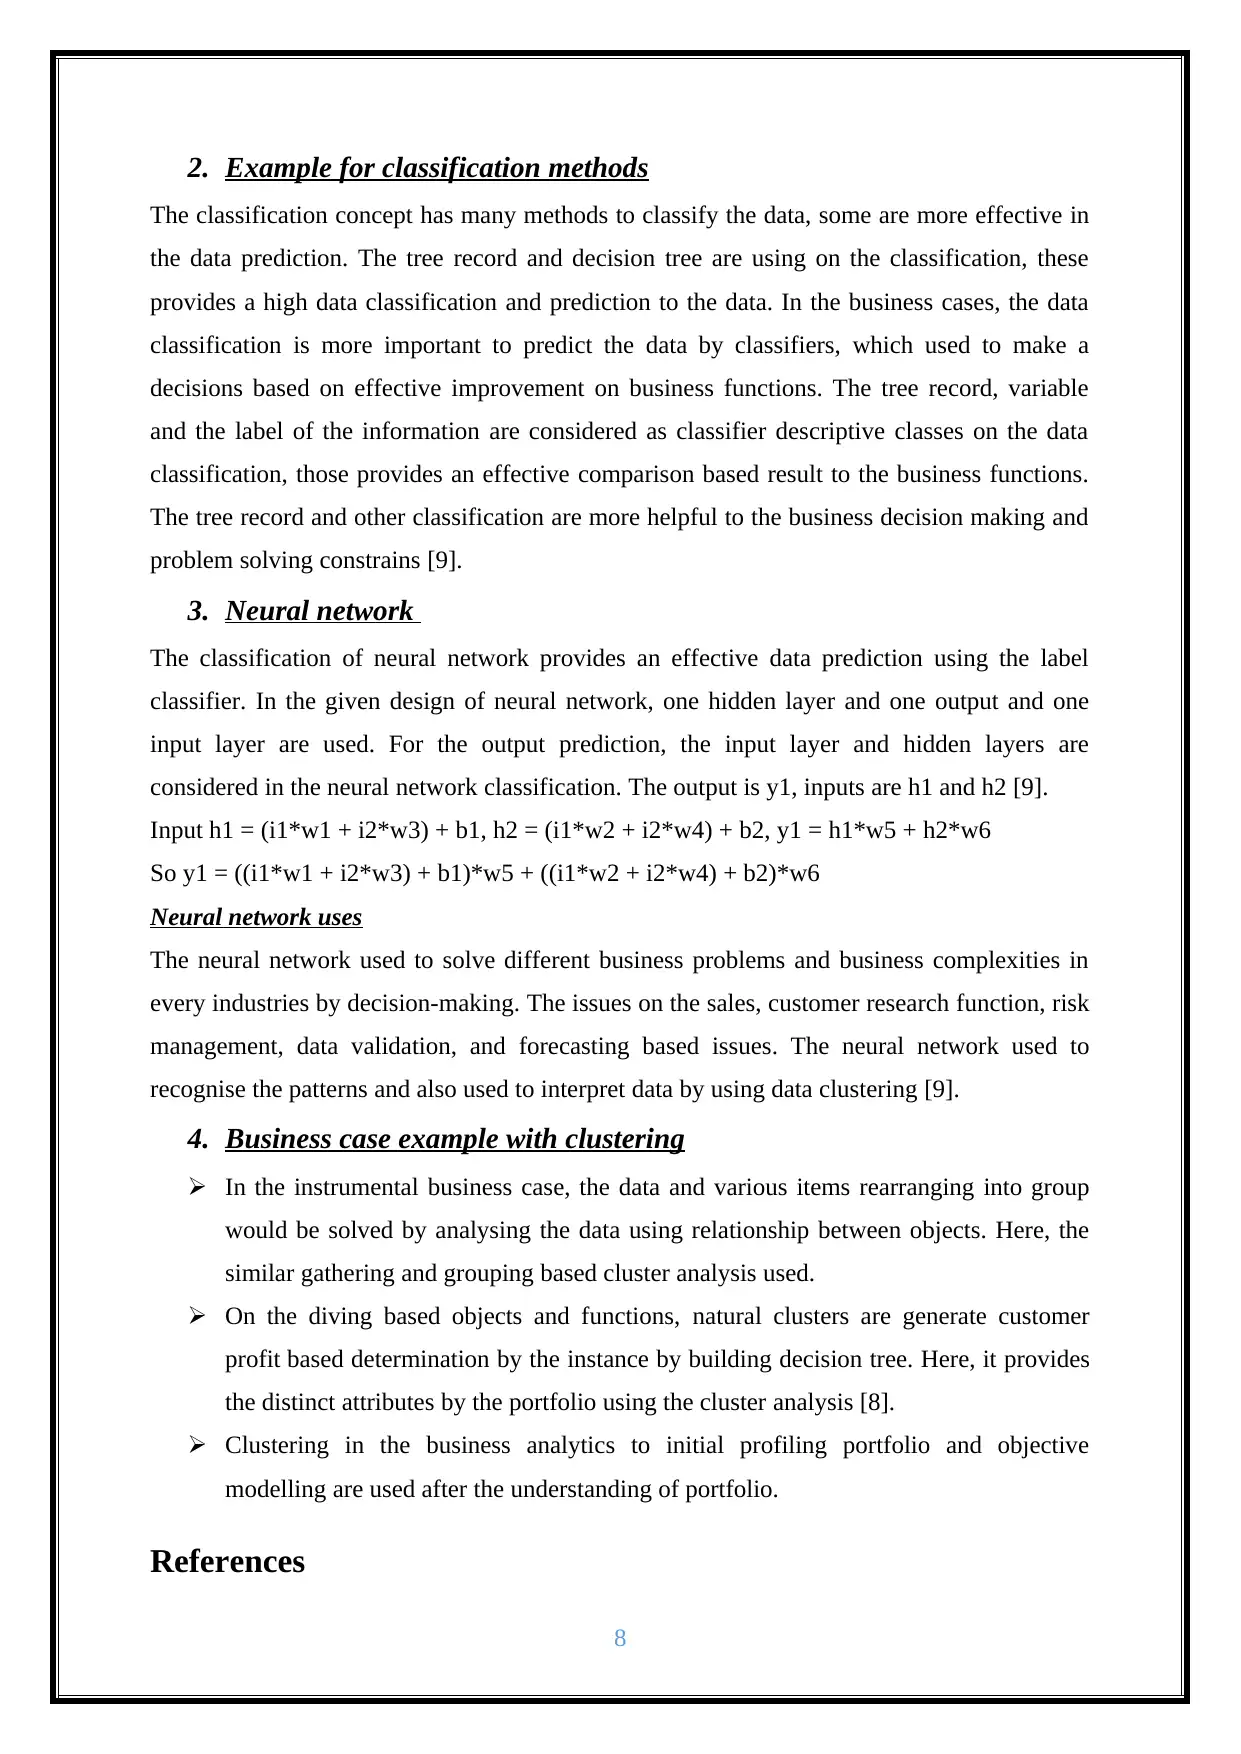
1. Classification and prediction difference
Classification Prediction
The classifier has constructed for finding the
different categorical label on the dataset.
The predictor would be constructed for
predicting the ordered value or continues
value function.
The accuracy of classifier depend on class
label [10].
The prediction accuracy based on the
predicted attribute value to new data.
It is identification of data category by new
observation based on training dataset which
containing the observation with
membership.
It used to identify the mussing and
unavailable data of numerical values for
new observation.
Data interpretability could be high during
classification on data prediction.
In the predicting process, the interpretability
could be less [10].
The scalability and robustness would be
high in the classification.
Comparatively, the scalability and
robustness would be less.
7
The above image provides the comparison based result of regression line and the R2 value.
The fitted points on the on the graph represent the R2 values, and line ensures the regression
line of the dataset. Therefore, the regression line compared to the R2 value, the R2 provides
an accurate result than regression line [11].
Classification and regression on business analysis
1. Classification and prediction difference
Classification Prediction
The classifier has constructed for finding the
different categorical label on the dataset.
The predictor would be constructed for
predicting the ordered value or continues
value function.
The accuracy of classifier depend on class
label [10].
The prediction accuracy based on the
predicted attribute value to new data.
It is identification of data category by new
observation based on training dataset which
containing the observation with
membership.
It used to identify the mussing and
unavailable data of numerical values for
new observation.
Data interpretability could be high during
classification on data prediction.
In the predicting process, the interpretability
could be less [10].
The scalability and robustness would be
high in the classification.
Comparatively, the scalability and
robustness would be less.
7
2. Example for classification methods
The classification concept has many methods to classify the data, some are more effective in
the data prediction. The tree record and decision tree are using on the classification, these
provides a high data classification and prediction to the data. In the business cases, the data
classification is more important to predict the data by classifiers, which used to make a
decisions based on effective improvement on business functions. The tree record, variable
and the label of the information are considered as classifier descriptive classes on the data
classification, those provides an effective comparison based result to the business functions.
The tree record and other classification are more helpful to the business decision making and
problem solving constrains [9].
3. Neural network
The classification of neural network provides an effective data prediction using the label
classifier. In the given design of neural network, one hidden layer and one output and one
input layer are used. For the output prediction, the input layer and hidden layers are
considered in the neural network classification. The output is y1, inputs are h1 and h2 [9].
Input h1 = (i1*w1 + i2*w3) + b1, h2 = (i1*w2 + i2*w4) + b2, y1 = h1*w5 + h2*w6
So y1 = ((i1*w1 + i2*w3) + b1)*w5 + ((i1*w2 + i2*w4) + b2)*w6
Neural network uses
The neural network used to solve different business problems and business complexities in
every industries by decision-making. The issues on the sales, customer research function, risk
management, data validation, and forecasting based issues. The neural network used to
recognise the patterns and also used to interpret data by using data clustering [9].
4. Business case example with clustering
In the instrumental business case, the data and various items rearranging into group
would be solved by analysing the data using relationship between objects. Here, the
similar gathering and grouping based cluster analysis used.
On the diving based objects and functions, natural clusters are generate customer
profit based determination by the instance by building decision tree. Here, it provides
the distinct attributes by the portfolio using the cluster analysis [8].
Clustering in the business analytics to initial profiling portfolio and objective
modelling are used after the understanding of portfolio.
References
8
⊘ This is a preview!⊘
Do you want full access?
Subscribe today to unlock all pages.
Trusted by 1+ million students worldwide
[1] K. M. L. Jones, “Learning analytics and higher education: a proposed model for
establishing informed consent mechanisms to promote student privacy and autonomy,”
International Journal of Educational Technology in Higher Education, 2019.
[2] Y. Chen, “Data Analytics and STEM Student Success: The Impact of Predictive
Analytics-Informed Academic Advising Among Undeclared First-Year Engineering
Students,” Journal of College Student Retention: Research, Theory & Practice, 2020.
[3] D. Ifenthaler, “Utilising learning analytics to support study success in higher education:
a systematic review,” Educational Technology Research and Development, 2020.
[4] ,. E. T. E. B. Arafat Salih Aydinera, “Business analytics and firm performance: The
mediating role of business process performance,” Journal of Business Research 96, pp.
228-137, 2019.
[5] T. S. K. H. Atsushi Kawahara, “Multivariate Regression Analysis to Predict
Postoperative Refractive Astigmatism in Cataract Surgery,” Journal of Ophthalmology,
2020 .
[6] T. Ö. Ebru Pekel Özmen, “Diagnosis of diabetes mellitus using artificial neural network
and classification and regression tree optimized with genetic algorithm,” Journal of
forecasting , 2020.
[7] W. Gata, “Analysis of Regression Algorithm to Predict Administration, Production,,”
IOP Conference Series: Materials Science and Engineering, 2019.
[8] C. F. a. H. Hauser, “Fast and Accurate CNN-based Brushing in Scatterplots,”
Eurographics Conference on Visualization 37(3), pp. 111-120, 2018.
[9] P. P. M. M. N. G. J. K. Ilias, “Big data and business analytics ecosystems: paving the
way towards digital transformation and sustainable societies,” Information Systems and
e-Business Management (16), pp. 479-491, 2018.
[10] B. S. B. P. R. G. K. C. M Krishna, “Predicting Student Performance usingClassification
and Regression Trees Algorithm,” International Journal of Innovative Technology and
Exploring Engineering (IJITEE), 2020.
[11] V. V. P. S. D. G. Pratibha V. Jadhav, “Classification of Categorical Outcome Variable
Based on Logistic Regression and Tree Algorithm,” International Journal of Recent
Technology and Engineering (IJRTE), 2020.
9
1 out of 10
Related Documents


Your All-in-One AI-Powered Toolkit for Academic Success.
+13062052269
info@desklib.com
Available 24*7 on WhatsApp / Email
![[object Object]](/_next/static/media/star-bottom.7253800d.svg)
Unlock your academic potential
Copyright © 2020–2026 A2Z Services. All Rights Reserved. Developed and managed by ZUCOL.