MITS6002 Business Analytics: CommBank Retail Report & Regression

Verified

Added on  2022/10/10

|8
|1662
|5
Homework Assignment
AI Summary
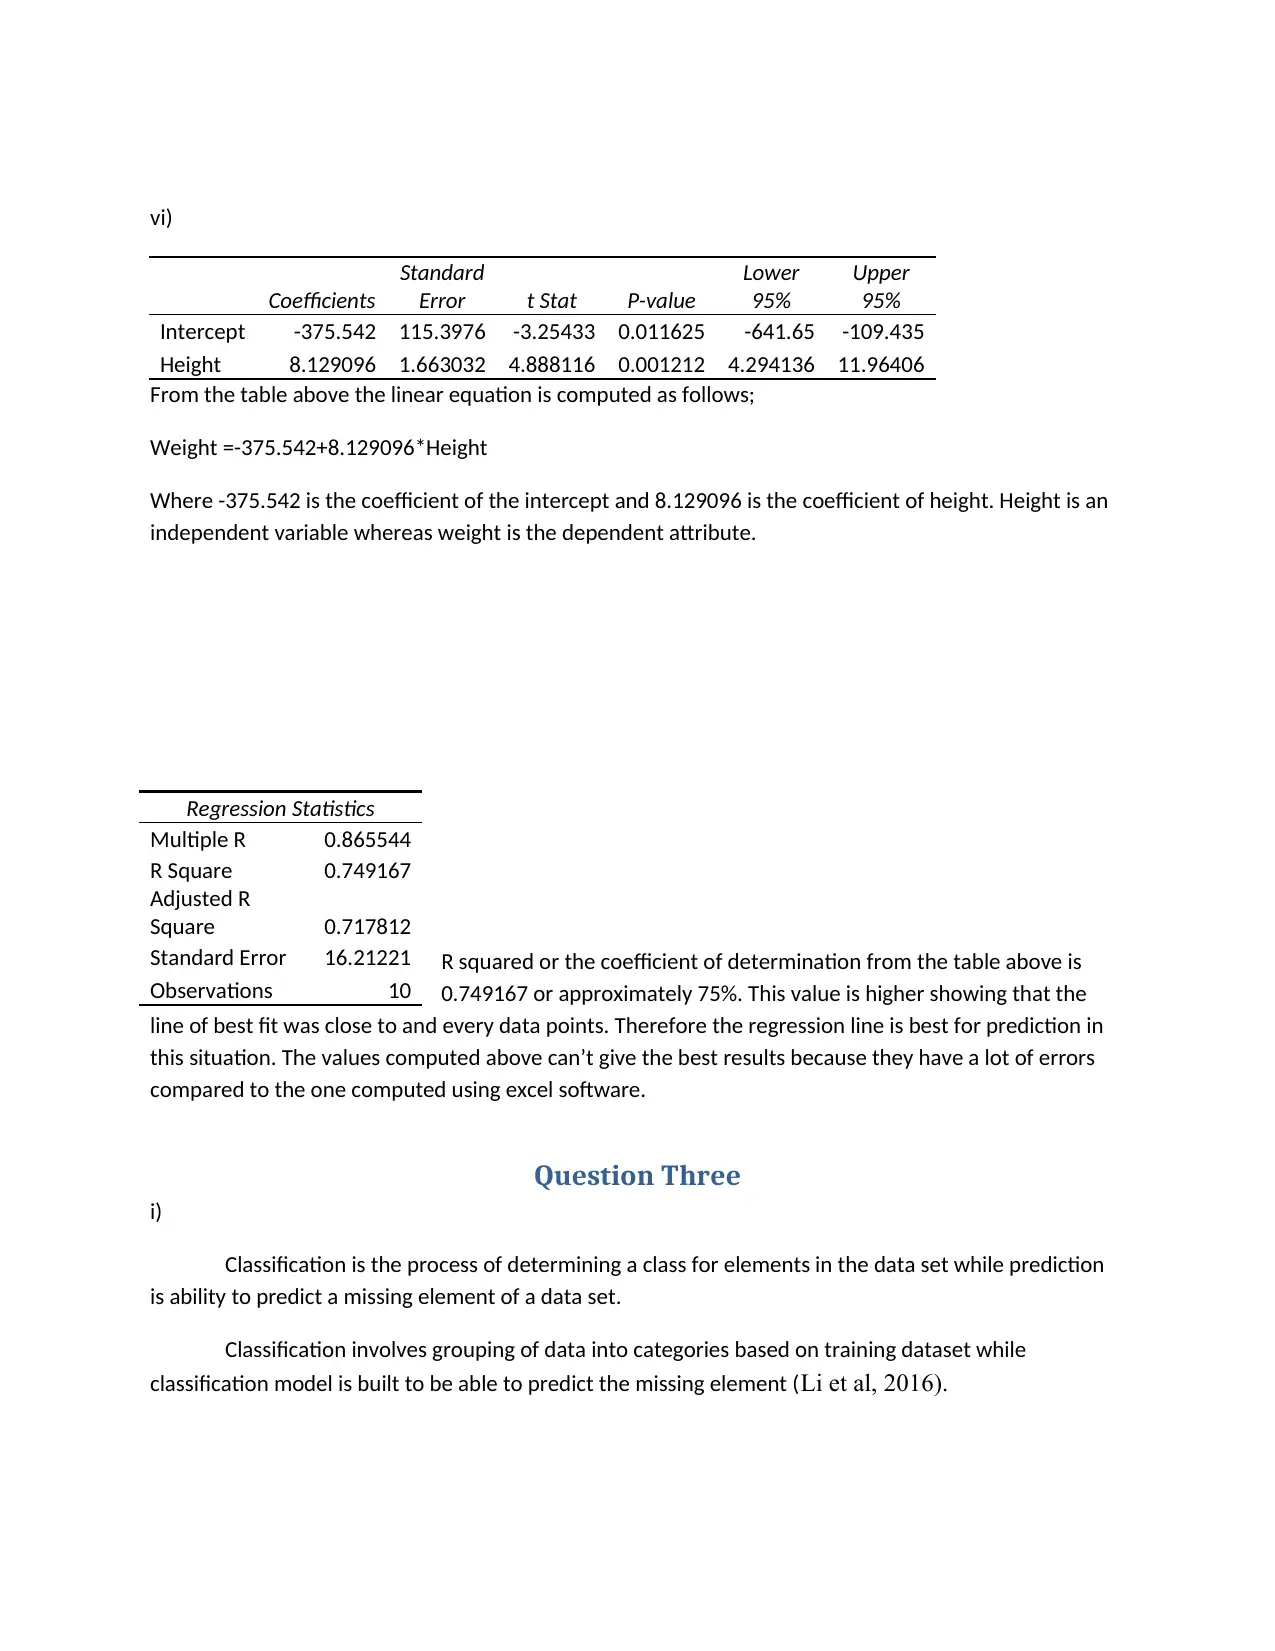
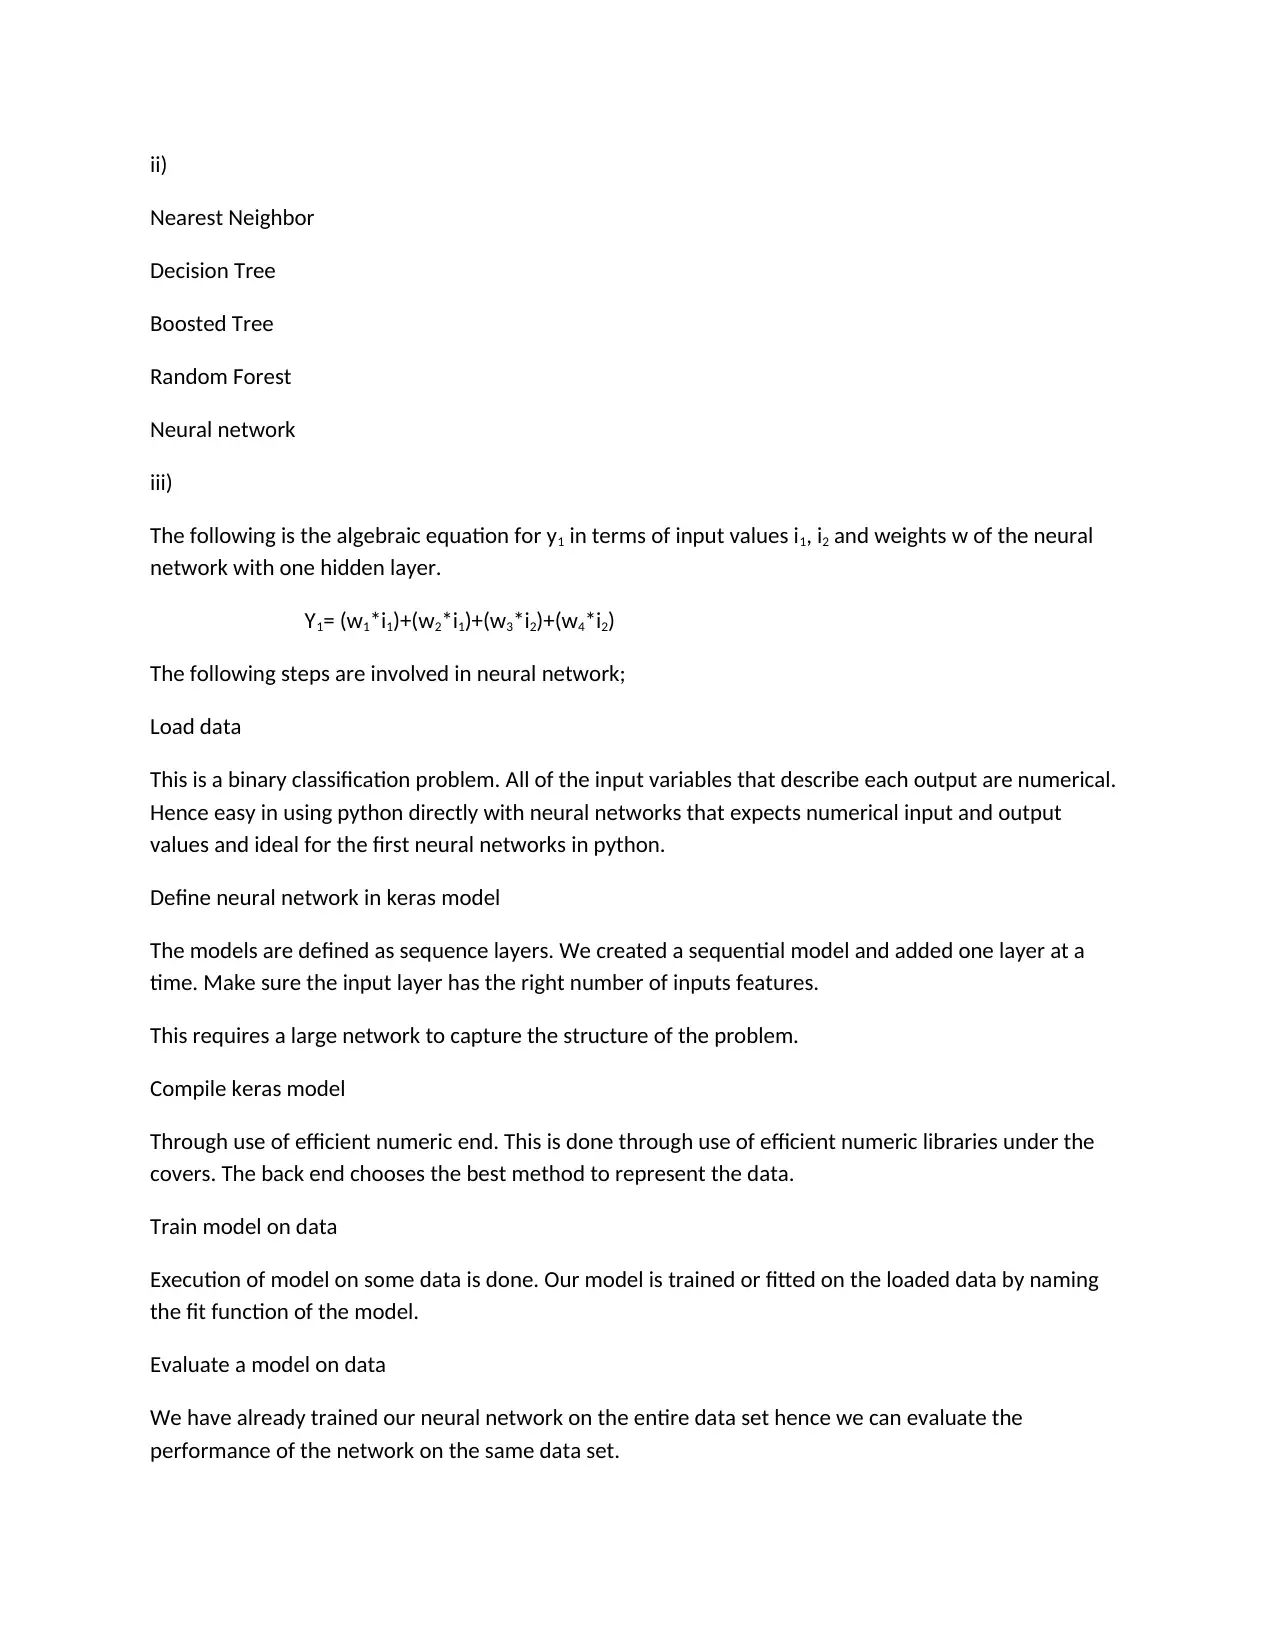
This assignment solution provides an analysis of the CommBank Retail Business Insights Report, focusing on visualization quality, presentability, and information relevance for decision-making. It summarizes the report's key findings regarding innovation in the retail sector and suggests improvements for future reports. Additionally, the solution includes a regression analysis using provided height and weight data, computing the regression line equation, R-squared value, and interpreting the relationship between the variables. The assignment further explores classification and prediction concepts, including neural networks, and provides examples of clustering applications in retail and IT sectors. The solution also provides an algebraic equation for a neural network with one hidden layer.
Document Page
Question one
i)
Quality visualization
Commbank business retail insight report responds to competitive pressures and the retailers in Australia
desires to drive efficiency within their businesses hence growth in performance. This has helped retailers
to adopt to an innovative mindset in production, technology, growth hence maximization on every
opportunity.
Presentability
Commbank retail business is comprised of quantitative survey sub sets of business owners, decision
makers and managers.
The information provided on commbank retail business is on innovation index measures that consist of
15 core elements of innovation across management capability and entrepreneurial behavior.
ii)
Dynamic of innovation investment
Retailers behaviors and capabilities have enhanced innovation hence through decision making they can
incorporate innovation into staff hiring, evaluation process of the business hence willingness to take
risks.
Investment innovation
Retailers are likely to take part or invest in innovative sales and marketing .Through decision making
retailers are able to understand and put practice new methods of training staffs and renovation of their
stores online.
Return investment
An example where retailers are receiving almost two dollars from every dollar invested .In innovation ,
this suggest that you don’t need to have significant budgets to generate a substantial return on their
innovation while retailers are making decisions concerning their business based on return .They should
also consider the amount invested to produce twice the amount invested.
Adoption of innovation behavioral traits
Retailers will change their behaviors in business and be innovative by considering online platform for
selling their products and attracting new customers.
tabler-icon-diamond-filled.svg

Secure Best Marks with AI Grader

Need help grading? Try our AI Grader for instant feedback on your assignments.
Document Page
iii)
Summary
The insight report on commbank retail business is based on a sub sets of wide range of quantitative
survey .It has an innovation index which measures 15 core elements of innovation across management
capability and entrepreneurial behavior .Some of the methodology tools used by Commbank retail
business to respond to the competitive pressure ,desire to be successful within their business hence
growth in performance of the business .The tools are ;dynamics on innovation ,investment
innovation ,return innovation and finally the ability of the retailer to adopt innovation behavioral traits.
The tools focuses on different ways a retailer can be innovative and invest the resources he or she
owns to the business and hence lead to a gain in profit return .This is influenced by a retailer behavioral
traits.
iv)
The report should offer information on products performance, hence the ability of the retailer to decide
which product is worth investing on.
The insight report should offer sales report on how much more the business is generating in a certain
period of time.
Question two
i)
Regression analysis is used in statistics to be able to find trends. An example of someone who has been
adding weight over the past years, it is easy to predict how he or she will weigh in the next five years , if
he or she continues gaining weight at the same speed.
ii) The heights and weights of students in Kenya school
Stud
ent
Height Weigh
t
1 73.84
702
241.8
936
2 68.78
19
162.3
105
3 74.11
011
212.7
409
4 71.73
098
220.0
425
5 69.88
18
206.3
498
Document Page
6 67.25
302
152.2
122
7 68.78
508
183.9
279
8 68.34
852
167.9
711
9 67.01
895
175.9
294
10 63.45
649
156.3
997
iii)
62 64 66 68 70 72 74 76
0
50
100
150
200
250
300
Weight for height graph
Hieght of the students
Weight for the students
There is a relationship between weight and height therefore as height increases weight also increases,
showing that there is a direct proportion.
iv)
Studen
t
Height(x
)
Weight
(y)
X*y X2 Y2
1 73.8470
2
241.893
6
17863.1
2
5453.38
2
58512.5
2 68.7819 162.310
5
11164.0
2
4730.95 26344.6
9
3 74.1101 212.740 15766.2 5492.30 45258.6
Document Page
1 9 5 8 7
4 71.7309
8
220.042
5
15783.8
6
5145.33
3
48418.6
9
5 69.8818 206.349
8
14420.0
9
4883.46
5
42580.2
4
6 67.2530
2
152.212
2
10236.7
3
4522.96
8
23168.5
4
7 68.7850
8
183.927
9
12651.4
9
4731.38
7
33829.4
7
8 68.3485
2
167.971
1
11480.5
8
4671.52 28214.2
9
9 67.0189
5
175.929
4
11790.6
1
4491.54 30951.1
7
10 63.4564
9
156.399
7
9924.57
5
4026.72
7
24460.8
6
Total 693.213
9
1879.77
7
131081.
3
48149.5
8
361739.
1
Weight = a + b*Height
a= ((y)(x2) – (x)(y))/((n(x2)-(x)2)
b = (n(yx) – (x)(y))/((n(x2)-(x)2)
We have;
a = (1879.777*48149.58)-(693.2139*131081.3)/10(48149.58)-(693.2139)2
=-0.0822563
b = 10(131081.3)-(693.2139*1879.777)/10(48149.58-(693.2139)2
=8.1296
Weight = -0.0822563 + 8.1296*Height
v)
r = ( nxy - x*y)/[nx2 – (x)2] [ny2- (y)2]
=-478790.64931/8925.3668225
= -5.6161
Therefore r2 is 31.54
Since the value is negative and is small the relationship between these variables is weak.
tabler-icon-diamond-filled.svg

Secure Best Marks with AI Grader

Need help grading? Try our AI Grader for instant feedback on your assignments.
Document Page
vi)
Coefficients
Standard
Error t Stat P-value
Lower
95%
Upper
95%
Intercept -375.542 115.3976 -3.25433 0.011625 -641.65 -109.435
Height 8.129096 1.663032 4.888116 0.001212 4.294136 11.96406
From the table above the linear equation is computed as follows;
Weight =-375.542+8.129096*Height
Where -375.542 is the coefficient of the intercept and 8.129096 is the coefficient of height. Height is an
independent variable whereas weight is the dependent attribute.
R squared or the coefficient of determination from the table above is
0.749167 or approximately 75%. This value is higher showing that the
line of best fit was close to and every data points. Therefore the regression line is best for prediction in
this situation. The values computed above can’t give the best results because they have a lot of errors
compared to the one computed using excel software.
Question Three
i)
Classification is the process of determining a class for elements in the data set while prediction
is ability to predict a missing element of a data set.
Classification involves grouping of data into categories based on training dataset while
classification model is built to be able to predict the missing element (Li et al, 2016).
Regression Statistics
Multiple R 0.865544
R Square 0.749167
Adjusted R
Square 0.717812
Standard Error 16.21221
Observations 10
Document Page
ii)
Nearest Neighbor
Decision Tree
Boosted Tree
Random Forest
Neural network
iii)
The following is the algebraic equation for y1 in terms of input values i1, i2 and weights w of the neural
network with one hidden layer.
Y1= (w1*i1)+(w2*i1)+(w3*i2)+(w4*i2)
The following steps are involved in neural network;
Load data
This is a binary classification problem. All of the input variables that describe each output are numerical.
Hence easy in using python directly with neural networks that expects numerical input and output
values and ideal for the first neural networks in python.
Define neural network in keras model
The models are defined as sequence layers. We created a sequential model and added one layer at a
time. Make sure the input layer has the right number of inputs features.
This requires a large network to capture the structure of the problem.
Compile keras model
Through use of efficient numeric end. This is done through use of efficient numeric libraries under the
covers. The back end chooses the best method to represent the data.
Train model on data
Execution of model on some data is done. Our model is trained or fitted on the loaded data by naming
the fit function of the model.
Evaluate a model on data
We have already trained our neural network on the entire data set hence we can evaluate the
performance of the network on the same data set.
Document Page
Make prediction with the model
Tie all the data in a complete circle or you can copy the code into a python code and save. Neural
network are stochastic algorithms, meaning that the same algorithm on the same data can train a
different model. Prediction is as easy as calling the predict function on the model. Sigmoid activation
function on the output layer, so the predictions will be a probability in range between 0 to 1 hence
conversion into crisp binary prediction for this classification.
iv)
A grocer uses clustering to segment 1.3 mm loyalty card customer into different groups of five base on
their buying trends. He then came up with a customized marketing strategy for every segment so that to
enable achieve the maximum.
In the IT section, varies network servers keep generating logs. Clustering will help in identifying slow
moving traffic, places where extra serves are needed to deal with the traffic (Giuffrida, Ferluga &
Valenti, 2015).
Clustering is also used in the financial services platform, to help supervise credit card transaction that
keep flowing in more frequently from several sites such as transactions at sales, mobile apps as well as
ecommerce sites to avoid and reduce credit card corruption.
tabler-icon-diamond-filled.svg

Paraphrase This Document

Need a fresh take? Get an instant paraphrase of this document with our AI Paraphraser
Document Page
References
Li, Y., Lan, C., Xing, J., Zeng, W., Yuan, C., & Liu, J. (2016, October). Online human action
detection using joint classification-regression recurrent neural networks. In European
Conference on Computer Vision (pp. 203-220). Springer, Cham.
Giuffrida, S., Ferluga, G., & Valenti, A. (2015). Capitalisation rates and'real estate semantic
chains': an application of clustering analysis. International Journal of Business
Intelligence and Data Mining, 10(2), 174-198.
chevron_up_icon
1 out of 8
circle_padding
hide_on_mobile
zoom_out_icon
[object Object]