HI5002 Finance for Business: CBA Financial Performance Analysis Report
VerifiedAdded on 2022/11/24
|12
|3160
|312
Report
AI Summary
This report presents a comprehensive financial analysis of the Commonwealth Bank of Australia (CBA), examining its performance over a three-year period. The analysis includes an overview of the company, followed by a detailed examination of its financial ratios, including profitability and operating efficiency ratios. The report delves into CBA's dividend policy, analyzing dividend payouts and trends. It also covers the concepts of systematic and unsystematic risk, providing insights into the risks faced by the bank. Based on the financial analysis, the report offers a recommendation to an institutional investor regarding investment in CBA. The analysis utilizes financial data to assess the bank's performance, providing a thorough understanding of its financial health and investment potential.

Running Head: FINANCE FOR BUSINESS 1
FINANCE FOR BUSINESS
[Name of Writer]
[Name of Institution]
FINANCE FOR BUSINESS
[Name of Writer]
[Name of Institution]
Paraphrase This Document
Need a fresh take? Get an instant paraphrase of this document with our AI Paraphraser
FINANCE FOR BUSINESS 2
I. Introduction:
This paper is aimed to observe and analyze financial status of any selected
organization and will be communicated to an institutional investor. Organization must be
listed at Australian Stock Exchange and industry with lucrative expected return. After
industry analysis, Commonwealth Bank of Australia is finalized and will analyzed for
financial performance over three years. Commonwealth Bank of Australia operates in
banking sector and register under ticker name of CBA. Commonwealth Bank of
Australia provide a range of financial services to Australia and abroad. Historical data of
Commonwealth Bank of Australia shows a stable growth and share price. There is no
any abnormal growth or deterioration of share price and net income. This report is
divided into three parts overview of selected company, financial analysis and
recommendation. Profitability ratios of Commonwealth Bank of Australia will be
analyzed to determine ability of organization to generate profit. Apart from profitability
ratios, operating efficiency ratios for last three years will also be discussed. Every
investor is interested to know about dividend trend and dividend policy of organization
therefore, dividend payout and current dividend policy will be discussed in detail. This
report also contain literature about Systematic risk and un-systemic risk. Based on the
financial analysis of the selected organization, a recommendation will be handed over to
investor. Recommendation letter will contain suggestion to invest or not to invest in
Commonwealth Bank of Australia.
II. Financial Analysis
II.1. Description of Company
Commonwealth Bank of Australia is listed on Australian Stock Exchange under
code CBA. Commonwealth Bank of Australia was established under banking act of
commonwealth in 1911 and just after one year it started its operation. Commonwealth
Bank of Australia started both general and saving services for Australia. With a
continuous and stable growth strategy, Commonwealth Bank is considered among
largest banks of world. Currently, there are almost 0.8 Million shareholders and about
52 thousand employees work in Commonwealth Bank of Australia. A large range of
financial services are provided to individual and institutional investors over the globe.
Commonwealth Bank provides saving and transaction accounts, term deposits,
personal and business loans, credit cards, insurance products, international payment,
and private banking services along with home loans (Yahoo Finance, 2019).
Commonwealth Bank of Australia also provide assets management services, debt
raising services and financial assistance. Commonwealth Bank facilitate customers with
more than 1000 branches and more than 4000 Automated Teller Machines alone in
Australia.
FINANCE FOR BUSINESS 3
There are many events in the history of Commonwealth Bank of Australia that
contributed to success such as mergers, acquisitions, international expansion and
innovative financial services. Among all, merger with State Bank of Victoria is
considered as reason of success and competitive advantage. In august 1990,
Commonwealth Bank of Australia initiated an agreement to merge with State Bank of
Victoria. This event helped organization to develop its leadership and paved into retail
branch banking services. Over a period of more than one century, Commonwealth Bank
of Australia faced many radical changes and risks but not only managed to survive but
pursued stable growth.
II.2. Ratio Analysis
Financial ratio analysis is a tool to analyze financial status of firms with simple
calculation (Babalola & Abiola, 2013). Financial experts have categorized financial
ratios to serve investors different purposes (Brown, 2012). Profitability ratios will help
investors to understand the ability of organization to generate profit for each dollar
invested (Petria, Capraru & Ihnatov, 2015). Operating efficiency ratios are used to
determine efficiency of firm in operations.
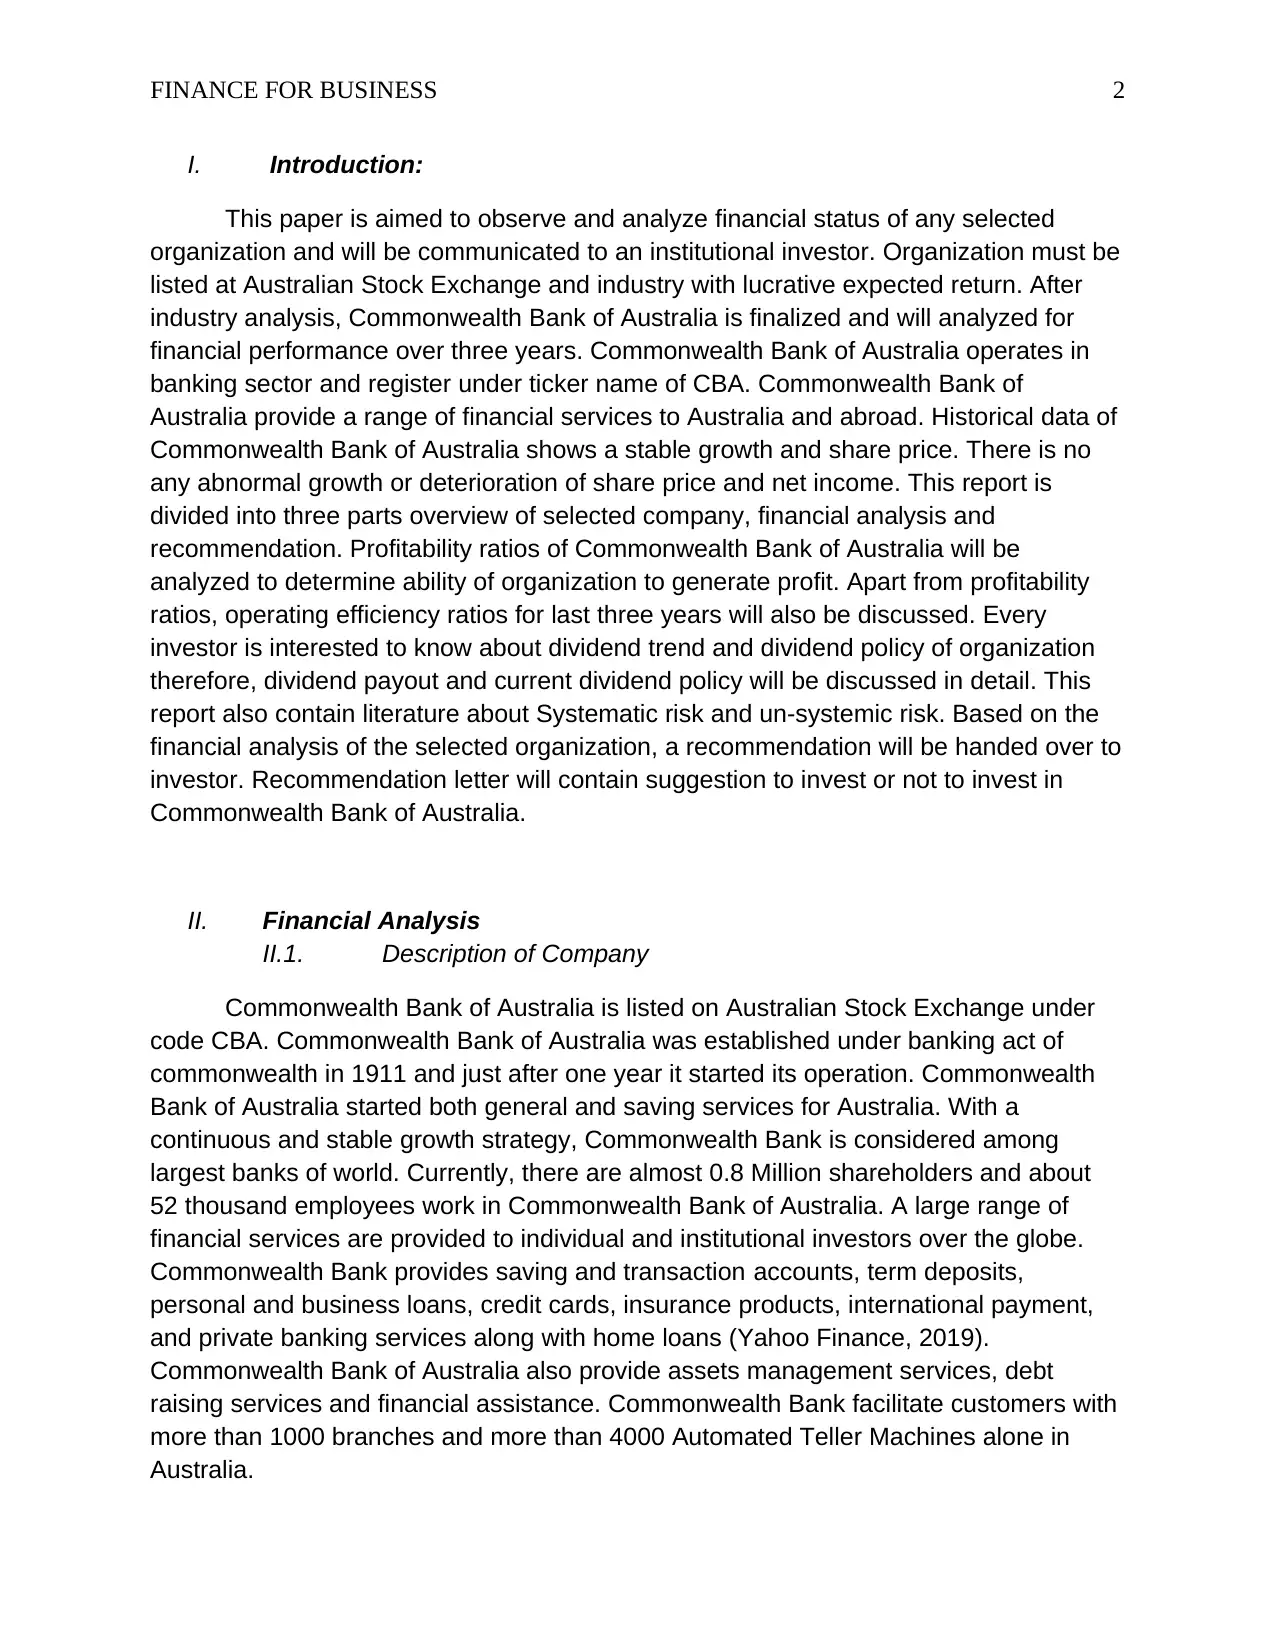
Operating efficiency ratios also known as activity ratios are used by management
and investors to measure ability of organization to utilize assets to generate sales
(Odunga, Nyangweso, Carter & Mwarumba, 2013). Net asset turnover shows that how
effectively resources are utilized by management to generate revenue (Lin, Liang &
Chen, 2011). Higher ratio shows that company is effectively utilizing resources to
generate revenue while lower ratio shows efficiency. Net asset turnover ratio of
Commonwealth Bank of Australia was 38.25%, 40.65% and 44.64% in year 2018, 2017
and 2016 respectively (Morningstar, 2019). Every year net asset turnover ratio is
decreasing which means that organization possess many idle resources. Other possible
reason for decline in net asset turnover ratio is highly expensive assets which are either
not used in sales generation or ineffectively used. Given below is graph of net asset
turnover ratio.
2016 2017 2018
0.34
0.36
0.38
0.4
0.42
0.44
0.46
0.4464290
4290429
0.4065277
91345121 0.3825444
63886243
Net Assets Turnover Ratio
There are many events in the history of Commonwealth Bank of Australia that
contributed to success such as mergers, acquisitions, international expansion and
innovative financial services. Among all, merger with State Bank of Victoria is
considered as reason of success and competitive advantage. In august 1990,
Commonwealth Bank of Australia initiated an agreement to merge with State Bank of
Victoria. This event helped organization to develop its leadership and paved into retail
branch banking services. Over a period of more than one century, Commonwealth Bank
of Australia faced many radical changes and risks but not only managed to survive but
pursued stable growth.
II.2. Ratio Analysis
Financial ratio analysis is a tool to analyze financial status of firms with simple
calculation (Babalola & Abiola, 2013). Financial experts have categorized financial
ratios to serve investors different purposes (Brown, 2012). Profitability ratios will help
investors to understand the ability of organization to generate profit for each dollar
invested (Petria, Capraru & Ihnatov, 2015). Operating efficiency ratios are used to
determine efficiency of firm in operations.
Operating efficiency ratios also known as activity ratios are used by management
and investors to measure ability of organization to utilize assets to generate sales
(Odunga, Nyangweso, Carter & Mwarumba, 2013). Net asset turnover shows that how
effectively resources are utilized by management to generate revenue (Lin, Liang &
Chen, 2011). Higher ratio shows that company is effectively utilizing resources to
generate revenue while lower ratio shows efficiency. Net asset turnover ratio of
Commonwealth Bank of Australia was 38.25%, 40.65% and 44.64% in year 2018, 2017
and 2016 respectively (Morningstar, 2019). Every year net asset turnover ratio is
decreasing which means that organization possess many idle resources. Other possible
reason for decline in net asset turnover ratio is highly expensive assets which are either
not used in sales generation or ineffectively used. Given below is graph of net asset
turnover ratio.
2016 2017 2018
0.34
0.36
0.38
0.4
0.42
0.44
0.46
0.4464290
4290429
0.4065277
91345121 0.3825444
63886243
Net Assets Turnover Ratio
⊘ This is a preview!⊘
Do you want full access?
Subscribe today to unlock all pages.
Trusted by 1+ million students worldwide
FINANCE FOR BUSINESS 4
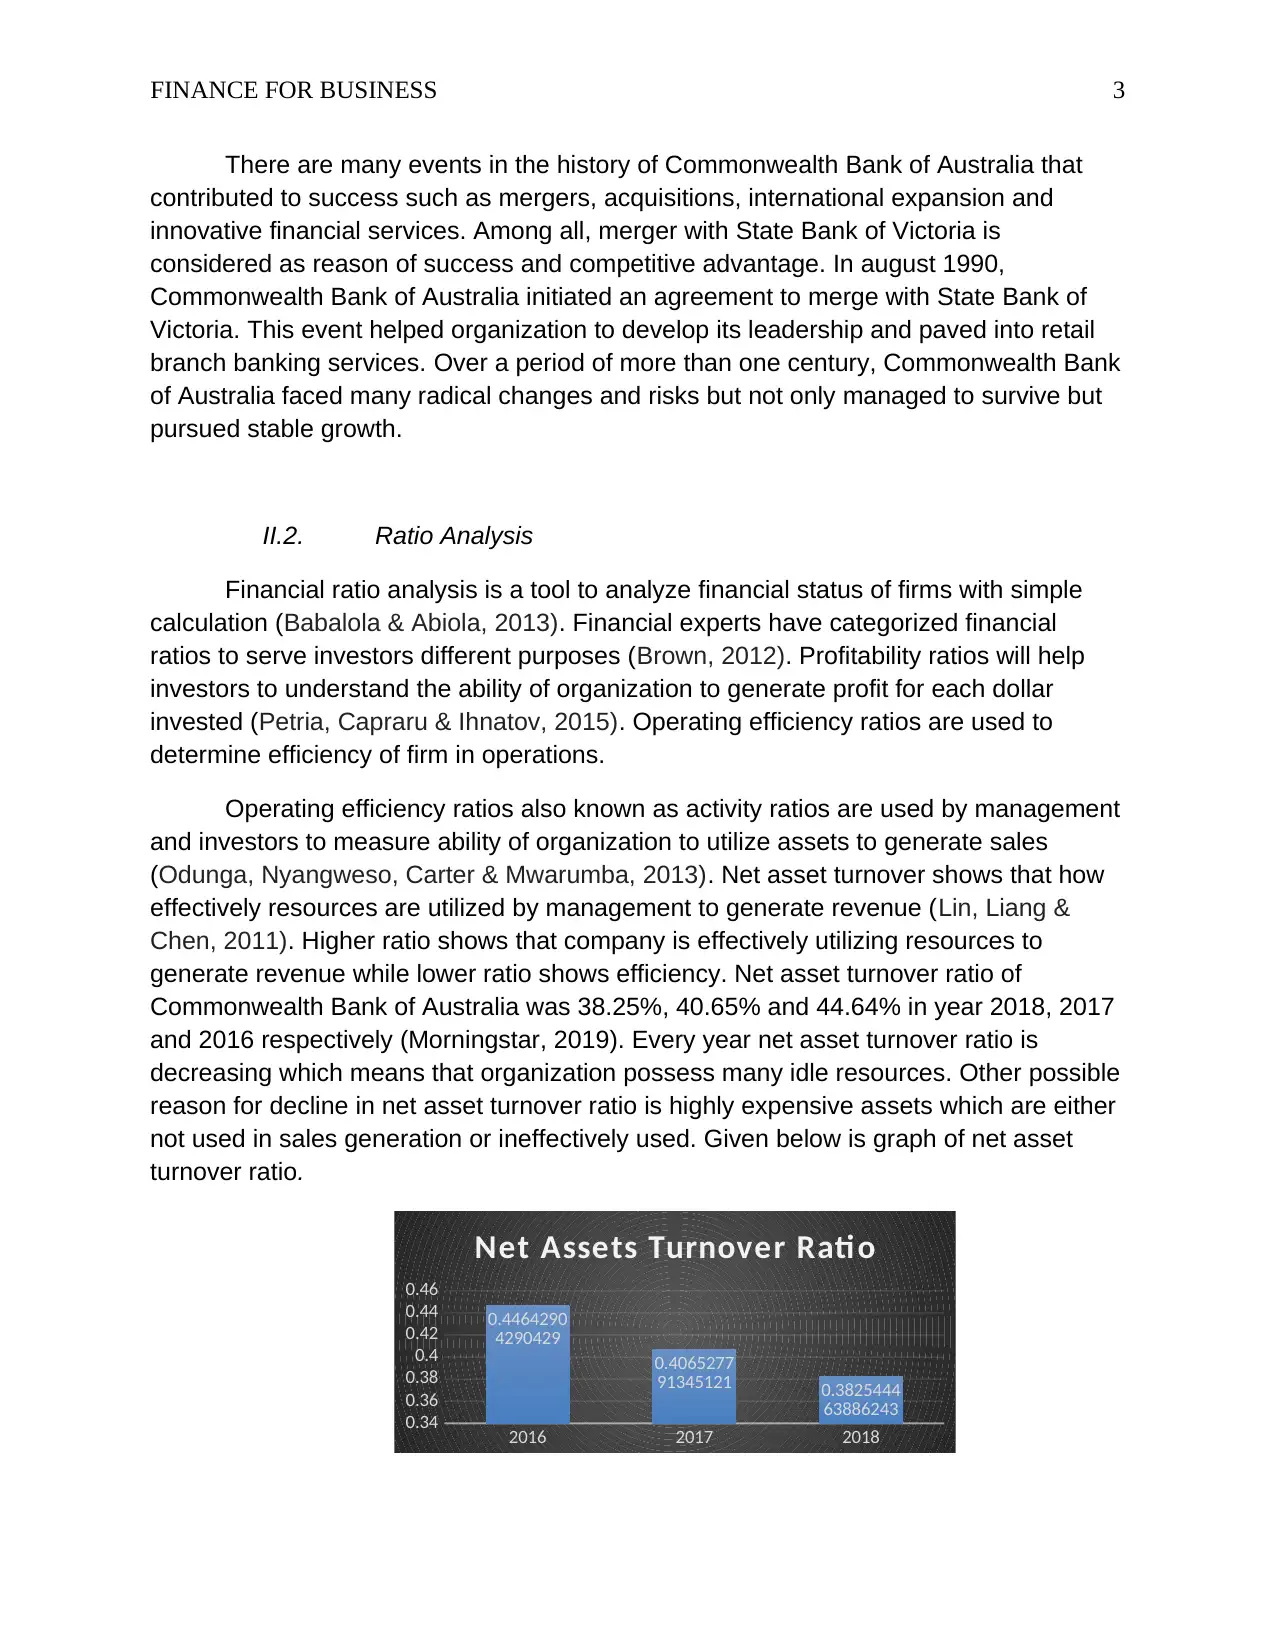
Efficiency ratio is widely used by banks because it tells ability of organization to
transform resources into revenue (Trujillo, 2013). Lower efficiency ratio is better
because lower ratio shows that company is effectively handling costs. A higher
efficiency ratio is associated with more inefficiency because more portion of revenue
goes to costs. Efficiency ratios of Commonwealth Bank of Australia were 46.9%, 47.1%
and 49.9% in 2018, 2017 and 2016 respectively. Efficiency ratio of Commonwealth
Bank of Australia is decreasing every year. Decreasing efficiency ratio means that
organizational performance and efficiency is improving. Given below is graph of
efficiency ratios for last three years that shows decreasing trend.
2016 2017 2018
0.45
0.46
0.47
0.48
0.49
0.5
0.51
0.4992163
70464559
0.4713603
46018683 0.4690385
89583997
Effi ciency Rati o
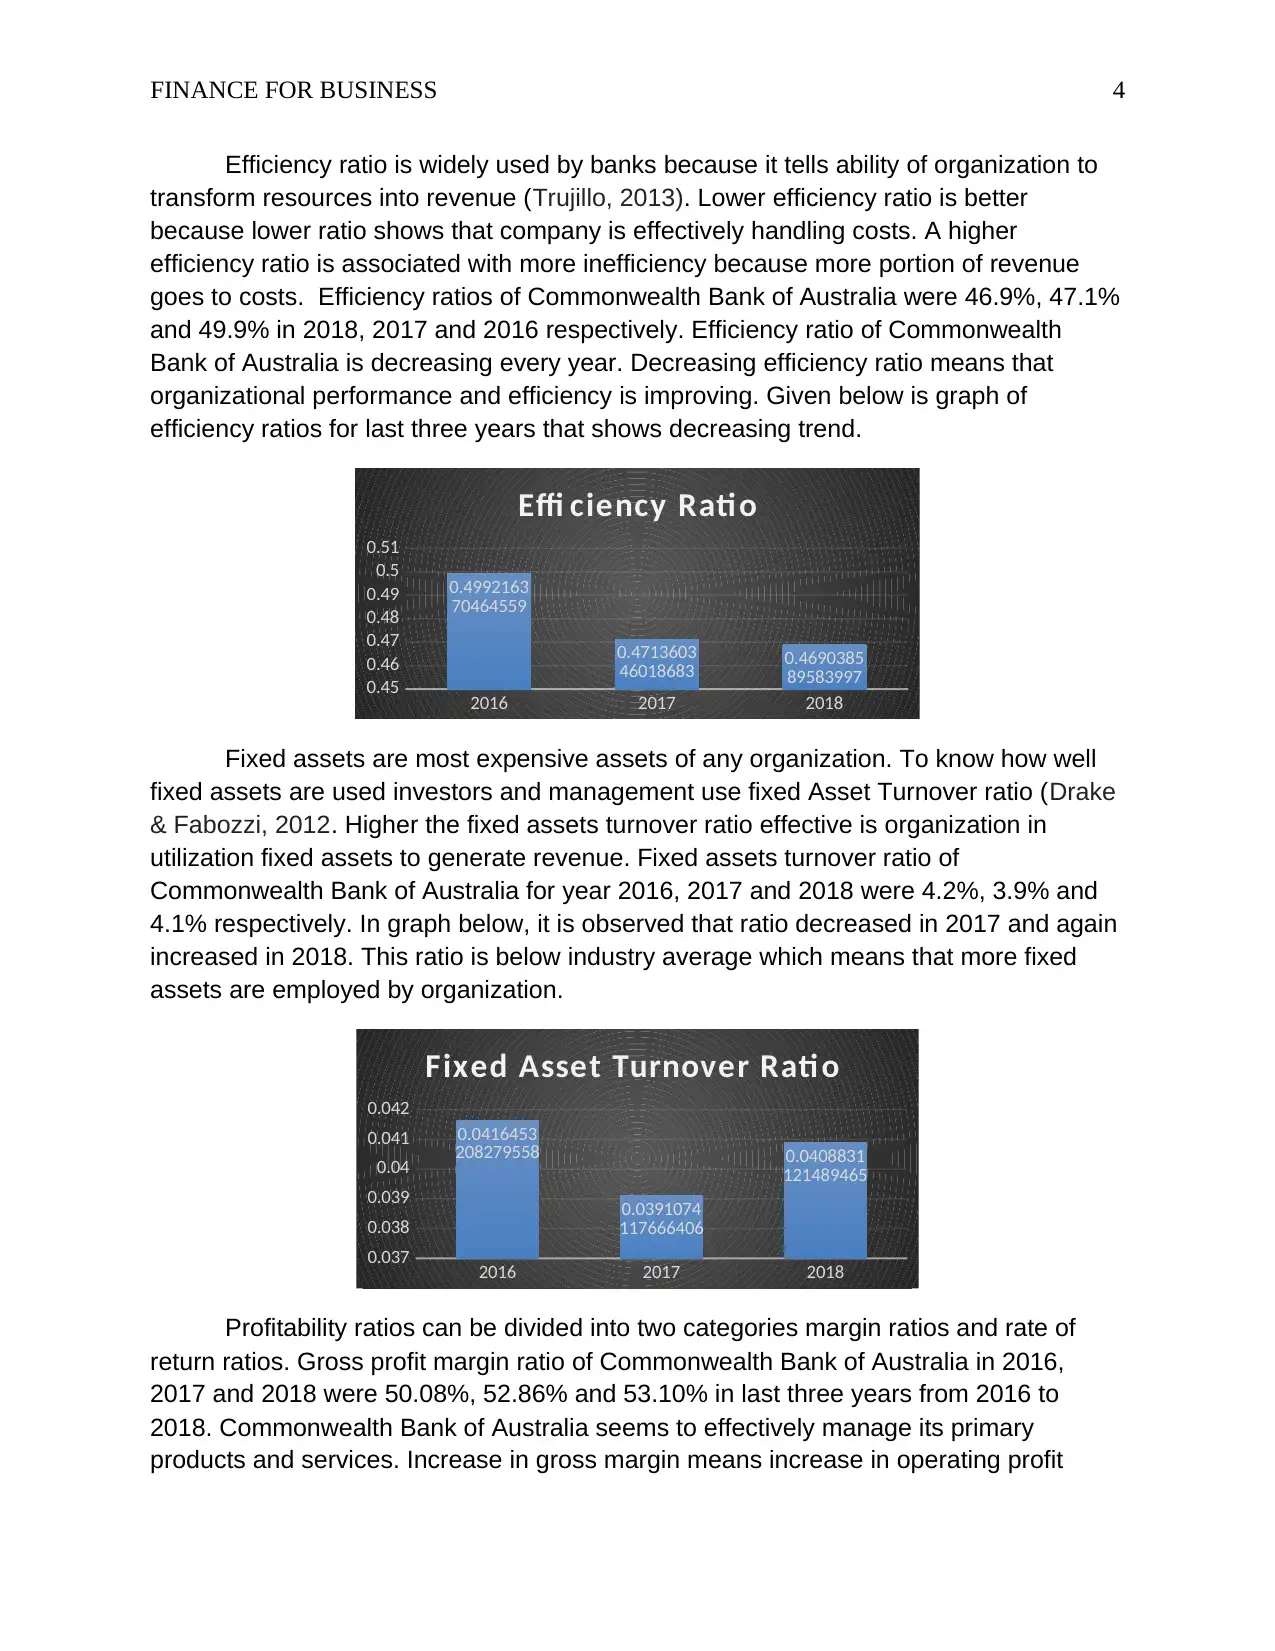
Fixed assets are most expensive assets of any organization. To know how well
fixed assets are used investors and management use fixed Asset Turnover ratio (Drake
& Fabozzi, 2012. Higher the fixed assets turnover ratio effective is organization in
utilization fixed assets to generate revenue. Fixed assets turnover ratio of
Commonwealth Bank of Australia for year 2016, 2017 and 2018 were 4.2%, 3.9% and
4.1% respectively. In graph below, it is observed that ratio decreased in 2017 and again
increased in 2018. This ratio is below industry average which means that more fixed
assets are employed by organization.
2016 2017 2018
0.037
0.038
0.039
0.04
0.041
0.042
0.0416453
208279558
0.0391074
117666406
0.0408831
121489465
Fixed Asset Turnover Rati o
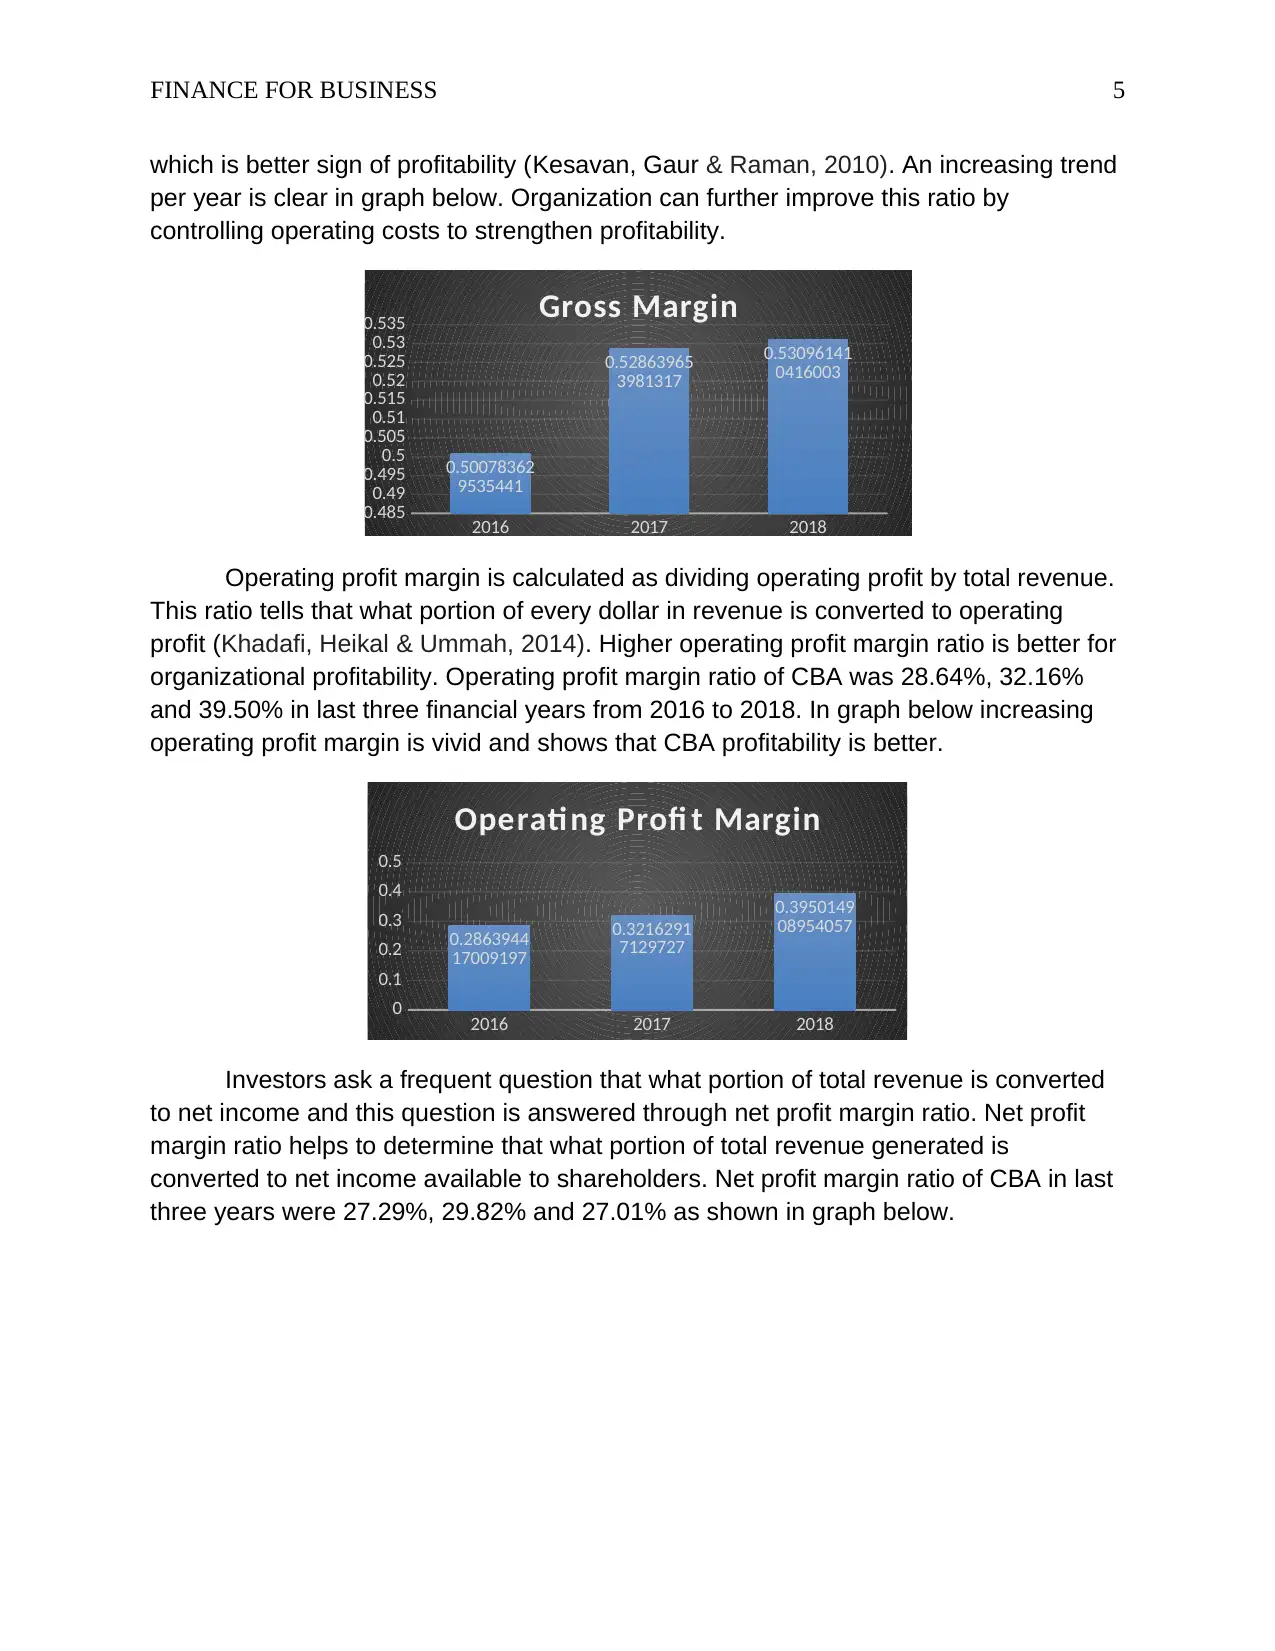
Profitability ratios can be divided into two categories margin ratios and rate of
return ratios. Gross profit margin ratio of Commonwealth Bank of Australia in 2016,
2017 and 2018 were 50.08%, 52.86% and 53.10% in last three years from 2016 to
2018. Commonwealth Bank of Australia seems to effectively manage its primary
products and services. Increase in gross margin means increase in operating profit
Efficiency ratio is widely used by banks because it tells ability of organization to
transform resources into revenue (Trujillo, 2013). Lower efficiency ratio is better
because lower ratio shows that company is effectively handling costs. A higher
efficiency ratio is associated with more inefficiency because more portion of revenue
goes to costs. Efficiency ratios of Commonwealth Bank of Australia were 46.9%, 47.1%
and 49.9% in 2018, 2017 and 2016 respectively. Efficiency ratio of Commonwealth
Bank of Australia is decreasing every year. Decreasing efficiency ratio means that
organizational performance and efficiency is improving. Given below is graph of
efficiency ratios for last three years that shows decreasing trend.
2016 2017 2018
0.45
0.46
0.47
0.48
0.49
0.5
0.51
0.4992163
70464559
0.4713603
46018683 0.4690385
89583997
Effi ciency Rati o
Fixed assets are most expensive assets of any organization. To know how well
fixed assets are used investors and management use fixed Asset Turnover ratio (Drake
& Fabozzi, 2012. Higher the fixed assets turnover ratio effective is organization in
utilization fixed assets to generate revenue. Fixed assets turnover ratio of
Commonwealth Bank of Australia for year 2016, 2017 and 2018 were 4.2%, 3.9% and
4.1% respectively. In graph below, it is observed that ratio decreased in 2017 and again
increased in 2018. This ratio is below industry average which means that more fixed
assets are employed by organization.
2016 2017 2018
0.037
0.038
0.039
0.04
0.041
0.042
0.0416453
208279558
0.0391074
117666406
0.0408831
121489465
Fixed Asset Turnover Rati o
Profitability ratios can be divided into two categories margin ratios and rate of
return ratios. Gross profit margin ratio of Commonwealth Bank of Australia in 2016,
2017 and 2018 were 50.08%, 52.86% and 53.10% in last three years from 2016 to
2018. Commonwealth Bank of Australia seems to effectively manage its primary
products and services. Increase in gross margin means increase in operating profit
Paraphrase This Document
Need a fresh take? Get an instant paraphrase of this document with our AI Paraphraser
FINANCE FOR BUSINESS 5
which is better sign of profitability (Kesavan, Gaur & Raman, 2010). An increasing trend
per year is clear in graph below. Organization can further improve this ratio by
controlling operating costs to strengthen profitability.
2016 2017 2018
0.485
0.49
0.495
0.5
0.505
0.51
0.515
0.52
0.525
0.53
0.535
0.50078362
9535441
0.52863965
3981317
0.53096141
0416003
Gross Margin
Operating profit margin is calculated as dividing operating profit by total revenue.
This ratio tells that what portion of every dollar in revenue is converted to operating
profit (Khadafi, Heikal & Ummah, 2014). Higher operating profit margin ratio is better for
organizational profitability. Operating profit margin ratio of CBA was 28.64%, 32.16%
and 39.50% in last three financial years from 2016 to 2018. In graph below increasing
operating profit margin is vivid and shows that CBA profitability is better.
2016 2017 2018
0
0.1
0.2
0.3
0.4
0.5
0.2863944
17009197
0.3216291
7129727
0.3950149
08954057
Operati ng Profi t Margin
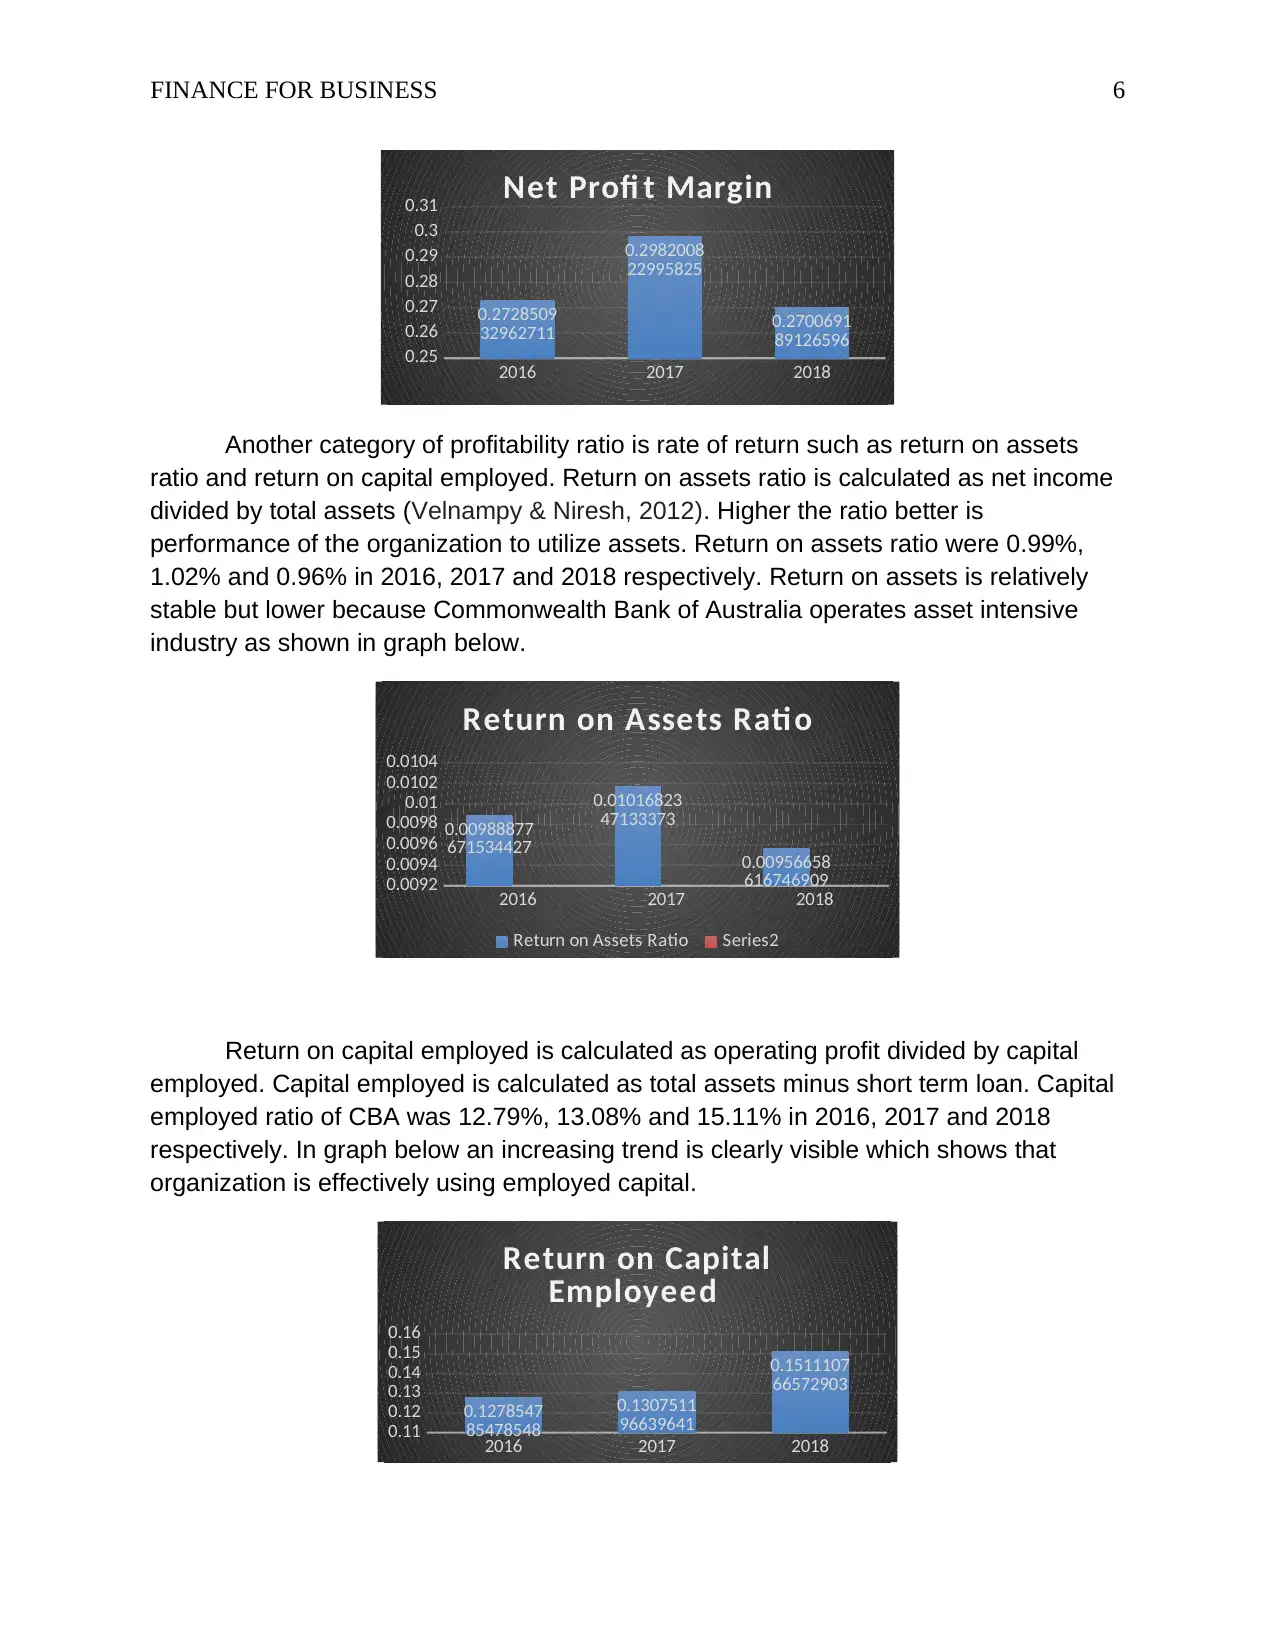
Investors ask a frequent question that what portion of total revenue is converted
to net income and this question is answered through net profit margin ratio. Net profit
margin ratio helps to determine that what portion of total revenue generated is
converted to net income available to shareholders. Net profit margin ratio of CBA in last
three years were 27.29%, 29.82% and 27.01% as shown in graph below.
which is better sign of profitability (Kesavan, Gaur & Raman, 2010). An increasing trend
per year is clear in graph below. Organization can further improve this ratio by
controlling operating costs to strengthen profitability.
2016 2017 2018
0.485
0.49
0.495
0.5
0.505
0.51
0.515
0.52
0.525
0.53
0.535
0.50078362
9535441
0.52863965
3981317
0.53096141
0416003
Gross Margin
Operating profit margin is calculated as dividing operating profit by total revenue.
This ratio tells that what portion of every dollar in revenue is converted to operating
profit (Khadafi, Heikal & Ummah, 2014). Higher operating profit margin ratio is better for
organizational profitability. Operating profit margin ratio of CBA was 28.64%, 32.16%
and 39.50% in last three financial years from 2016 to 2018. In graph below increasing
operating profit margin is vivid and shows that CBA profitability is better.
2016 2017 2018
0
0.1
0.2
0.3
0.4
0.5
0.2863944
17009197
0.3216291
7129727
0.3950149
08954057
Operati ng Profi t Margin
Investors ask a frequent question that what portion of total revenue is converted
to net income and this question is answered through net profit margin ratio. Net profit
margin ratio helps to determine that what portion of total revenue generated is
converted to net income available to shareholders. Net profit margin ratio of CBA in last
three years were 27.29%, 29.82% and 27.01% as shown in graph below.
FINANCE FOR BUSINESS 6
2016 2017 2018
0.25
0.26
0.27
0.28
0.29
0.3
0.31
0.2728509
32962711
0.2982008
22995825
0.2700691
89126596
Net Profi t Margin
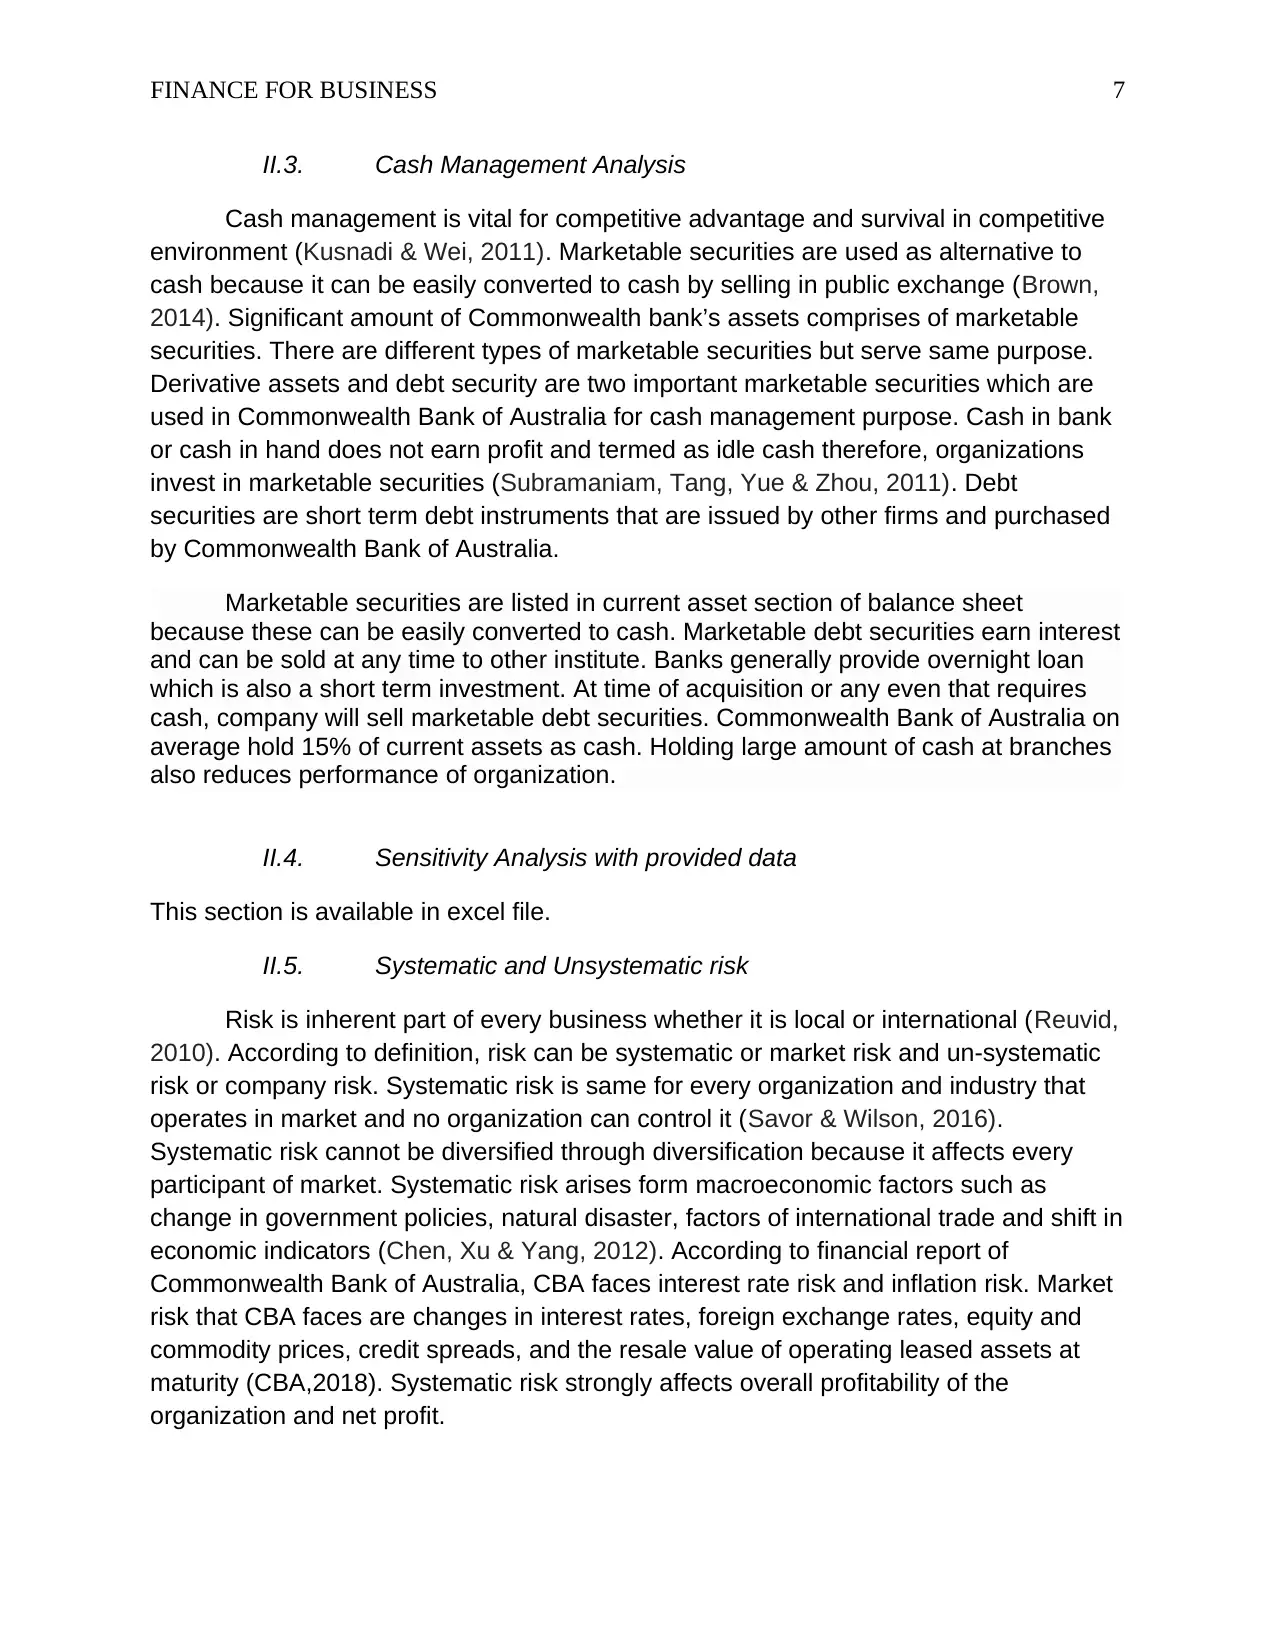
Another category of profitability ratio is rate of return such as return on assets
ratio and return on capital employed. Return on assets ratio is calculated as net income
divided by total assets (Velnampy & Niresh, 2012). Higher the ratio better is
performance of the organization to utilize assets. Return on assets ratio were 0.99%,
1.02% and 0.96% in 2016, 2017 and 2018 respectively. Return on assets is relatively
stable but lower because Commonwealth Bank of Australia operates asset intensive
industry as shown in graph below.
2016 2017 2018
0.0092
0.0094
0.0096
0.0098
0.01
0.0102
0.0104
0.00988877
671534427
0.01016823
47133373
0.00956658
616746909
Return on Assets Rati o
Return on Assets Ratio Series2
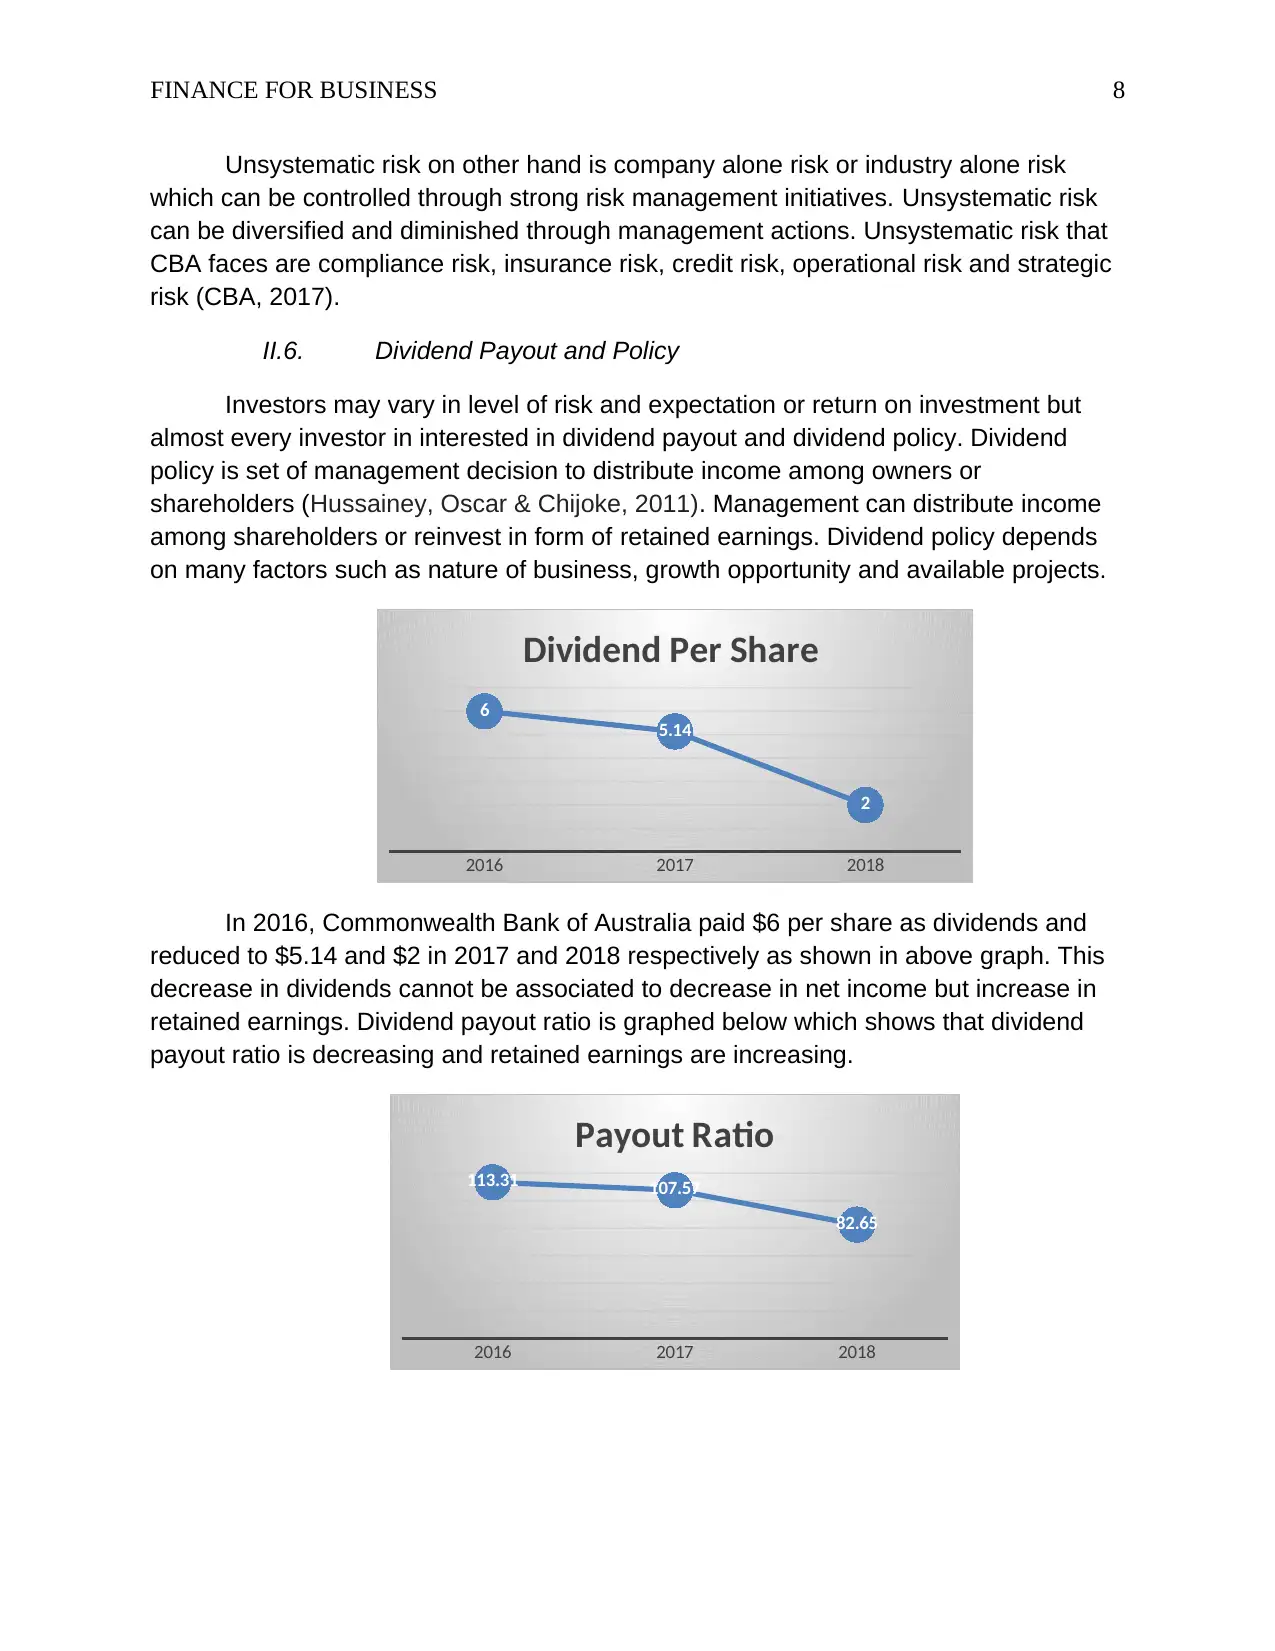
Return on capital employed is calculated as operating profit divided by capital
employed. Capital employed is calculated as total assets minus short term loan. Capital
employed ratio of CBA was 12.79%, 13.08% and 15.11% in 2016, 2017 and 2018
respectively. In graph below an increasing trend is clearly visible which shows that
organization is effectively using employed capital.
2016 2017 2018
0.11
0.12
0.13
0.14
0.15
0.16
0.1278547
85478548
0.1307511
96639641
0.1511107
66572903
Return on Capital
Employeed
2016 2017 2018
0.25
0.26
0.27
0.28
0.29
0.3
0.31
0.2728509
32962711
0.2982008
22995825
0.2700691
89126596
Net Profi t Margin
Another category of profitability ratio is rate of return such as return on assets
ratio and return on capital employed. Return on assets ratio is calculated as net income
divided by total assets (Velnampy & Niresh, 2012). Higher the ratio better is
performance of the organization to utilize assets. Return on assets ratio were 0.99%,
1.02% and 0.96% in 2016, 2017 and 2018 respectively. Return on assets is relatively
stable but lower because Commonwealth Bank of Australia operates asset intensive
industry as shown in graph below.
2016 2017 2018
0.0092
0.0094
0.0096
0.0098
0.01
0.0102
0.0104
0.00988877
671534427
0.01016823
47133373
0.00956658
616746909
Return on Assets Rati o
Return on Assets Ratio Series2
Return on capital employed is calculated as operating profit divided by capital
employed. Capital employed is calculated as total assets minus short term loan. Capital
employed ratio of CBA was 12.79%, 13.08% and 15.11% in 2016, 2017 and 2018
respectively. In graph below an increasing trend is clearly visible which shows that
organization is effectively using employed capital.
2016 2017 2018
0.11
0.12
0.13
0.14
0.15
0.16
0.1278547
85478548
0.1307511
96639641
0.1511107
66572903
Return on Capital
Employeed
⊘ This is a preview!⊘
Do you want full access?
Subscribe today to unlock all pages.
Trusted by 1+ million students worldwide
FINANCE FOR BUSINESS 7
II.3. Cash Management Analysis
Cash management is vital for competitive advantage and survival in competitive
environment (Kusnadi & Wei, 2011). Marketable securities are used as alternative to
cash because it can be easily converted to cash by selling in public exchange (Brown,
2014). Significant amount of Commonwealth bank’s assets comprises of marketable
securities. There are different types of marketable securities but serve same purpose.
Derivative assets and debt security are two important marketable securities which are
used in Commonwealth Bank of Australia for cash management purpose. Cash in bank
or cash in hand does not earn profit and termed as idle cash therefore, organizations
invest in marketable securities (Subramaniam, Tang, Yue & Zhou, 2011). Debt
securities are short term debt instruments that are issued by other firms and purchased
by Commonwealth Bank of Australia.
Marketable securities are listed in current asset section of balance sheet
because these can be easily converted to cash. Marketable debt securities earn interest
and can be sold at any time to other institute. Banks generally provide overnight loan
which is also a short term investment. At time of acquisition or any even that requires
cash, company will sell marketable debt securities. Commonwealth Bank of Australia on
average hold 15% of current assets as cash. Holding large amount of cash at branches
also reduces performance of organization.
II.4. Sensitivity Analysis with provided data
This section is available in excel file.
II.5. Systematic and Unsystematic risk
Risk is inherent part of every business whether it is local or international (Reuvid,
2010). According to definition, risk can be systematic or market risk and un-systematic
risk or company risk. Systematic risk is same for every organization and industry that
operates in market and no organization can control it (Savor & Wilson, 2016).
Systematic risk cannot be diversified through diversification because it affects every
participant of market. Systematic risk arises form macroeconomic factors such as
change in government policies, natural disaster, factors of international trade and shift in
economic indicators (Chen, Xu & Yang, 2012). According to financial report of
Commonwealth Bank of Australia, CBA faces interest rate risk and inflation risk. Market
risk that CBA faces are changes in interest rates, foreign exchange rates, equity and
commodity prices, credit spreads, and the resale value of operating leased assets at
maturity (CBA,2018). Systematic risk strongly affects overall profitability of the
organization and net profit.
Paraphrase This Document
Need a fresh take? Get an instant paraphrase of this document with our AI Paraphraser
FINANCE FOR BUSINESS 8
Unsystematic risk on other hand is company alone risk or industry alone risk
which can be controlled through strong risk management initiatives. Unsystematic risk
can be diversified and diminished through management actions. Unsystematic risk that
CBA faces are compliance risk, insurance risk, credit risk, operational risk and strategic
risk (CBA, 2017).
II.6. Dividend Payout and Policy
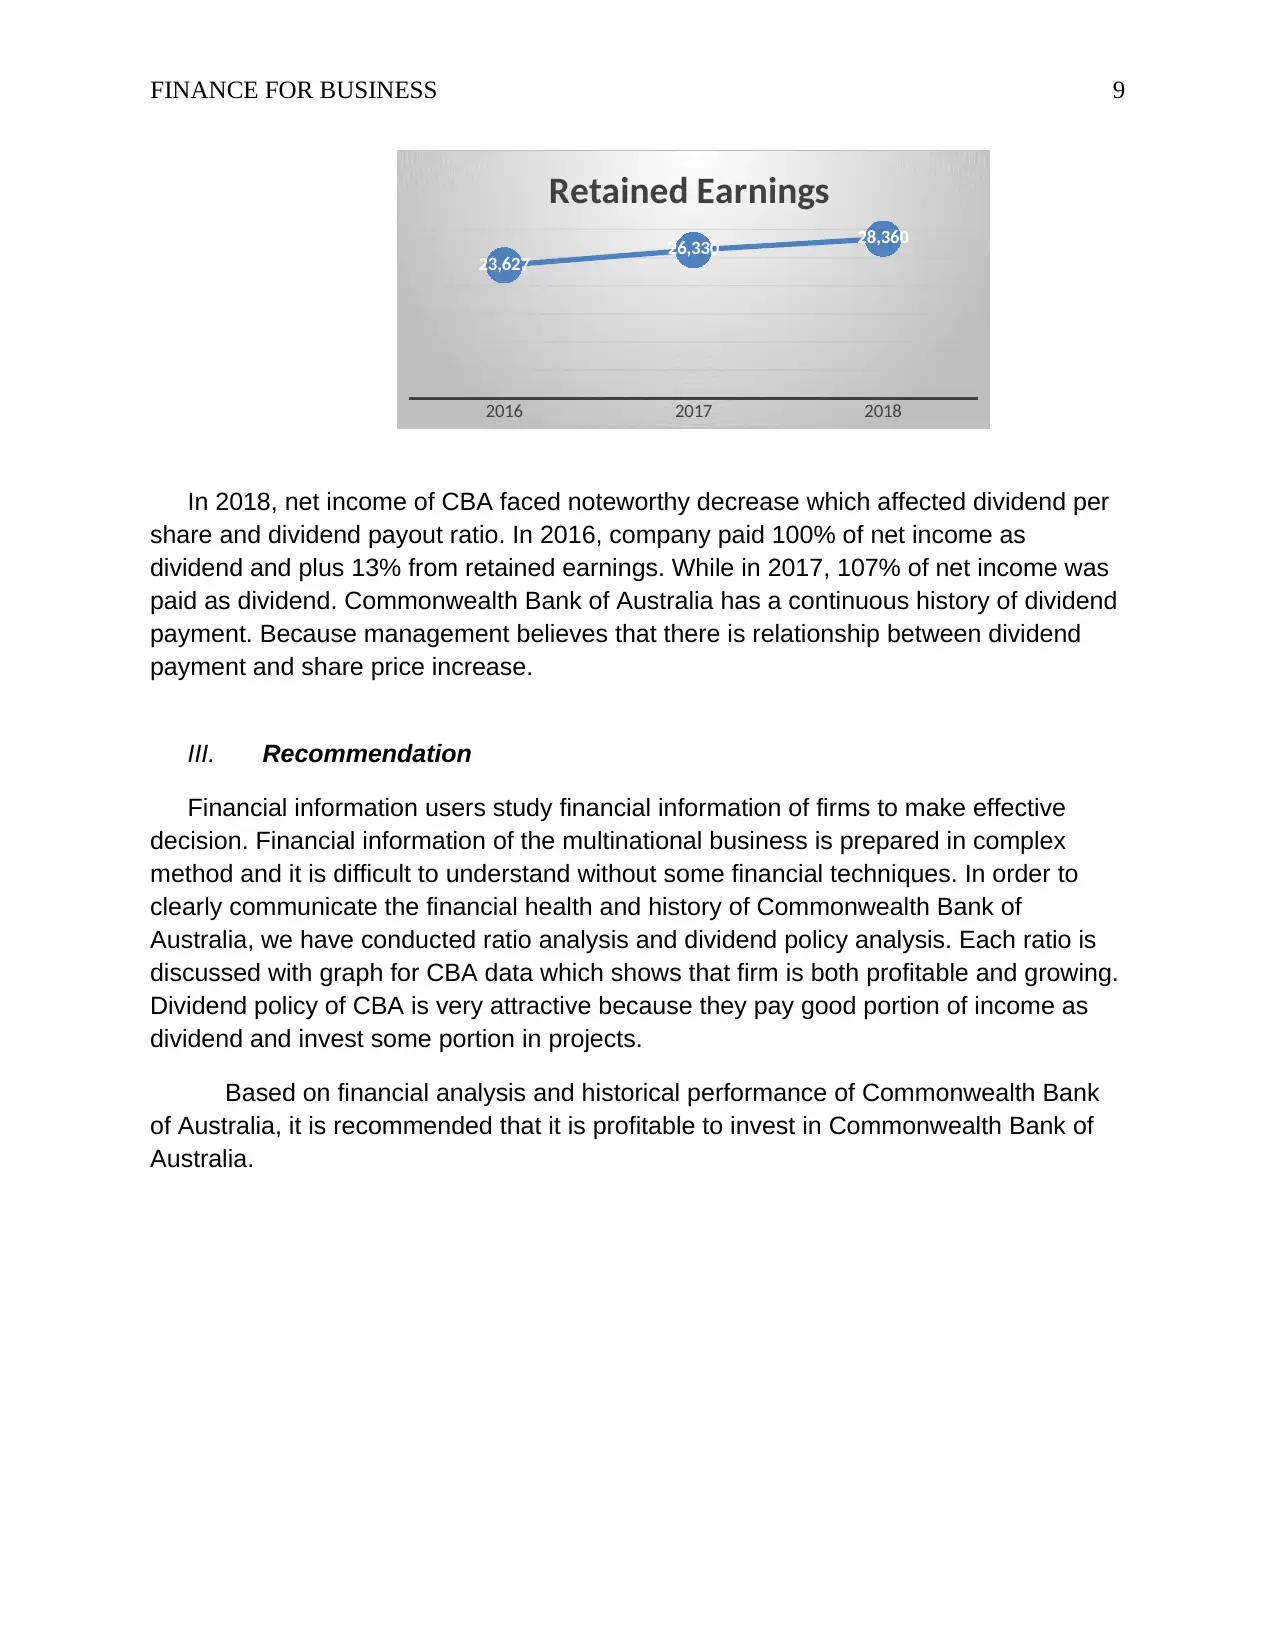
Investors may vary in level of risk and expectation or return on investment but
almost every investor in interested in dividend payout and dividend policy. Dividend
policy is set of management decision to distribute income among owners or
shareholders (Hussainey, Oscar & Chijoke, 2011). Management can distribute income
among shareholders or reinvest in form of retained earnings. Dividend policy depends
on many factors such as nature of business, growth opportunity and available projects.
2016 2017 2018
6
5.14
2
Dividend Per Share
In 2016, Commonwealth Bank of Australia paid $6 per share as dividends and
reduced to $5.14 and $2 in 2017 and 2018 respectively as shown in above graph. This
decrease in dividends cannot be associated to decrease in net income but increase in
retained earnings. Dividend payout ratio is graphed below which shows that dividend
payout ratio is decreasing and retained earnings are increasing.
2016 2017 2018
113.31 107.57
82.65
Payout Ratio
Unsystematic risk on other hand is company alone risk or industry alone risk
which can be controlled through strong risk management initiatives. Unsystematic risk
can be diversified and diminished through management actions. Unsystematic risk that
CBA faces are compliance risk, insurance risk, credit risk, operational risk and strategic
risk (CBA, 2017).
II.6. Dividend Payout and Policy
Investors may vary in level of risk and expectation or return on investment but
almost every investor in interested in dividend payout and dividend policy. Dividend
policy is set of management decision to distribute income among owners or
shareholders (Hussainey, Oscar & Chijoke, 2011). Management can distribute income
among shareholders or reinvest in form of retained earnings. Dividend policy depends
on many factors such as nature of business, growth opportunity and available projects.
2016 2017 2018
6
5.14
2
Dividend Per Share
In 2016, Commonwealth Bank of Australia paid $6 per share as dividends and
reduced to $5.14 and $2 in 2017 and 2018 respectively as shown in above graph. This
decrease in dividends cannot be associated to decrease in net income but increase in
retained earnings. Dividend payout ratio is graphed below which shows that dividend
payout ratio is decreasing and retained earnings are increasing.
2016 2017 2018
113.31 107.57
82.65
Payout Ratio
FINANCE FOR BUSINESS 9
2016 2017 2018
23,627 26,330 28,360
Retained Earnings
In 2018, net income of CBA faced noteworthy decrease which affected dividend per
share and dividend payout ratio. In 2016, company paid 100% of net income as
dividend and plus 13% from retained earnings. While in 2017, 107% of net income was
paid as dividend. Commonwealth Bank of Australia has a continuous history of dividend
payment. Because management believes that there is relationship between dividend
payment and share price increase.
III. Recommendation
Financial information users study financial information of firms to make effective
decision. Financial information of the multinational business is prepared in complex
method and it is difficult to understand without some financial techniques. In order to
clearly communicate the financial health and history of Commonwealth Bank of
Australia, we have conducted ratio analysis and dividend policy analysis. Each ratio is
discussed with graph for CBA data which shows that firm is both profitable and growing.
Dividend policy of CBA is very attractive because they pay good portion of income as
dividend and invest some portion in projects.
Based on financial analysis and historical performance of Commonwealth Bank
of Australia, it is recommended that it is profitable to invest in Commonwealth Bank of
Australia.
⊘ This is a preview!⊘
Do you want full access?
Subscribe today to unlock all pages.
Trusted by 1+ million students worldwide
FINANCE FOR BUSINESS 10
References
Babalola, Y.A. and Abiola, F.R., 2013. Financial ratio analysis of firms: A tool for
decision making. International journal of management sciences, 1(4), pp.132-137.
http://www.academia.edu/download/32371001/Paper_4.pdf
Brown, C., 2014. Marketable securities: Storage or investment?. Available at SSRN
1446683. http://citeseerx.ist.psu.edu/viewdoc/download?
doi=10.1.1.710.116&rep=rep1&type=pdf
Brown, R., 2012. Analysis of investments & management of portfolios.
http://dspace.lzuu.lt/bitstream/1/1911/1/Analysis%20of%20investments
%20%26%20management%20of%20portfolios.pdf
CBA., 2017. Annual Report 2017. From the Official website of Commonwealth Bank of
Australia.
https://www.commbank.com.au/content/dam/commbank/about-us/shareholders/pdfs/
annual-reports/annual_report_2017_14_aug_2017.pdf
CBA., 2018. Annual Report 2018. From the Official website of Commonwealth Bank of
Australia.
https://www.commbank.com.au/content/dam/commbank/about-us/shareholders/pdfs/
results/fy18/cba-annual-report-2018.pdf
Chen, H., Xu, Y. and Yang, J., 2012. Systematic risk, debt maturity, and the term
structure of credit spreads (No. w18367). National Bureau of Economic Research.
https://www.nber.org/papers/w18367.pdf
Drake, P.P. and Fabozzi, F.J., 2012. Financial ratio analysis. Encyclopedia of Financial
Models. https://onlinelibrary.wiley.com/doi/abs/10.1002/9781118182635.efm0074
Hussainey, K., Oscar Mgbame, C. and Chijoke-Mgbame, A.M., 2011. Dividend policy
and share price volatility: UK evidence. The Journal of risk finance, 12(1), pp.57-68.
http://alqashi.com/wp/wp-content/uploads/2012/02/Dividend-policy-and-share-price-
volatility.pdf
Kesavan, S., Gaur, V. and Raman, A., 2010. Do inventory and gross margin data
improve sales forecasts for US public retailers?. Management Science, 56(9), pp.1519-
1533.
https://www.researchgate.net/profile/Vishal_Gaur/publication/220534775_Do_Inventory
_and_Gross_Margin_Data_Improve_Sales_Forecasts_for_US_Public_Retailers/links/
02e7e5319cace87fa1000000.pdf
Paraphrase This Document
Need a fresh take? Get an instant paraphrase of this document with our AI Paraphraser
FINANCE FOR BUSINESS 11
Khadafi, M., Heikal, M. and Ummah, A., 2014. Influence analysis of return on assets
(ROA), return on equity (ROE), net profit margin (NPM), debt to equity ratio (DER), and
current ratio (CR), against corporate profit growth in automotive in Indonesia Stock
Exchange. International Journal of Academic Research in Business and Social
Sciences, 4(12). http://repository.unimal.ac.id/1351/1/Financial%20Performance.pdf
Kusnadi, Y. and Wei, K.J., 2011. The determinants of corporate cash management
policies: Evidence from around the world. Journal of Corporate Finance, 17(3), pp.725-
740.
https://pdfs.semanticscholar.org/49c4/15b9f64f718c30d00a77e2bacada5457a907.pdf
Lin, F., Liang, D. and Chen, E., 2011. Financial ratio selection for business crisis
prediction. Expert Systems with Applications, 38(12), pp.15094-15102.
https://isslab.csie.ncu.edu.tw/download/publications/10.pdf
Morningstar., 2019. CBA. Official website of Morning star.
https://www.morningstar.com/stocks/pinx/cbauf/quote.html
Odunga, R.M., Nyangweso, P.M., Carter, D.A. and Mwarumba, M., 2013. Credit
Risk,“Capital Adequacy and Operating Efficiency Of Commercial Banks in
Kenya”. International Journal of Business and Management Invention, 2(9), pp.6-12.
http://www.academia.edu/download/32103916/B029206012.pdf
Petria, N., Capraru, B. and Ihnatov, I., 2015. Determinants of banks’ profitability:
Evidence from EU 27 banking systems. Procedia Economics and Finance, 20, pp.518-
524. https://www.sciencedirect.com/science/article/pii/S2212567115001045/pdf?
md5=ad2a66b817cabd599251ca3369aa53ca&pid=1-s2.0-S2212567115001045-
main.pdf&_valck=1
Reuvid, J., 2010. Managing business risk: a practical guide to protecting your business.
Kogan Page Publishers. https://books.google.com./books?
hl=en&lr=&id=4aNO5PmbEtEC&oi=fnd&pg=PR16&dq=business+risk+&ots=sRsc3RxH
Lx&sig=N8gAN4yHV55GWPvfDQeIiqCFNYI#v=onepage&q=business%20risk&f=false
Savor, P. and Wilson, M., 2016. Earnings announcements and systematic risk. The
Journal of Finance, 71(1), pp.83-138.
https://pdfs.semanticscholar.org/4b37/e1bedd4b6d06b00c3cd28b9c00ce29a86bff.pdf
Subramaniam, V., Tang, T.T., Yue, H. and Zhou, X., 2011. Firm structure and corporate
cash holdings. Journal of Corporate Finance, 17(3), pp.759-773.
https://ink.library.smu.edu.sg/cgi/viewcontent.cgi?referer=https://scholar.google.com/
&httpsredir=1&article=2611&context=soa_research
FINANCE FOR BUSINESS 12
Trujillo‐Ponce, A., 2013. What determines the profitability of banks? Evidence from
Spain. Accounting & Finance, 53(2), pp.561-586.
https://pdfs.semanticscholar.org/2023/cecbaac61b6edff5c905dc85531f0995ff47.pdf
Velnampy, T. and Niresh, J.A., 2012. The relationship between capital structure and
profitability. Global Journal of Management and Business Research, 12(13).
https://journalofbusiness.org/index.php/GJMBR/article/view/766
Yahoo Finance., 2019. CBA Company Profile. Official website of Commonwealth Bank
of Australia. https://finance.yahoo.com/quote/CBA.AX/profile?p=CBA.AX
⊘ This is a preview!⊘
Do you want full access?
Subscribe today to unlock all pages.
Trusted by 1+ million students worldwide
1 out of 12
Related Documents


Your All-in-One AI-Powered Toolkit for Academic Success.
+13062052269
info@desklib.com
Available 24*7 on WhatsApp / Email
![[object Object]](/_next/static/media/star-bottom.7253800d.svg)
Unlock your academic potential
Copyright © 2020–2026 A2Z Services. All Rights Reserved. Developed and managed by ZUCOL.