Financial Management Report: CBA's Five-Year Financial Analysis
VerifiedAdded on 2019/09/30
|26
|5355
|590
Report
AI Summary
This report presents a comprehensive financial analysis of the Commonwealth Bank (CBA) over a five-year period. It begins with a qualitative analysis, providing background information on the company and its stock movements. The report then delves into a quantitative analysis, examining key financial trends and calculating and interpreting various ratios, including liquidity, profitability, capital structure, and market value ratios. These ratios are benchmarked against industry averages to assess CBA's performance. Furthermore, the report includes a stock valuation exercise using the Constant Dividend Growth Rate model. Based on the combined qualitative and quantitative analysis, the report concludes with a recommendation on whether to invest in the company, acknowledging any limitations within the analysis.
Student name: Kate Bickford
Subject name: Financial management (FMGT)
Word count: 2750
Title: Financial analyses of the Commonwealth Bank over a
five year period.
Background:
Financial literacy helps you to become a better manager. Understanding the financial
side of the business will make you more effective on the job and will make your work
life more meaningful. The two core activities of financial management are to manage
profitability and manage liquidity. If either of these two activities is neglected it can
lead to the demise of an organisation. Hence, these two aspects guide the decision
making for any manager. Issuing bonds (debt) and/or issuing stocks (shares),
enables the corporation to manage the money it needs to finance the assets of the
business. Therefore, being able to value these financial securities is also an
important skill to have.
Requirement:
Your task is to analyse the historical (for the last five years) performance of a listed
company and present your findings in the form of a report, which will cover both
qualitative and quantitative performance elements in a logical cohesive format.
Please note: If you are working for a company listed on the stock exchange, use this
opportunity to complete the exercise on that company. Otherwise, feel free to value a
competitor or a company that interests you. However, note that the company you
select must be listed on a stock exchange and have a history of paying dividends.
The qualitative component of your discussion should include brief background
information on the company including how they are placed within the industry, and a
brief overview of the recent stock price movements for the company. The
quantitative component should include an initial analysis of trends in the major items
1
Paraphrase This Document
Need a fresh take? Get an instant paraphrase of this document with our AI Paraphraser
contained in the profit and loss statements and balance sheets, followed by an
analysis of the following important ratios measuring liquidity, profitability, capital
structure and market-value aspects of the company performance:
o Liquidity: Current ratio
o Profitability: Net profit margin ratio and Return on total assets
o Capital structure: Debt ratio and Interest cover ratio
o Market value: Price-earning (P/E) ratio.
Your analysis should highlight the important changes within these ratios over this
period and identify the reasons for significant changes. Since these financial ratios
are limited to the particular organisation, it is also useful to compare these ratios to
other businesses in the same industry or by using industry averages.
You are also required to calculate the value of a stock (share) of the listed company
selected above, using the Constant Dividend Growth Rate model. Go to your
relevant stock exchange site (e.g. www.asx.com.au if using an Australian listed
company) and find the latest share price. Assume the company chosen above has a
4% dividend growth rate and the required rate of return is 9%. Compare that stock
value with the current stock market price. Are there any differences? You are
required to explain these differences.
Analyse and interpret the ratios and the other data with reference to the theoretical
concepts introduced in this subject to evaluate the company’s operations and
performance. Discuss limitations if any. Taking into account the quantitative and
qualitative analysis, you are then required to make a recommendation on whether to:
5. Invest in the company
6. Do not invest in the company.
2
Executive Summary
This paper analyses the financial performance of one of Australia big four banks; the
Commonwealth Bank over a period of five years. The commonwealth Bank is one of
Australia’s leading financial institutions offering general banking and business
banking needs as well as many other services such as insurance and
superannuation and has been in operation since 1911. During the five year period
the Commonwealth Bank has seen steady revenue growth and is operating on par or
above expected industry averages. The CBA services over 800,000 shareholders.
This paper will look at the performance to date of the firm over the five year period;
demonstrating that the firm has proven management strategies, a solid share
dividend history and are adaptable to economic and fiscal changes. The report firstly
looks at the qualitative analyse through an overview of the firm and historical stock
movements. The paper with then look at the quantitative component through
analyses of liquidity, profitability, capital structure and market value ratios and
benchmarking to show business and profit trends in the industry. These ratios will
demonstrate strong performance of the firm. The paper will use the constant
dividend growth rate model to look at the value of the share. And in conclusion the
paper will look at some recommendations for investors.
Please acknowledge limitations of analyses within the restricted word count limit.
3
⊘ This is a preview!⊘
Do you want full access?
Subscribe today to unlock all pages.
Trusted by 1+ million students worldwide
Table of Contents
1. Introduction............................................................................................................. 6
2. Qualitative Analysis................................................................................................6
3. Company Overview.................................................................................................6
4. Stock Movements....................................................................................................7
Table 1: Average CBA share price..........................................................................8
Table 2: The big four banks stock price over the past three months.......................9
5. Quantitative Analysis...............................................................................................9
6. Ratios.................................................................................................................... 10
6.1 Liquidity: Current Ratio.................................................................................... 10
Table 3: Current ratio: CBA....................................................................................11
6.2 Profitability: Net profit Margin ratio...................................................................11
Table 4: Net profit margin ratio for CBA.................................................................11
Table 5: Net profit margin; CBA vs NAB................................................................12
6.3 Profitability: Return on total assets..................................................................12
Table 6: Return on Assets for CBA........................................................................12
6.4 Capital Structure: Debt and interest ratio.........................................................12
Table 7: Debt ratio CBA vs NAB............................................................................13
Table 8: Interest ratio CBA.....................................................................................13
6.5 Market value: Price Earnings ratio (P/E Ratio).................................................13
Table 9: PE ratio for CBA and WBC......................................................................14
7. Stock valuation......................................................................................................14
Table 10: Growth rate of CBA shares over 5years................................................15
8. Conclusion............................................................................................................ 15
Table 11: The Big Four onwards and upwards......................................................16
9. Recommendations................................................................................................ 16
References................................................................................................................18
4
Paraphrase This Document
Need a fresh take? Get an instant paraphrase of this document with our AI Paraphraser
Appendix 1: CBA 2011 - 2015...................................................................................19
Appendix 2: CBA Growth and ratios 2011 – 2015.....................................................22
Appendix 3: CBA industry average...........................................................................24
Appendix 4: CBA historical current ratio (Quarterly data).........................................25
5
1. Introduction
By analysing the qualitative and quantitative aspects of a business’s past
performance investors can be guided in making decisions on how a firm performs
overall and how profitable and risky the investment may be.
This paper will look at the financial performance of the Commonwealth Bank (CBA) a
public listed company listed on the ASX in 1991. This paper will look at the last five
years of performance for the firm and conduct analyse of the firm’s overall
performance.
The paper will look at the qualitative component firstly through the firm’s background
and historical stock price to see how the firm performs in the market place.
The paper will then look at quantitative measures of the CBA by analysing financial
trends and ratio on liquidity, profitability, capital structure and market value whilst
benchmarking this analysis against the firm’s performance over the five years.
The paper will additionally look at a stock valuation exercise using the share
valuation dividend discount model and in conclusion will summarise the analyses of
the firm and recommendation as to if the CBA is a sound investment.
Firms need to take in to account the five basic principles of finance; money has a
time value, there is a risk-return trade-off, cash flows are the source of value, market
prices and individual response to incentives, the analyses will tie to some of these
key principles.
2. Qualitative Analysis
Qualitative analysis looks at things that cannot be measured from the financial
statements of a firm but more relate to the management quality, corporate
governance and environmental factors affecting the business.
3. Company Overview
The Commonwealth Banks is one of Australia’s big four banks, the bank has
serviced personal and business customers for general banking and business
6
⊘ This is a preview!⊘
Do you want full access?
Subscribe today to unlock all pages.
Trusted by 1+ million students worldwide
banking needs and also offers a varied level of other financial services such as
financial planning, home loans and insurance to name a few.
The CBA has 800,000 shareholders and employs over 52,000 employees across
Australia and has seen steady profits and growth in its time.
The CBA is governed by a board of directors specialising in banking, finance and
business, the board has seen the company continue to be one of the most profitable
banks in Australia with annual revenue of $45,310,000 in the 2015 financial year.
(See appendix 1)
CBA shares are more commonly known as “blue chip stock” and sit in the ASX top
blue chip stocks in Australia. They are therefore relatively financially sound and seen
as a cornerstone investment for financial portfolios.
From analyses of the financial and balance statements we can ascertain that the
company holds a diverse portfolio of services and products and the company is
consistently delivering profits. The stock prices has been dropping slightly over the
last twelve months, this can be mainly put down to economical factors such and the
high oil price, high Australian dollar and interest rates being at an all time low, the
firm has also had to deal with the challenges of the GFC from an international scale.
Furthermore as the stock price fell Chief executive Ian Narev said the results showed
Australia's economy had maintained its steady "transition" in the second half of the
calendar year as it adjusts to falling mining investment. (Yeates 2016) banks are
subject to big fluctuations in the market dependent upon various factors; however the
bank can mitigate this fiscal risk by being adaptable and adjusting rates of interest on
borrowing products in line with the business and inflation to allow the firm to continue
to be profitable.
4. Stock Movements
The stock price as of close of business 8th of April, 2016 is trading at $70.76 (ASX
2016) the stock was trading at over $84.00 a share in December 2015 showing that
the stock fluctuates up and down regularly dependant on the current fiscal market.
The stock has risen from a rate of $52.01 as of 30th of June 2011 providing a 36%
increase in five years.
7
Paraphrase This Document
Need a fresh take? Get an instant paraphrase of this document with our AI Paraphraser
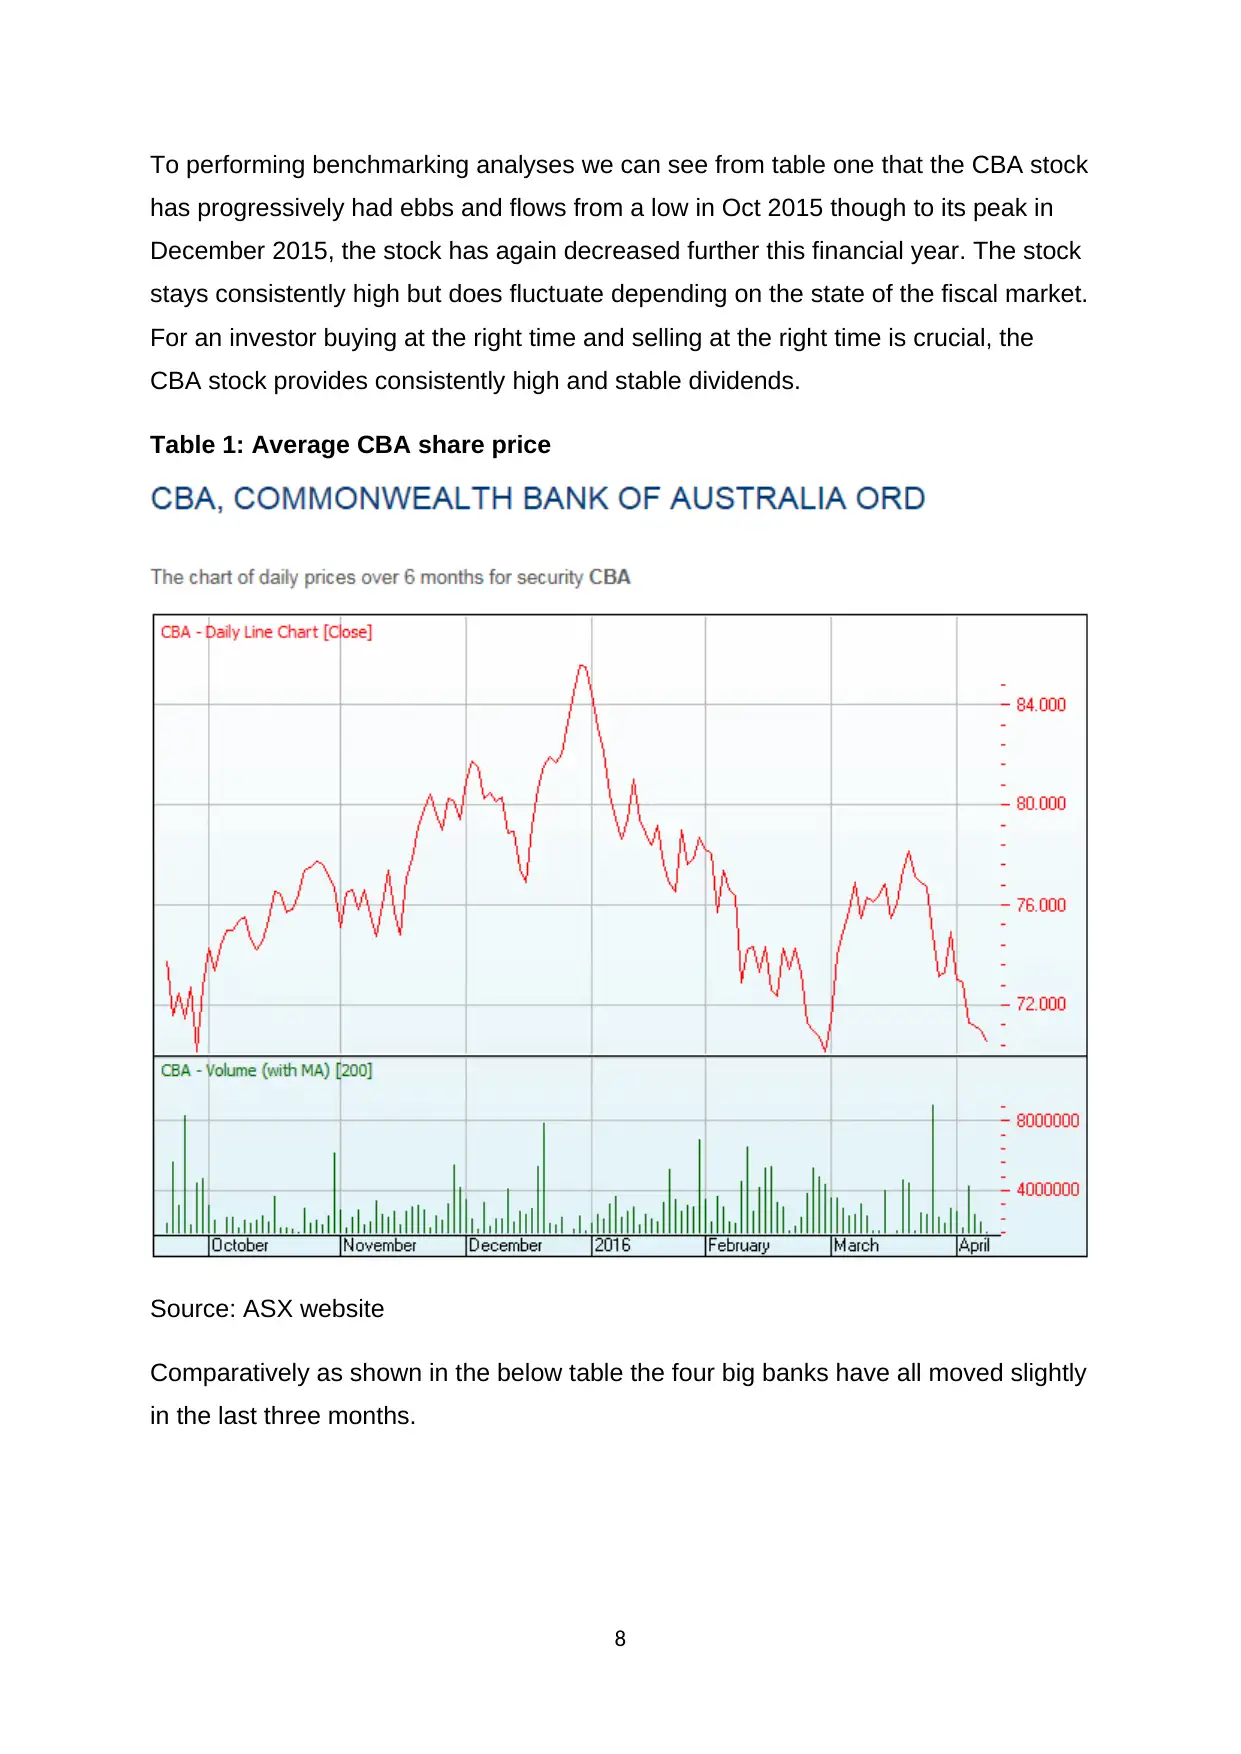
To performing benchmarking analyses we can see from table one that the CBA stock
has progressively had ebbs and flows from a low in Oct 2015 though to its peak in
December 2015, the stock has again decreased further this financial year. The stock
stays consistently high but does fluctuate depending on the state of the fiscal market.
For an investor buying at the right time and selling at the right time is crucial, the
CBA stock provides consistently high and stable dividends.
Table 1: Average CBA share price
Source: ASX website
Comparatively as shown in the below table the four big banks have all moved slightly
in the last three months.
8
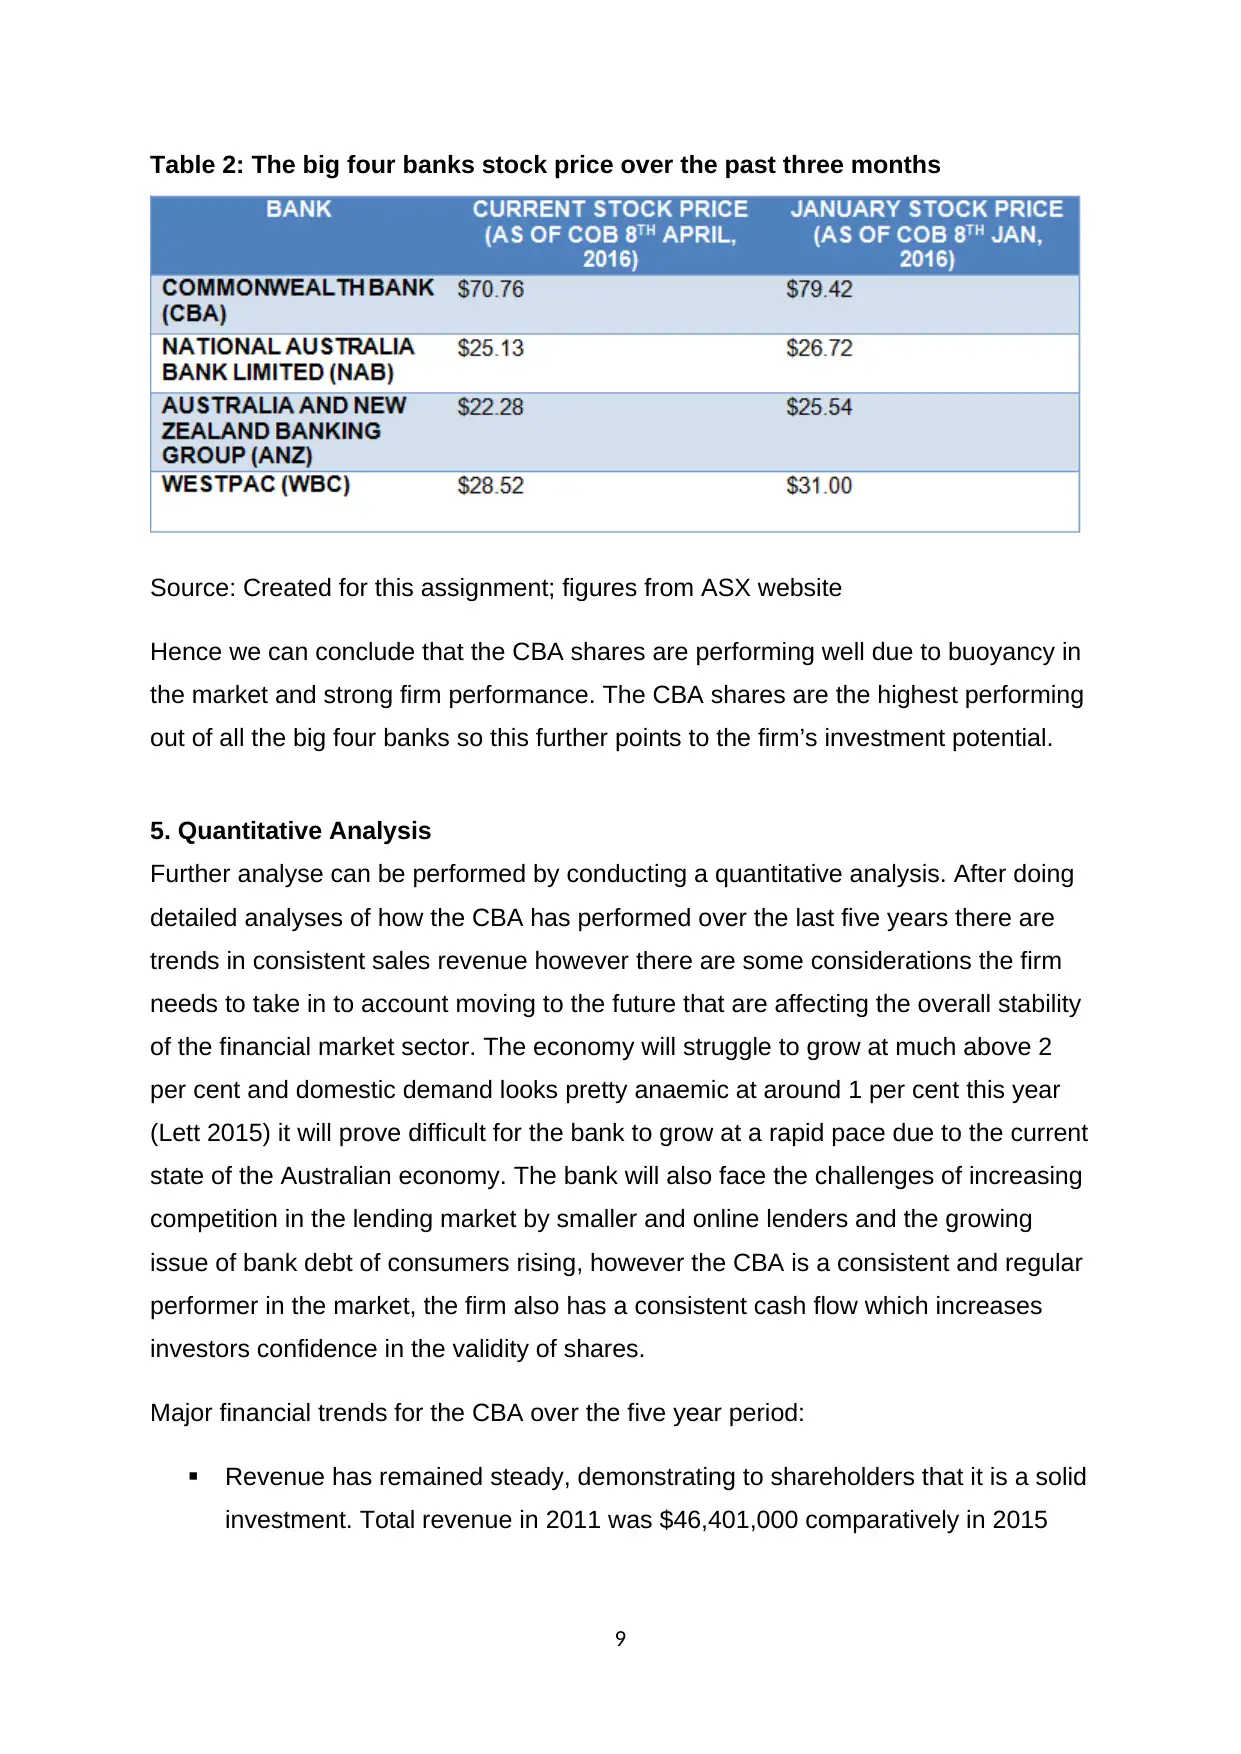
Table 2: The big four banks stock price over the past three months
Source: Created for this assignment; figures from ASX website
Hence we can conclude that the CBA shares are performing well due to buoyancy in
the market and strong firm performance. The CBA shares are the highest performing
out of all the big four banks so this further points to the firm’s investment potential.
5. Quantitative Analysis
Further analyse can be performed by conducting a quantitative analysis. After doing
detailed analyses of how the CBA has performed over the last five years there are
trends in consistent sales revenue however there are some considerations the firm
needs to take in to account moving to the future that are affecting the overall stability
of the financial market sector. The economy will struggle to grow at much above 2
per cent and domestic demand looks pretty anaemic at around 1 per cent this year
(Lett 2015) it will prove difficult for the bank to grow at a rapid pace due to the current
state of the Australian economy. The bank will also face the challenges of increasing
competition in the lending market by smaller and online lenders and the growing
issue of bank debt of consumers rising, however the CBA is a consistent and regular
performer in the market, the firm also has a consistent cash flow which increases
investors confidence in the validity of shares.
Major financial trends for the CBA over the five year period:
Revenue has remained steady, demonstrating to shareholders that it is a solid
investment. Total revenue in 2011 was $46,401,000 comparatively in 2015
9
⊘ This is a preview!⊘
Do you want full access?
Subscribe today to unlock all pages.
Trusted by 1+ million students worldwide
$45,310,000. Figures for sales and other revenue have also stayed fairly
consistent. (See appendix 1)
Total assets have grown consistently over the five year period from
$667,899.00 in 2011 to $873,446,000 in 2015 this shows a 31% increase over
a five year period which shows the firm is investing in new business
strategically. However the firm has also increased in liabilities from
$630,612,000 in 2011 to $820,43,000 in 2015 which is an increase in liabilities
of 30%. (See appendix 1)
Total share equity has risen in 2011 from a rate of $37,287,000 to
$52,993,000 in 2015 (See appendix 1)
Total revenue growth has risen from 1.7% in 2012 to 2.3% in 2015 showing
solid performance in growth (See appendix 2)
These figures demonstrate the strength of the firm which has seen continued growth
in share equity over the five year period; the firm has been investing in new business
and continues to have a diversified portfolio which keeps cash flow levels liquid.
6. Ratios
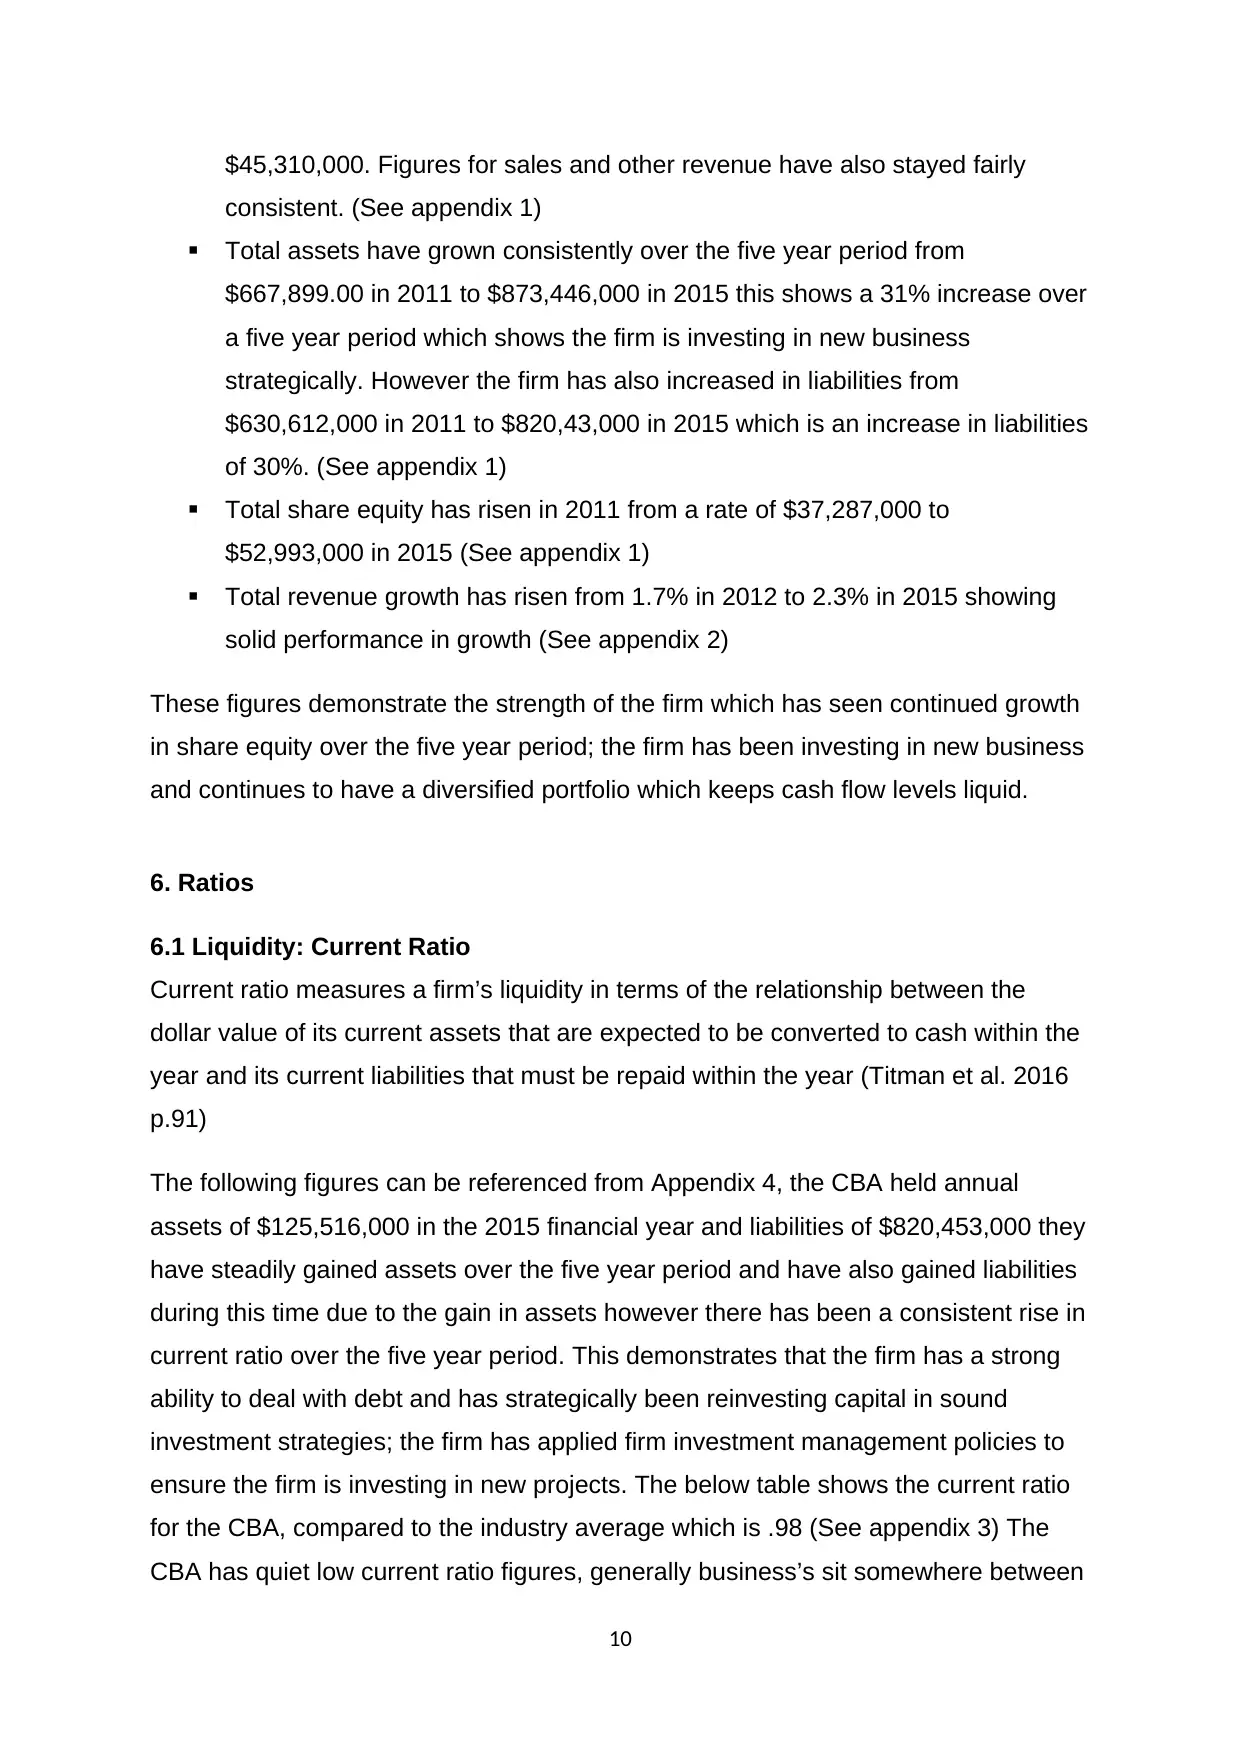
6.1 Liquidity: Current Ratio
Current ratio measures a firm’s liquidity in terms of the relationship between the
dollar value of its current assets that are expected to be converted to cash within the
year and its current liabilities that must be repaid within the year (Titman et al. 2016
p.91)
The following figures can be referenced from Appendix 4, the CBA held annual
assets of $125,516,000 in the 2015 financial year and liabilities of $820,453,000 they
have steadily gained assets over the five year period and have also gained liabilities
during this time due to the gain in assets however there has been a consistent rise in
current ratio over the five year period. This demonstrates that the firm has a strong
ability to deal with debt and has strategically been reinvesting capital in sound
investment strategies; the firm has applied firm investment management policies to
ensure the firm is investing in new projects. The below table shows the current ratio
for the CBA, compared to the industry average which is .98 (See appendix 3) The
CBA has quiet low current ratio figures, generally business’s sit somewhere between
10
consistent. (See appendix 1)
Total assets have grown consistently over the five year period from
$667,899.00 in 2011 to $873,446,000 in 2015 this shows a 31% increase over
a five year period which shows the firm is investing in new business
strategically. However the firm has also increased in liabilities from
$630,612,000 in 2011 to $820,43,000 in 2015 which is an increase in liabilities
of 30%. (See appendix 1)
Total share equity has risen in 2011 from a rate of $37,287,000 to
$52,993,000 in 2015 (See appendix 1)
Total revenue growth has risen from 1.7% in 2012 to 2.3% in 2015 showing
solid performance in growth (See appendix 2)
These figures demonstrate the strength of the firm which has seen continued growth
in share equity over the five year period; the firm has been investing in new business
and continues to have a diversified portfolio which keeps cash flow levels liquid.
6. Ratios
6.1 Liquidity: Current Ratio
Current ratio measures a firm’s liquidity in terms of the relationship between the
dollar value of its current assets that are expected to be converted to cash within the
year and its current liabilities that must be repaid within the year (Titman et al. 2016
p.91)
The following figures can be referenced from Appendix 4, the CBA held annual
assets of $125,516,000 in the 2015 financial year and liabilities of $820,453,000 they
have steadily gained assets over the five year period and have also gained liabilities
during this time due to the gain in assets however there has been a consistent rise in
current ratio over the five year period. This demonstrates that the firm has a strong
ability to deal with debt and has strategically been reinvesting capital in sound
investment strategies; the firm has applied firm investment management policies to
ensure the firm is investing in new projects. The below table shows the current ratio
for the CBA, compared to the industry average which is .98 (See appendix 3) The
CBA has quiet low current ratio figures, generally business’s sit somewhere between
10
Paraphrase This Document
Need a fresh take? Get an instant paraphrase of this document with our AI Paraphraser
1-3ratio. Banks run at much lower current ratios due to a higher rate of return
income. If a company has a reasonable amount of short-term debt but is expecting
substantial returns from a project or other investment not too long after its debts are
due, it will likely be able to stave off its debt (Investopedia 2016) The CBA is well
capitalised and has high profits of revenue coming in to the firm so below current
ratio is adequate the firm’s business.
Table 3: Current ratio: CBA
Source: Created for this assignment (See appendix 4)
6.2 Profitability: Net profit Margin ratio
The net profit margin captures the effects of all the firm’s expenses and indicates the
percentage of revenue left over after interest and tax have been considered (Titman
et.al 2016 p.45)
Figures from Appendix 2 below show the net profit margin for the CBA has been
steadily climbing from 24% in 2011 to 37% in 2015. The CBA annual report points to
strategic investment in assets and delivering greater options of insurance products
over the five year period.
Table 4: Net profit margin ratio for CBA
Source: Created for this assignment
We can ascertain from the benchmarking chart below the comparative rate of net
profit margin increased at a steady rate for the CBA compared to one of its major
competitors the National Australia bank (NAB) Therefore we conclude that the CBA
shares are increasing at a sound rate, the CBA has benefited from lower interest
rates in rate of profit return.
11
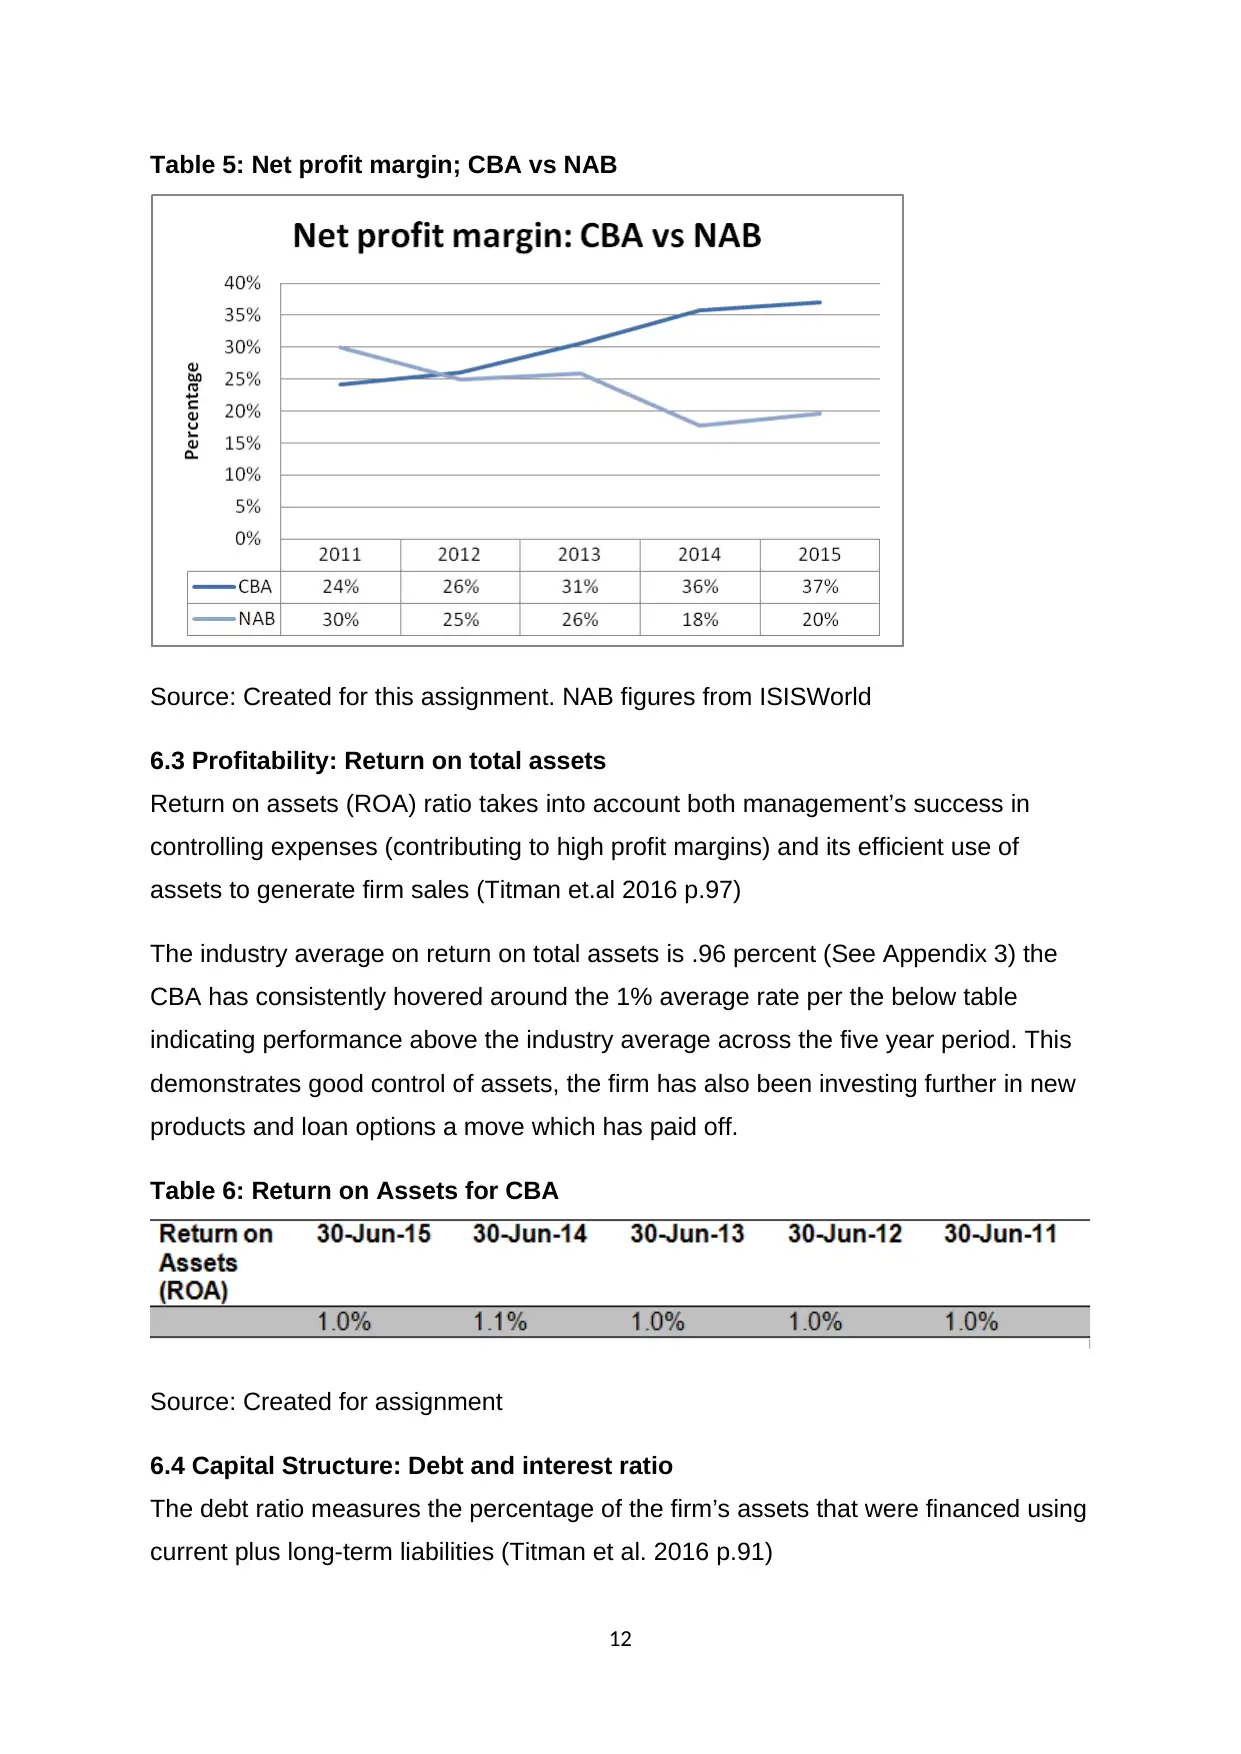
Table 5: Net profit margin; CBA vs NAB
Source: Created for this assignment. NAB figures from ISISWorld
6.3 Profitability: Return on total assets
Return on assets (ROA) ratio takes into account both management’s success in
controlling expenses (contributing to high profit margins) and its efficient use of
assets to generate firm sales (Titman et.al 2016 p.97)
The industry average on return on total assets is .96 percent (See Appendix 3) the
CBA has consistently hovered around the 1% average rate per the below table
indicating performance above the industry average across the five year period. This
demonstrates good control of assets, the firm has also been investing further in new
products and loan options a move which has paid off.
Table 6: Return on Assets for CBA
Source: Created for assignment
6.4 Capital Structure: Debt and interest ratio
The debt ratio measures the percentage of the firm’s assets that were financed using
current plus long-term liabilities (Titman et al. 2016 p.91)
12
⊘ This is a preview!⊘
Do you want full access?
Subscribe today to unlock all pages.
Trusted by 1+ million students worldwide
1 out of 26
Related Documents


Your All-in-One AI-Powered Toolkit for Academic Success.
+13062052269
info@desklib.com
Available 24*7 on WhatsApp / Email
![[object Object]](/_next/static/media/star-bottom.7253800d.svg)
Unlock your academic potential
Copyright © 2020–2026 A2Z Services. All Rights Reserved. Developed and managed by ZUCOL.