Analysis of Commonwealth Bank's Financial Performance: 19 HC1010
VerifiedAdded on 2021/05/31
|18
|4117
|92
Report
AI Summary
This report provides a detailed analysis of the financial performance of Commonwealth Bank (CBA). It begins with an executive summary that highlights the core areas of organizational performance, including financial, market, and shareholder value. The report then delves into a comprehensive examination of CBA's financial standing, comparing its profitability with Westpac Bank through income statement analysis and key profitability ratios like net profit margin, return on equity, and return on assets. The cash flow statement is analyzed to assess the company's liquidity and efficiency. Furthermore, the report evaluates CBA's financial position by scrutinizing its balance sheet, focusing on assets, liabilities, and shareholder equity. The analysis extends to ratio analysis over the last three years, providing insights into financial trends. Finally, the report examines the director's report and management's approach to business operations, investments, and financing activities. The report concludes with recommendations and references to support the analysis.
1
HC1010 Accounting for Business
Trimester 1, 2018
HC1010 Accounting for Business
Trimester 1, 2018
Paraphrase This Document
Need a fresh take? Get an instant paraphrase of this document with our AI Paraphraser
2
Executive Summary
Organizational Performance comprises of analysis of three main core areas of the
business i.e. financial performance, market performance and shareholders’ value. In this report
financial performance of Commonwealth Bank has been analyzed through evaluating the
financial statement of current year and comparing it with the previous year. Financial
performance of Commonwealth Bank has also been compared with its main competitor Westpac
Bank. Competitor analysis helps to evaluate the firm performance with other entities in same
industry and market. Ratio analysis helps to report on the financial strength of the company over
the last three years and also tells about the trend in the financial performance of the company. It
has been found that financial performance of Commonwealth Bank was stable during the last
three years and its performance was much better than Westpac Bank.
3
Contents
Introduction......................................................................................................................................4
Section 1: Financial Standing of the Commonwealth Bank............................................................5
Part A: Analysis of the profitability of the company and comparison with the competitor........5
Part B: Analysis of the cash flow statement................................................................................9
Part C: Analysis of the financial position through analyzing the balance sheet........................10
Section 2: Ratio Analysis (For Last Three Years).........................................................................12
Section 3: Analysis of the director’s report and other statements for analyzing the performance of
management...................................................................................................................................13
Corporate Governance Statement & Integrity Policy................................................................13
Approach of Management Towards...........................................................................................14
Business Operations...................................................................................................................15
Investments and Investment Activities......................................................................................15
Financing and Financing Activities...........................................................................................15
Industry Size..............................................................................................................................16
Major Players/Competitors........................................................................................................16
Market Shares of Industry Players.............................................................................................16
Recommendation and Conclusion.................................................................................................17
References......................................................................................................................................18
⊘ This is a preview!⊘
Do you want full access?
Subscribe today to unlock all pages.
Trusted by 1+ million students worldwide
4
Introduction
Organizational performance helps to evaluate the three core areas of the company,
namely financial performance, market performance and shareholders’ value. While analyzing the
organizational performance actual results are compared with the intended outputs. Professionals,
management, stakeholders and strategic planners focus on the organizational performance in
order to use the derived information in making useful decisions. In financial performance, there
has been measurement of the company’s operations and defined policies in monetary terms. The
financial performance analysis is likely to answer the question that what was return on
investment or assets and whether there has been increased in debt or it has been gone down. In
market performance there has been analysis of the share performance and other information that
impacts the market. Shareholders analysis provides information whether company is providing
enough returns to the shareholders or not and how company is maximizing the overall returns of
the shareholders. There are various factors that impact the overall organizational performance of
the company and while evaluating the organizational performance there is need to evaluate all
these factors. Financial performance can be evaluated through analyzing the profitability of the
company, analyzing the cash flow statement and evaluating the financial position of the
company. In order to evaluate the financial performance there is need to perform the ratio
analysis that compares the financial performance of the current year with the financial
performance of previous year (Brealey, Myers and Marcus, 2012).
In this report, organizational performance of the Commonwealth Bank has been analyzed
in order to report the current year performance to the management and other stakeholders of the
company. In order to analyse the organizational performance, current year data has been
compared with past year data and also compared with the financial data of competitor in same
industry. There are overall three sections that has to be present in the report. First section
evaluates all the financial statements in order to report the performance. In second section ratio
analysis for last three years has been performed to report on financial strength of Commonwealth
Bank. In last section, a report has been prepared to explain how the management performs in best
interest of the company.
Paraphrase This Document
Need a fresh take? Get an instant paraphrase of this document with our AI Paraphraser
5
Section 1: Financial Standing of the Commonwealth Bank
Part A: Analysis of the profitability of the company and comparison with the competitor
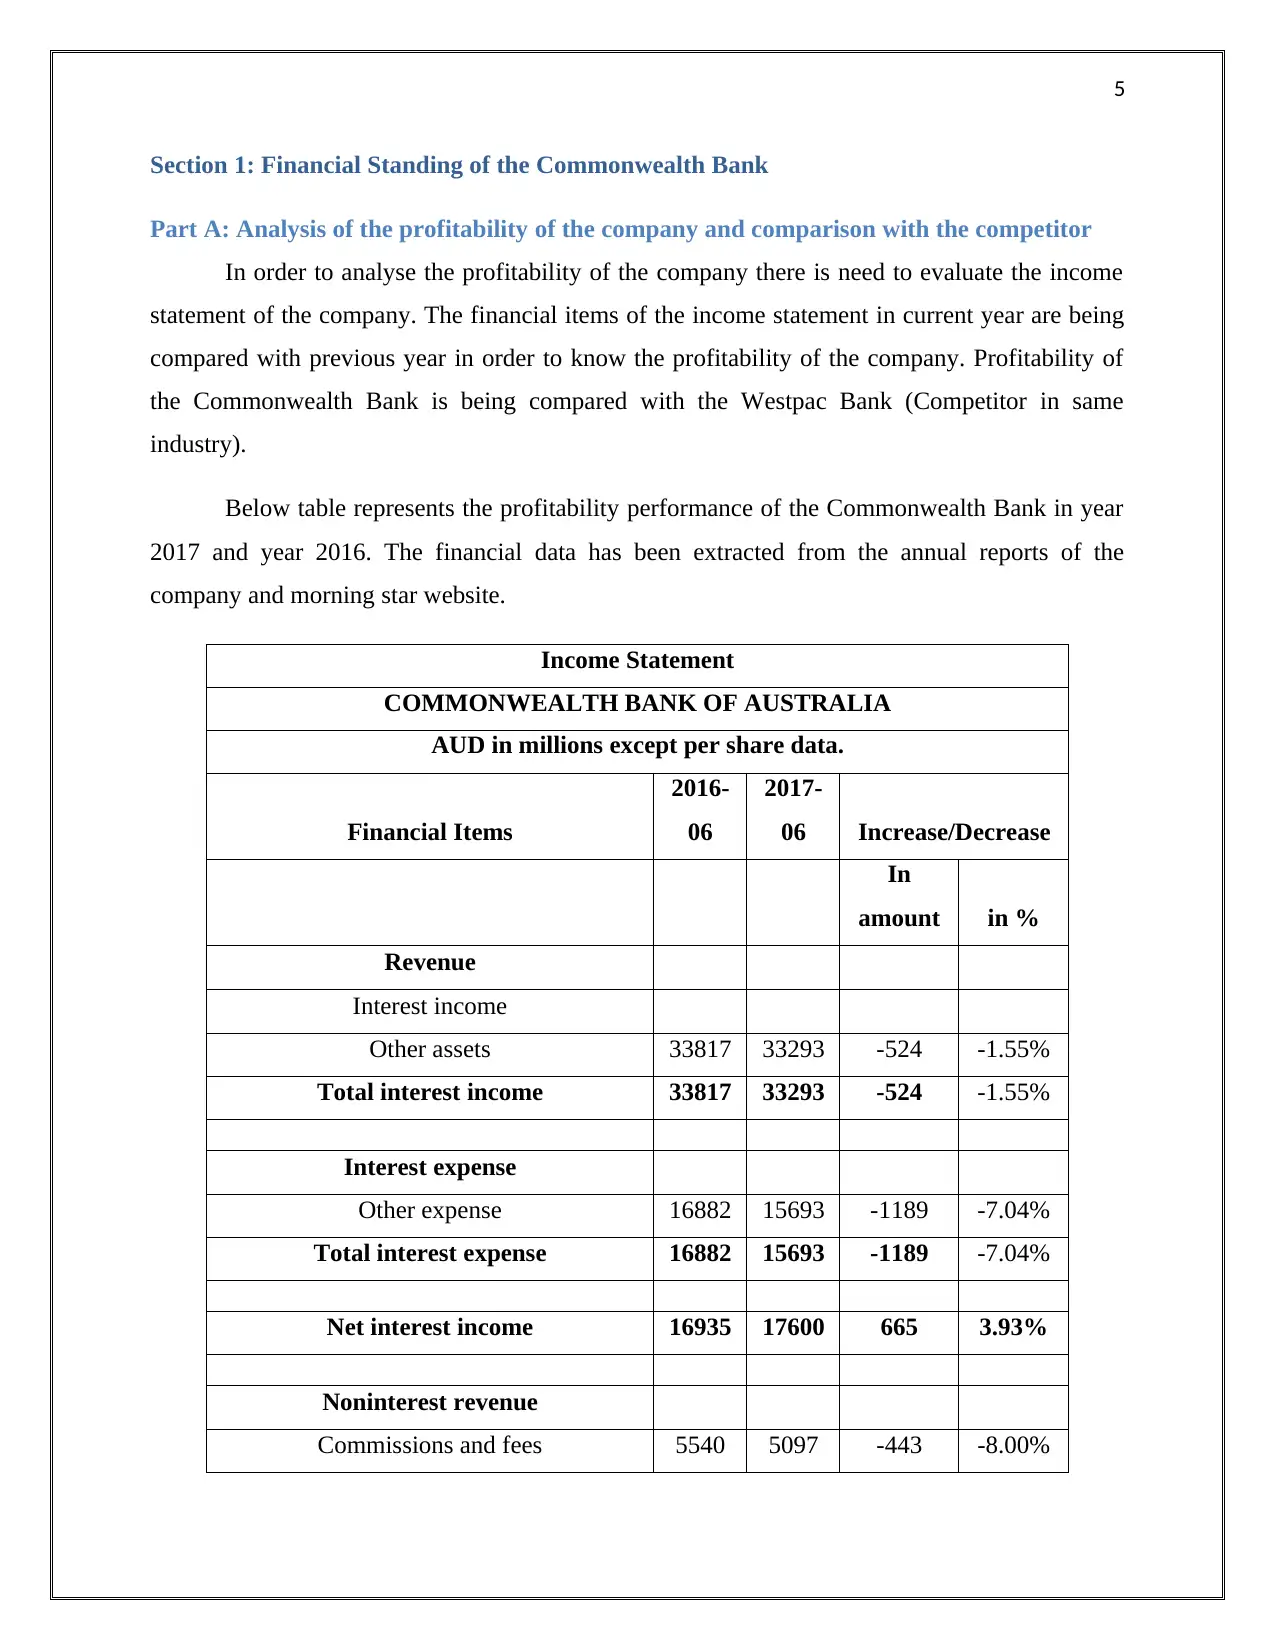
In order to analyse the profitability of the company there is need to evaluate the income
statement of the company. The financial items of the income statement in current year are being
compared with previous year in order to know the profitability of the company. Profitability of
the Commonwealth Bank is being compared with the Westpac Bank (Competitor in same
industry).
Below table represents the profitability performance of the Commonwealth Bank in year
2017 and year 2016. The financial data has been extracted from the annual reports of the
company and morning star website.
Income Statement
COMMONWEALTH BANK OF AUSTRALIA
AUD in millions except per share data.
Financial Items
2016-
06
2017-
06 Increase/Decrease
In
amount in %
Revenue
Interest income
Other assets 33817 33293 -524 -1.55%
Total interest income 33817 33293 -524 -1.55%
Interest expense
Other expense 16882 15693 -1189 -7.04%
Total interest expense 16882 15693 -1189 -7.04%
Net interest income 16935 17600 665 3.93%
Noninterest revenue
Commissions and fees 5540 5097 -443 -8.00%
Section 1: Financial Standing of the Commonwealth Bank
Part A: Analysis of the profitability of the company and comparison with the competitor
In order to analyse the profitability of the company there is need to evaluate the income
statement of the company. The financial items of the income statement in current year are being
compared with previous year in order to know the profitability of the company. Profitability of
the Commonwealth Bank is being compared with the Westpac Bank (Competitor in same
industry).
Below table represents the profitability performance of the Commonwealth Bank in year
2017 and year 2016. The financial data has been extracted from the annual reports of the
company and morning star website.
Income Statement
COMMONWEALTH BANK OF AUSTRALIA
AUD in millions except per share data.
Financial Items
2016-
06
2017-
06 Increase/Decrease
In
amount in %
Revenue
Interest income
Other assets 33817 33293 -524 -1.55%
Total interest income 33817 33293 -524 -1.55%
Interest expense
Other expense 16882 15693 -1189 -7.04%
Total interest expense 16882 15693 -1189 -7.04%
Net interest income 16935 17600 665 3.93%
Noninterest revenue
Commissions and fees 5540 5097 -443 -8.00%
6
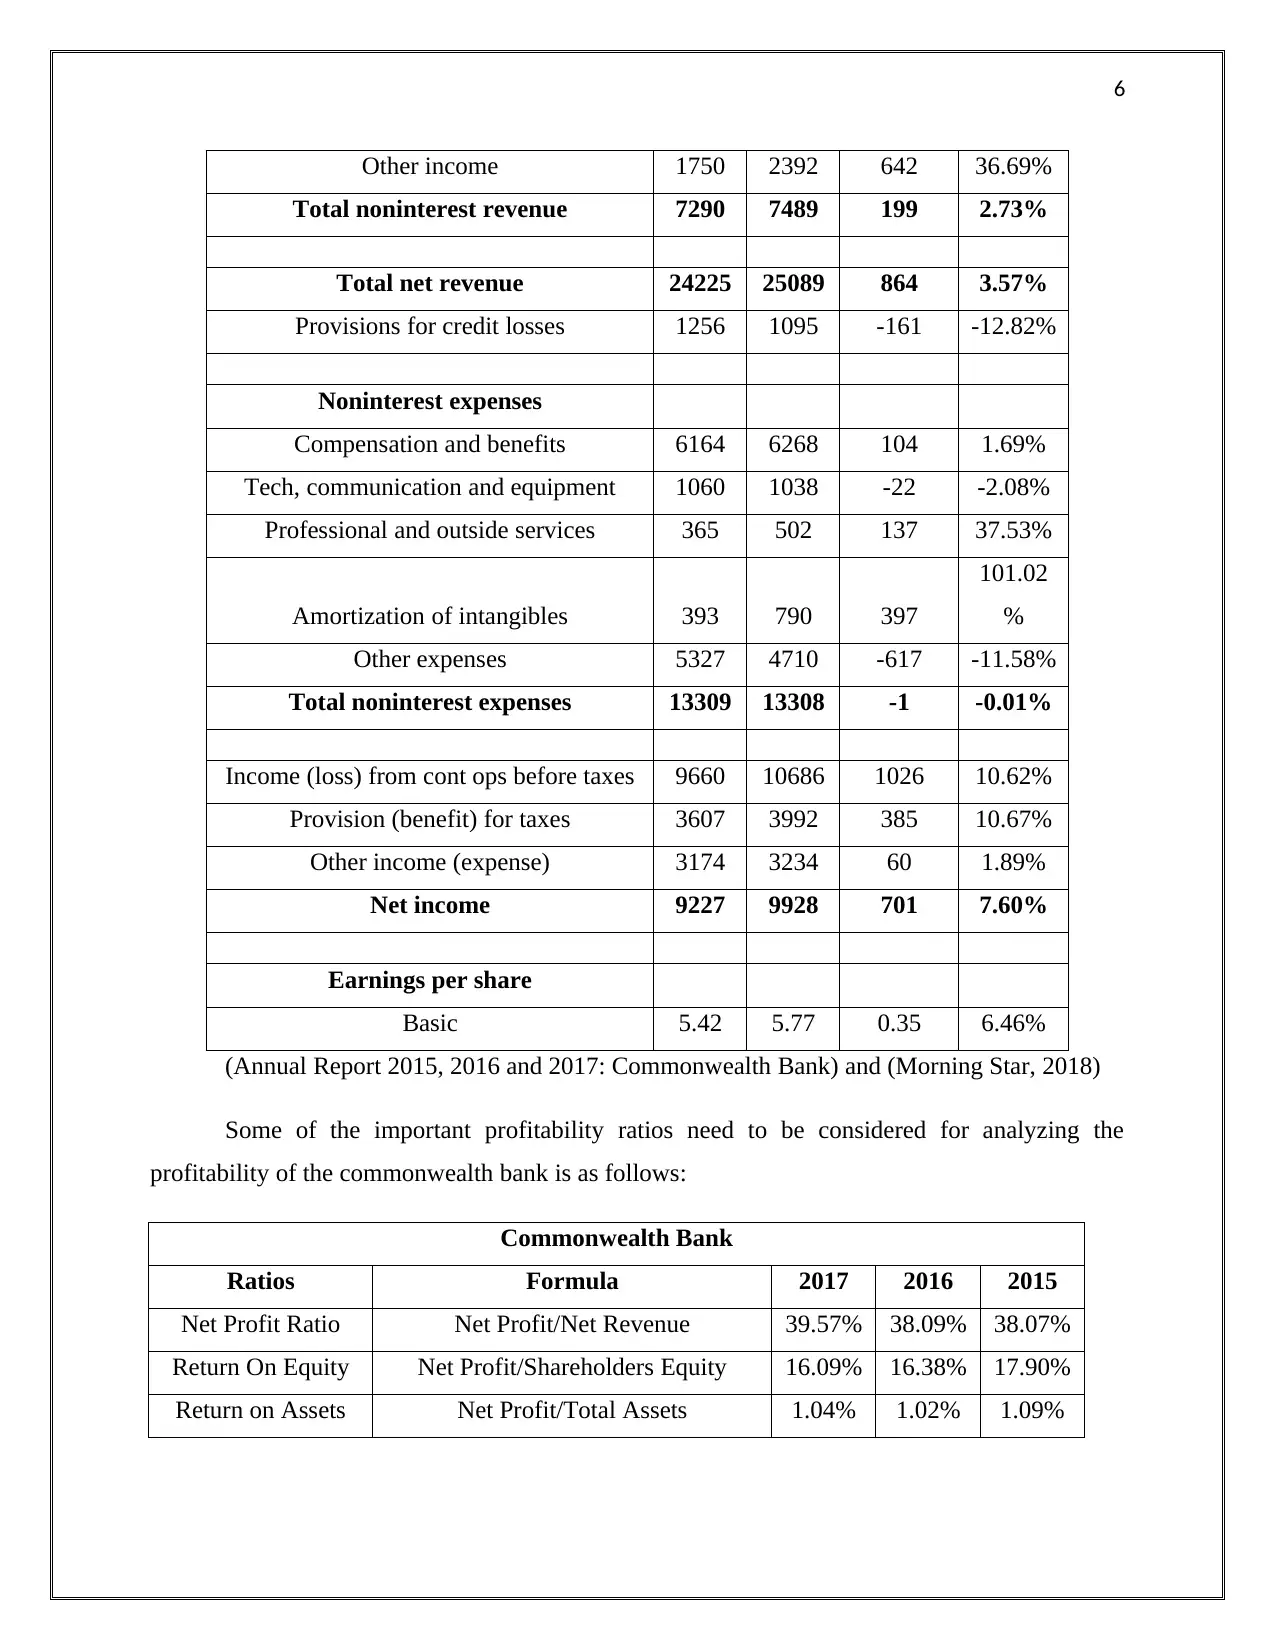
Other income 1750 2392 642 36.69%
Total noninterest revenue 7290 7489 199 2.73%
Total net revenue 24225 25089 864 3.57%
Provisions for credit losses 1256 1095 -161 -12.82%
Noninterest expenses
Compensation and benefits 6164 6268 104 1.69%
Tech, communication and equipment 1060 1038 -22 -2.08%
Professional and outside services 365 502 137 37.53%
Amortization of intangibles 393 790 397
101.02
%
Other expenses 5327 4710 -617 -11.58%
Total noninterest expenses 13309 13308 -1 -0.01%
Income (loss) from cont ops before taxes 9660 10686 1026 10.62%
Provision (benefit) for taxes 3607 3992 385 10.67%
Other income (expense) 3174 3234 60 1.89%
Net income 9227 9928 701 7.60%
Earnings per share
Basic 5.42 5.77 0.35 6.46%
(Annual Report 2015, 2016 and 2017: Commonwealth Bank) and (Morning Star, 2018)
Some of the important profitability ratios need to be considered for analyzing the
profitability of the commonwealth bank is as follows:
Commonwealth Bank
Ratios Formula 2017 2016 2015
Net Profit Ratio Net Profit/Net Revenue 39.57% 38.09% 38.07%
Return On Equity Net Profit/Shareholders Equity 16.09% 16.38% 17.90%
Return on Assets Net Profit/Total Assets 1.04% 1.02% 1.09%
⊘ This is a preview!⊘
Do you want full access?
Subscribe today to unlock all pages.
Trusted by 1+ million students worldwide
7
Westpac Bank
Ratios Formula 2017 2016 2015
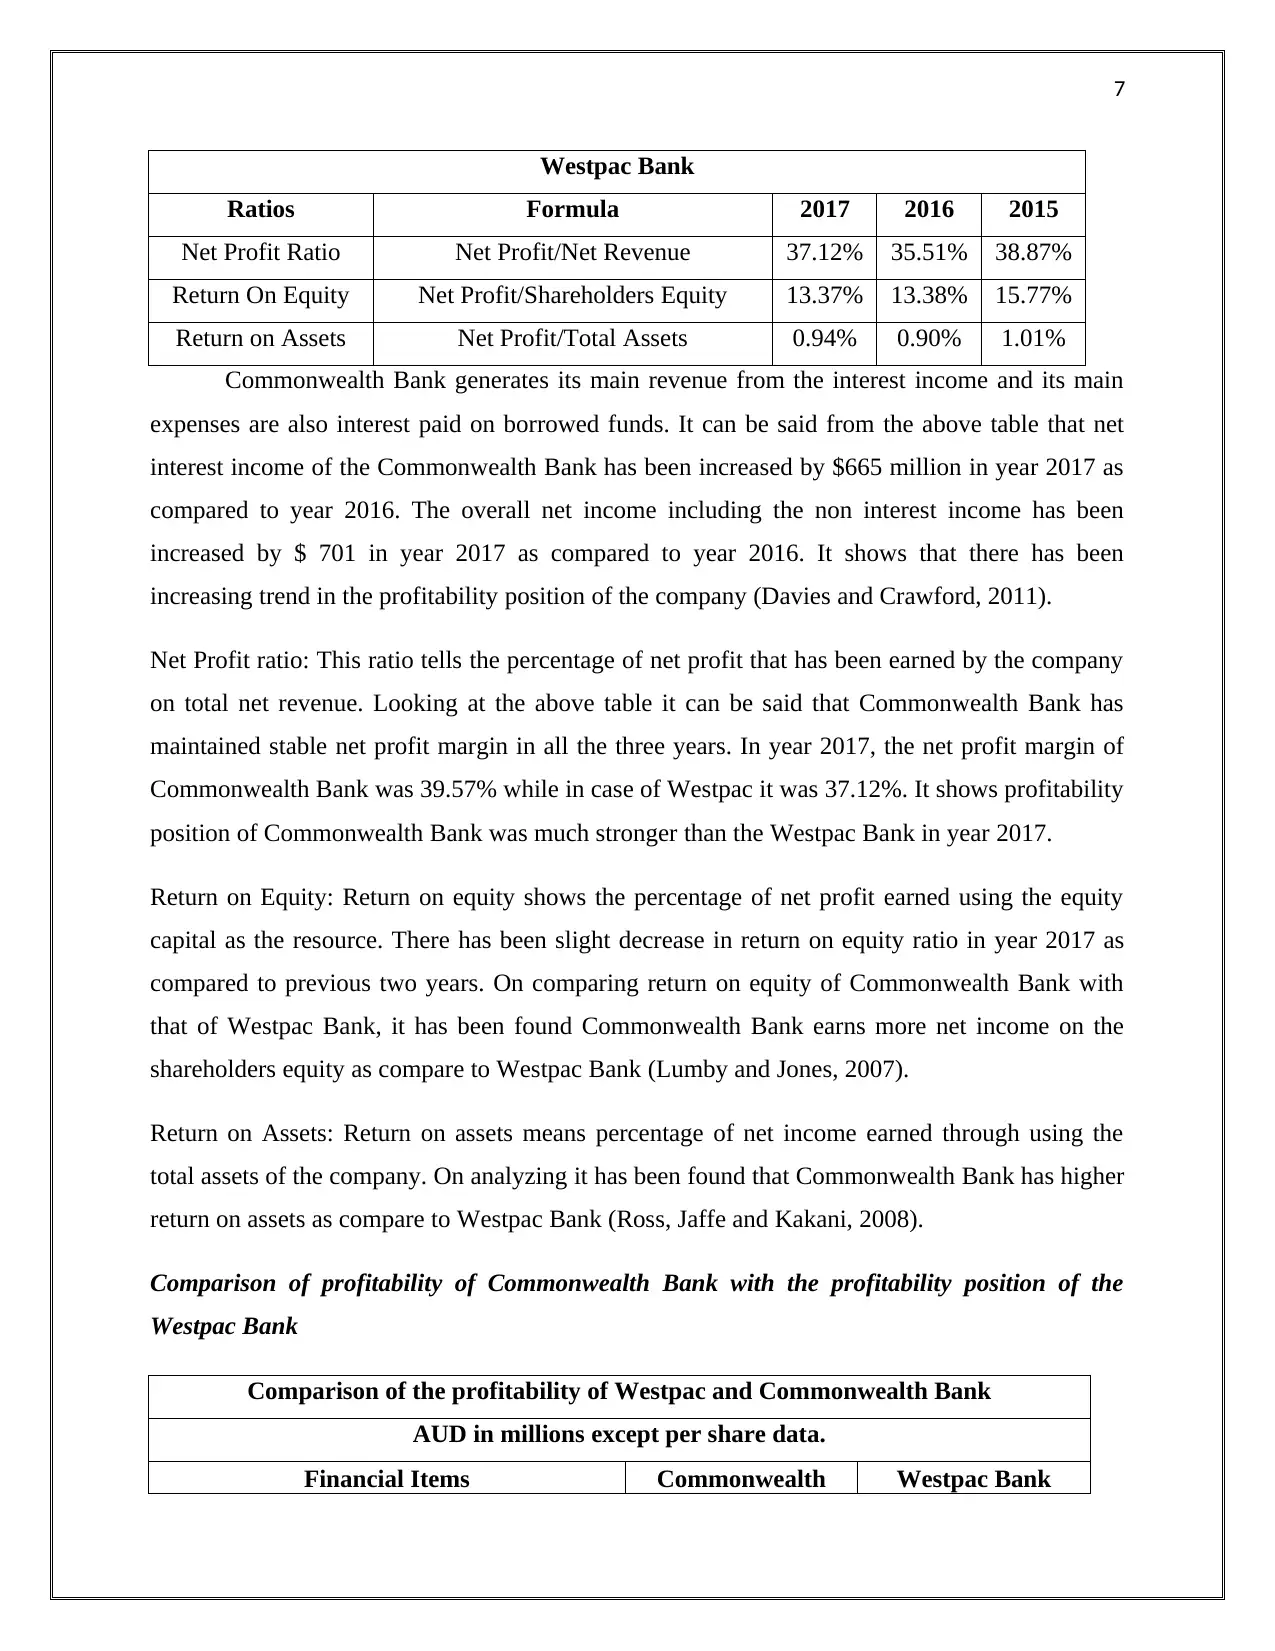
Net Profit Ratio Net Profit/Net Revenue 37.12% 35.51% 38.87%
Return On Equity Net Profit/Shareholders Equity 13.37% 13.38% 15.77%
Return on Assets Net Profit/Total Assets 0.94% 0.90% 1.01%
Commonwealth Bank generates its main revenue from the interest income and its main
expenses are also interest paid on borrowed funds. It can be said from the above table that net
interest income of the Commonwealth Bank has been increased by $665 million in year 2017 as
compared to year 2016. The overall net income including the non interest income has been
increased by $ 701 in year 2017 as compared to year 2016. It shows that there has been
increasing trend in the profitability position of the company (Davies and Crawford, 2011).
Net Profit ratio: This ratio tells the percentage of net profit that has been earned by the company
on total net revenue. Looking at the above table it can be said that Commonwealth Bank has
maintained stable net profit margin in all the three years. In year 2017, the net profit margin of
Commonwealth Bank was 39.57% while in case of Westpac it was 37.12%. It shows profitability
position of Commonwealth Bank was much stronger than the Westpac Bank in year 2017.
Return on Equity: Return on equity shows the percentage of net profit earned using the equity
capital as the resource. There has been slight decrease in return on equity ratio in year 2017 as
compared to previous two years. On comparing return on equity of Commonwealth Bank with
that of Westpac Bank, it has been found Commonwealth Bank earns more net income on the
shareholders equity as compare to Westpac Bank (Lumby and Jones, 2007).
Return on Assets: Return on assets means percentage of net income earned through using the
total assets of the company. On analyzing it has been found that Commonwealth Bank has higher
return on assets as compare to Westpac Bank (Ross, Jaffe and Kakani, 2008).
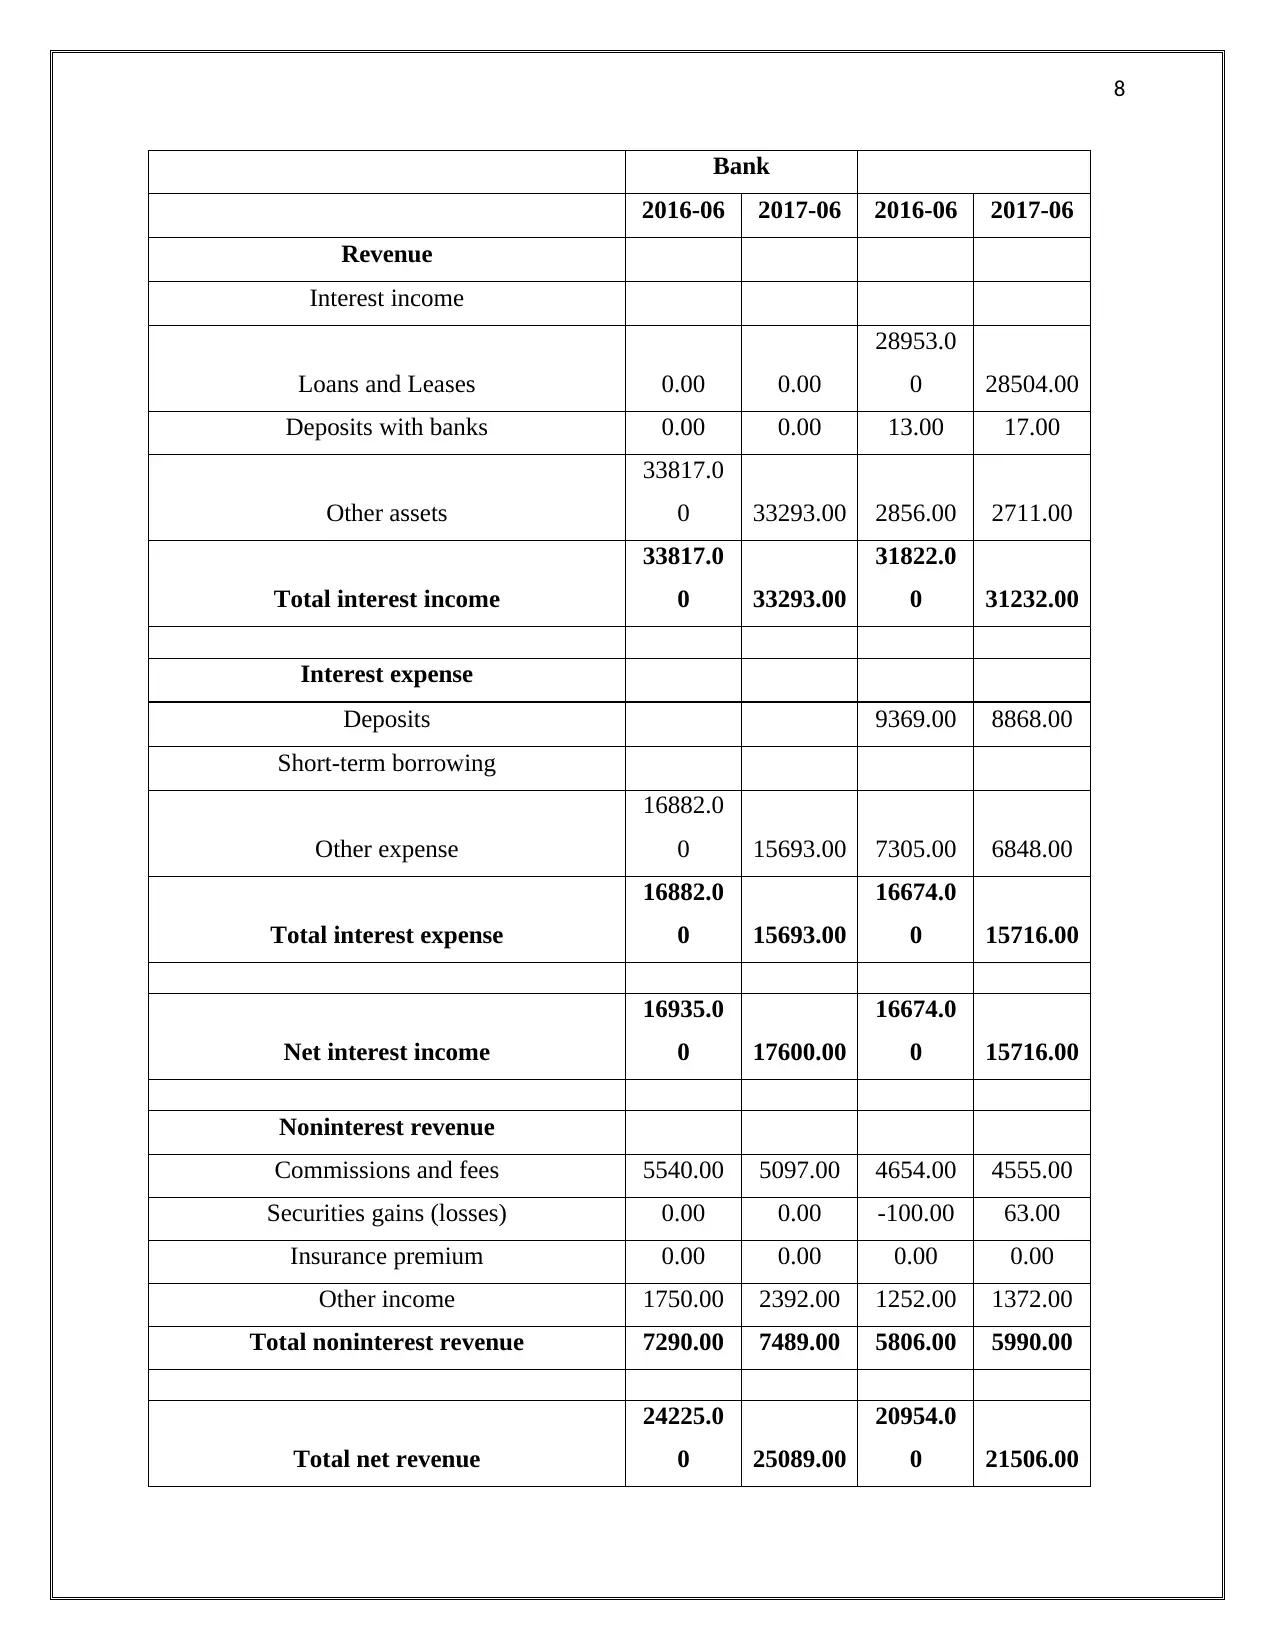
Comparison of profitability of Commonwealth Bank with the profitability position of the
Westpac Bank
Comparison of the profitability of Westpac and Commonwealth Bank
AUD in millions except per share data.
Financial Items Commonwealth Westpac Bank
Westpac Bank
Ratios Formula 2017 2016 2015
Net Profit Ratio Net Profit/Net Revenue 37.12% 35.51% 38.87%
Return On Equity Net Profit/Shareholders Equity 13.37% 13.38% 15.77%
Return on Assets Net Profit/Total Assets 0.94% 0.90% 1.01%
Commonwealth Bank generates its main revenue from the interest income and its main
expenses are also interest paid on borrowed funds. It can be said from the above table that net
interest income of the Commonwealth Bank has been increased by $665 million in year 2017 as
compared to year 2016. The overall net income including the non interest income has been
increased by $ 701 in year 2017 as compared to year 2016. It shows that there has been
increasing trend in the profitability position of the company (Davies and Crawford, 2011).
Net Profit ratio: This ratio tells the percentage of net profit that has been earned by the company
on total net revenue. Looking at the above table it can be said that Commonwealth Bank has
maintained stable net profit margin in all the three years. In year 2017, the net profit margin of
Commonwealth Bank was 39.57% while in case of Westpac it was 37.12%. It shows profitability
position of Commonwealth Bank was much stronger than the Westpac Bank in year 2017.
Return on Equity: Return on equity shows the percentage of net profit earned using the equity
capital as the resource. There has been slight decrease in return on equity ratio in year 2017 as
compared to previous two years. On comparing return on equity of Commonwealth Bank with
that of Westpac Bank, it has been found Commonwealth Bank earns more net income on the
shareholders equity as compare to Westpac Bank (Lumby and Jones, 2007).
Return on Assets: Return on assets means percentage of net income earned through using the
total assets of the company. On analyzing it has been found that Commonwealth Bank has higher
return on assets as compare to Westpac Bank (Ross, Jaffe and Kakani, 2008).
Comparison of profitability of Commonwealth Bank with the profitability position of the
Westpac Bank
Comparison of the profitability of Westpac and Commonwealth Bank
AUD in millions except per share data.
Financial Items Commonwealth Westpac Bank
Paraphrase This Document
Need a fresh take? Get an instant paraphrase of this document with our AI Paraphraser
8
Bank
2016-06 2017-06 2016-06 2017-06
Revenue
Interest income
Loans and Leases 0.00 0.00
28953.0
0 28504.00
Deposits with banks 0.00 0.00 13.00 17.00
Other assets
33817.0
0 33293.00 2856.00 2711.00
Total interest income
33817.0
0 33293.00
31822.0
0 31232.00
Interest expense
Deposits 9369.00 8868.00
Short-term borrowing
Other expense
16882.0
0 15693.00 7305.00 6848.00
Total interest expense
16882.0
0 15693.00
16674.0
0 15716.00
Net interest income
16935.0
0 17600.00
16674.0
0 15716.00
Noninterest revenue
Commissions and fees 5540.00 5097.00 4654.00 4555.00
Securities gains (losses) 0.00 0.00 -100.00 63.00
Insurance premium 0.00 0.00 0.00 0.00
Other income 1750.00 2392.00 1252.00 1372.00
Total noninterest revenue 7290.00 7489.00 5806.00 5990.00
Total net revenue
24225.0
0 25089.00
20954.0
0 21506.00
9
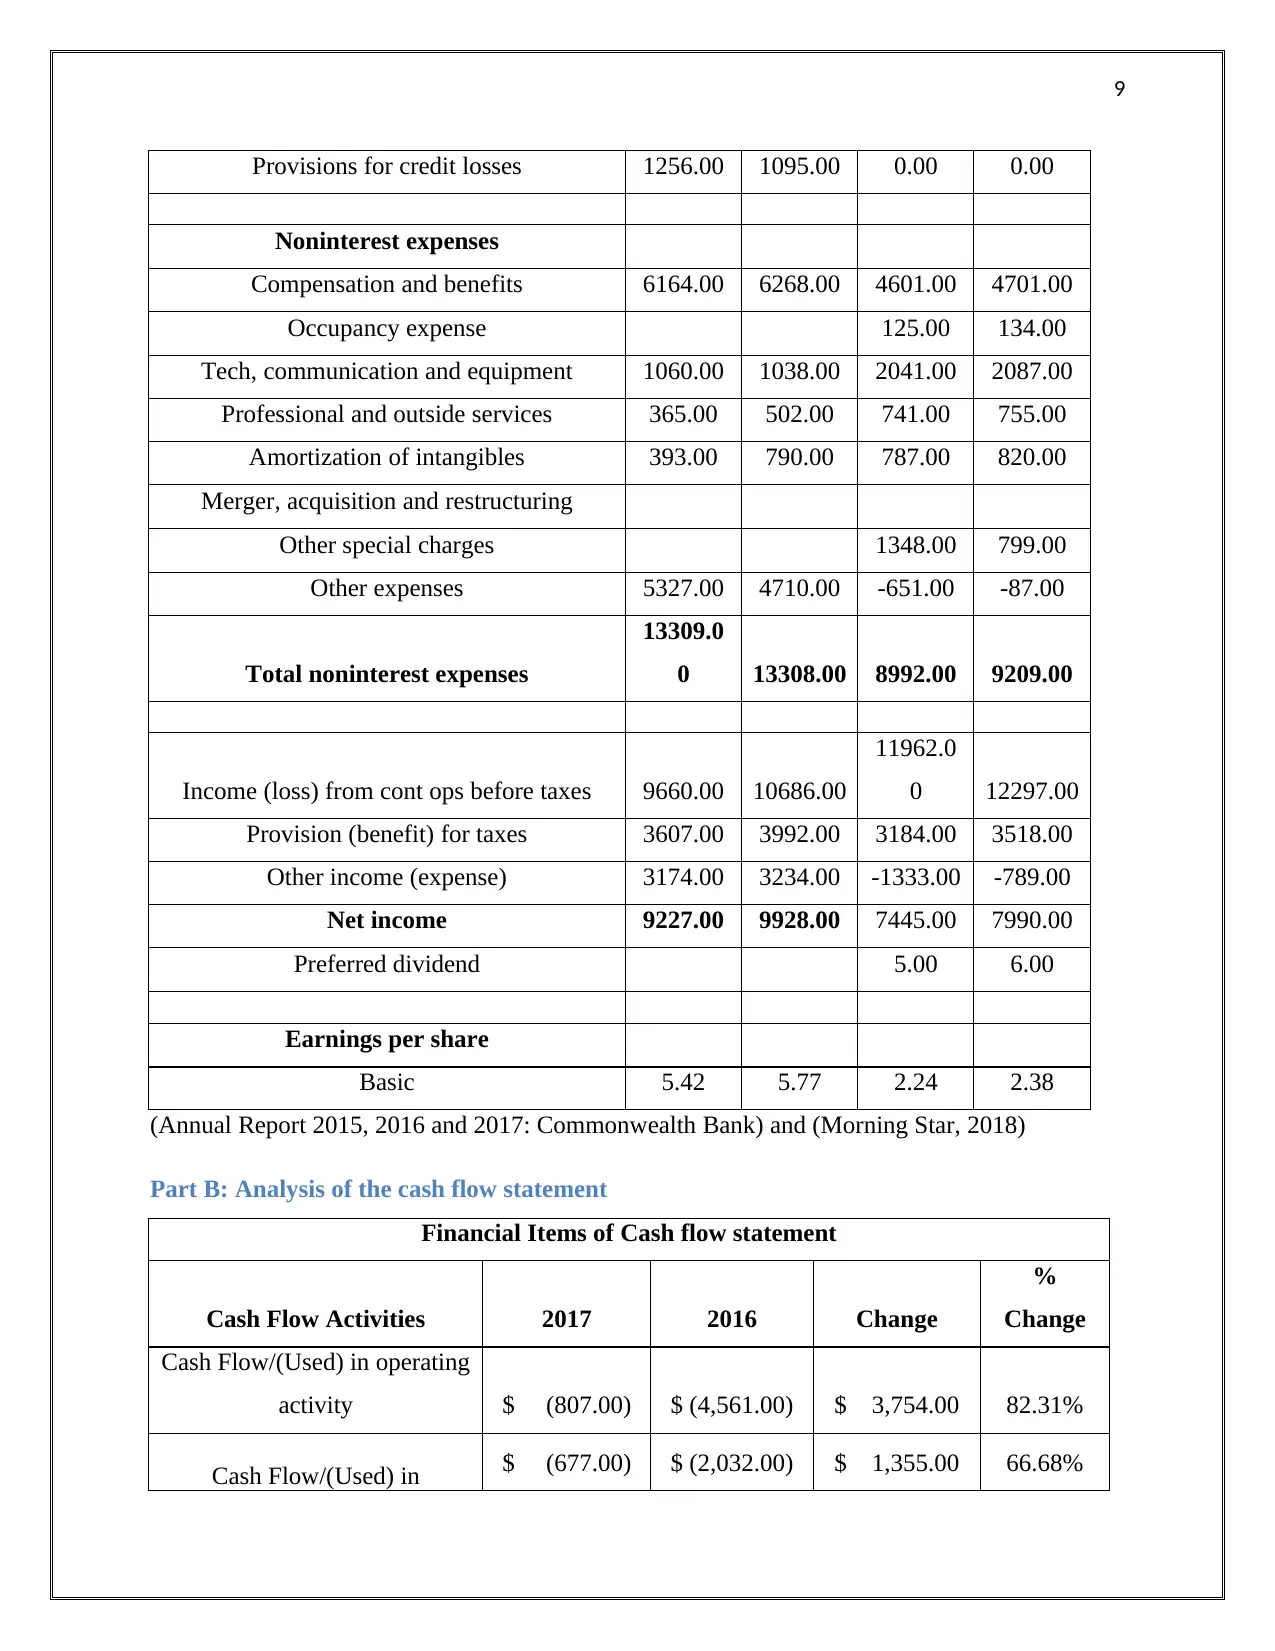
Provisions for credit losses 1256.00 1095.00 0.00 0.00
Noninterest expenses
Compensation and benefits 6164.00 6268.00 4601.00 4701.00
Occupancy expense 125.00 134.00
Tech, communication and equipment 1060.00 1038.00 2041.00 2087.00
Professional and outside services 365.00 502.00 741.00 755.00
Amortization of intangibles 393.00 790.00 787.00 820.00
Merger, acquisition and restructuring
Other special charges 1348.00 799.00
Other expenses 5327.00 4710.00 -651.00 -87.00
Total noninterest expenses
13309.0
0 13308.00 8992.00 9209.00
Income (loss) from cont ops before taxes 9660.00 10686.00
11962.0
0 12297.00
Provision (benefit) for taxes 3607.00 3992.00 3184.00 3518.00
Other income (expense) 3174.00 3234.00 -1333.00 -789.00
Net income 9227.00 9928.00 7445.00 7990.00
Preferred dividend 5.00 6.00
Earnings per share
Basic 5.42 5.77 2.24 2.38
(Annual Report 2015, 2016 and 2017: Commonwealth Bank) and (Morning Star, 2018)
Part B: Analysis of the cash flow statement
Financial Items of Cash flow statement
Cash Flow Activities 2017 2016 Change
%
Change
Cash Flow/(Used) in operating
activity $ (807.00) $ (4,561.00) $ 3,754.00 82.31%
Cash Flow/(Used) in $ (677.00) $ (2,032.00) $ 1,355.00 66.68%
⊘ This is a preview!⊘
Do you want full access?
Subscribe today to unlock all pages.
Trusted by 1+ million students worldwide
10
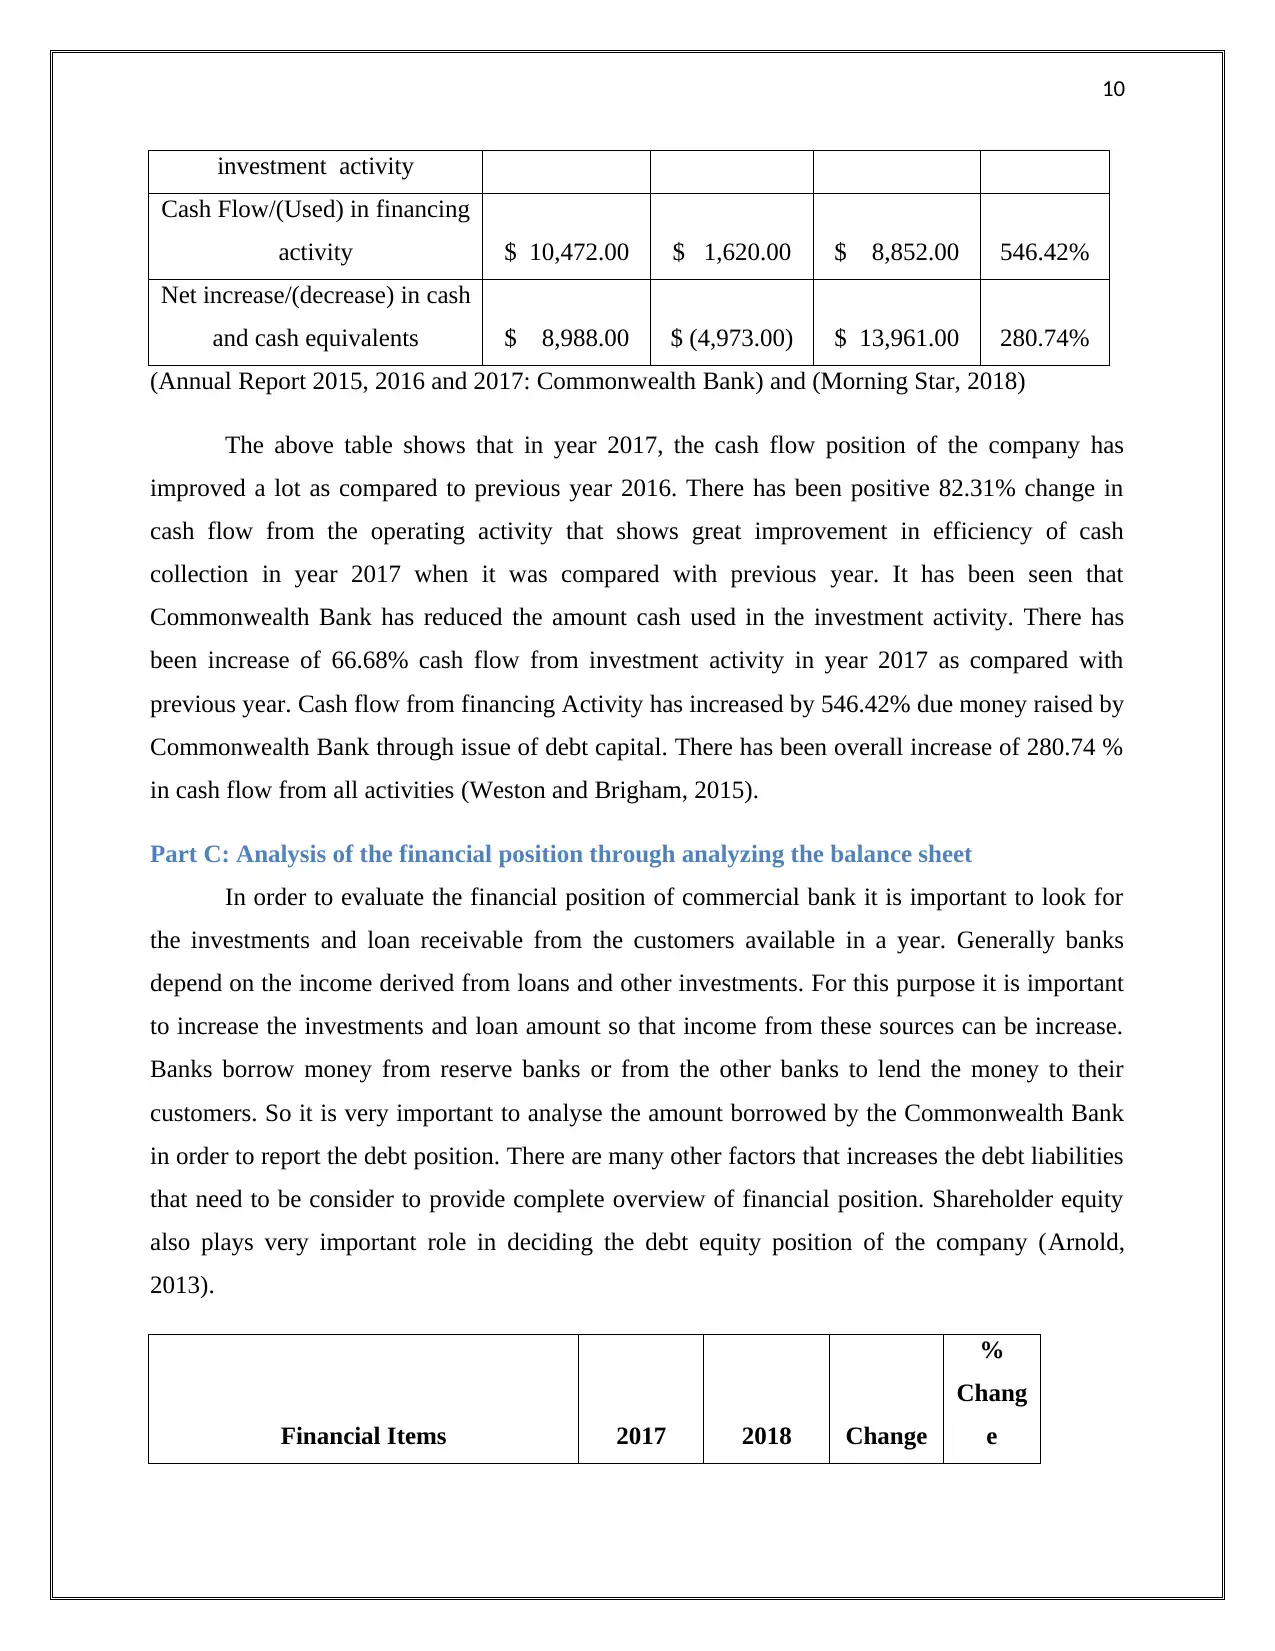
investment activity
Cash Flow/(Used) in financing
activity $ 10,472.00 $ 1,620.00 $ 8,852.00 546.42%
Net increase/(decrease) in cash
and cash equivalents $ 8,988.00 $ (4,973.00) $ 13,961.00 280.74%
(Annual Report 2015, 2016 and 2017: Commonwealth Bank) and (Morning Star, 2018)
The above table shows that in year 2017, the cash flow position of the company has
improved a lot as compared to previous year 2016. There has been positive 82.31% change in
cash flow from the operating activity that shows great improvement in efficiency of cash
collection in year 2017 when it was compared with previous year. It has been seen that
Commonwealth Bank has reduced the amount cash used in the investment activity. There has
been increase of 66.68% cash flow from investment activity in year 2017 as compared with
previous year. Cash flow from financing Activity has increased by 546.42% due money raised by
Commonwealth Bank through issue of debt capital. There has been overall increase of 280.74 %
in cash flow from all activities (Weston and Brigham, 2015).
Part C: Analysis of the financial position through analyzing the balance sheet
In order to evaluate the financial position of commercial bank it is important to look for
the investments and loan receivable from the customers available in a year. Generally banks
depend on the income derived from loans and other investments. For this purpose it is important
to increase the investments and loan amount so that income from these sources can be increase.
Banks borrow money from reserve banks or from the other banks to lend the money to their
customers. So it is very important to analyse the amount borrowed by the Commonwealth Bank
in order to report the debt position. There are many other factors that increases the debt liabilities
that need to be consider to provide complete overview of financial position. Shareholder equity
also plays very important role in deciding the debt equity position of the company (Arnold,
2013).
Financial Items 2017 2018 Change
%
Chang
e
Paraphrase This Document
Need a fresh take? Get an instant paraphrase of this document with our AI Paraphraser
11
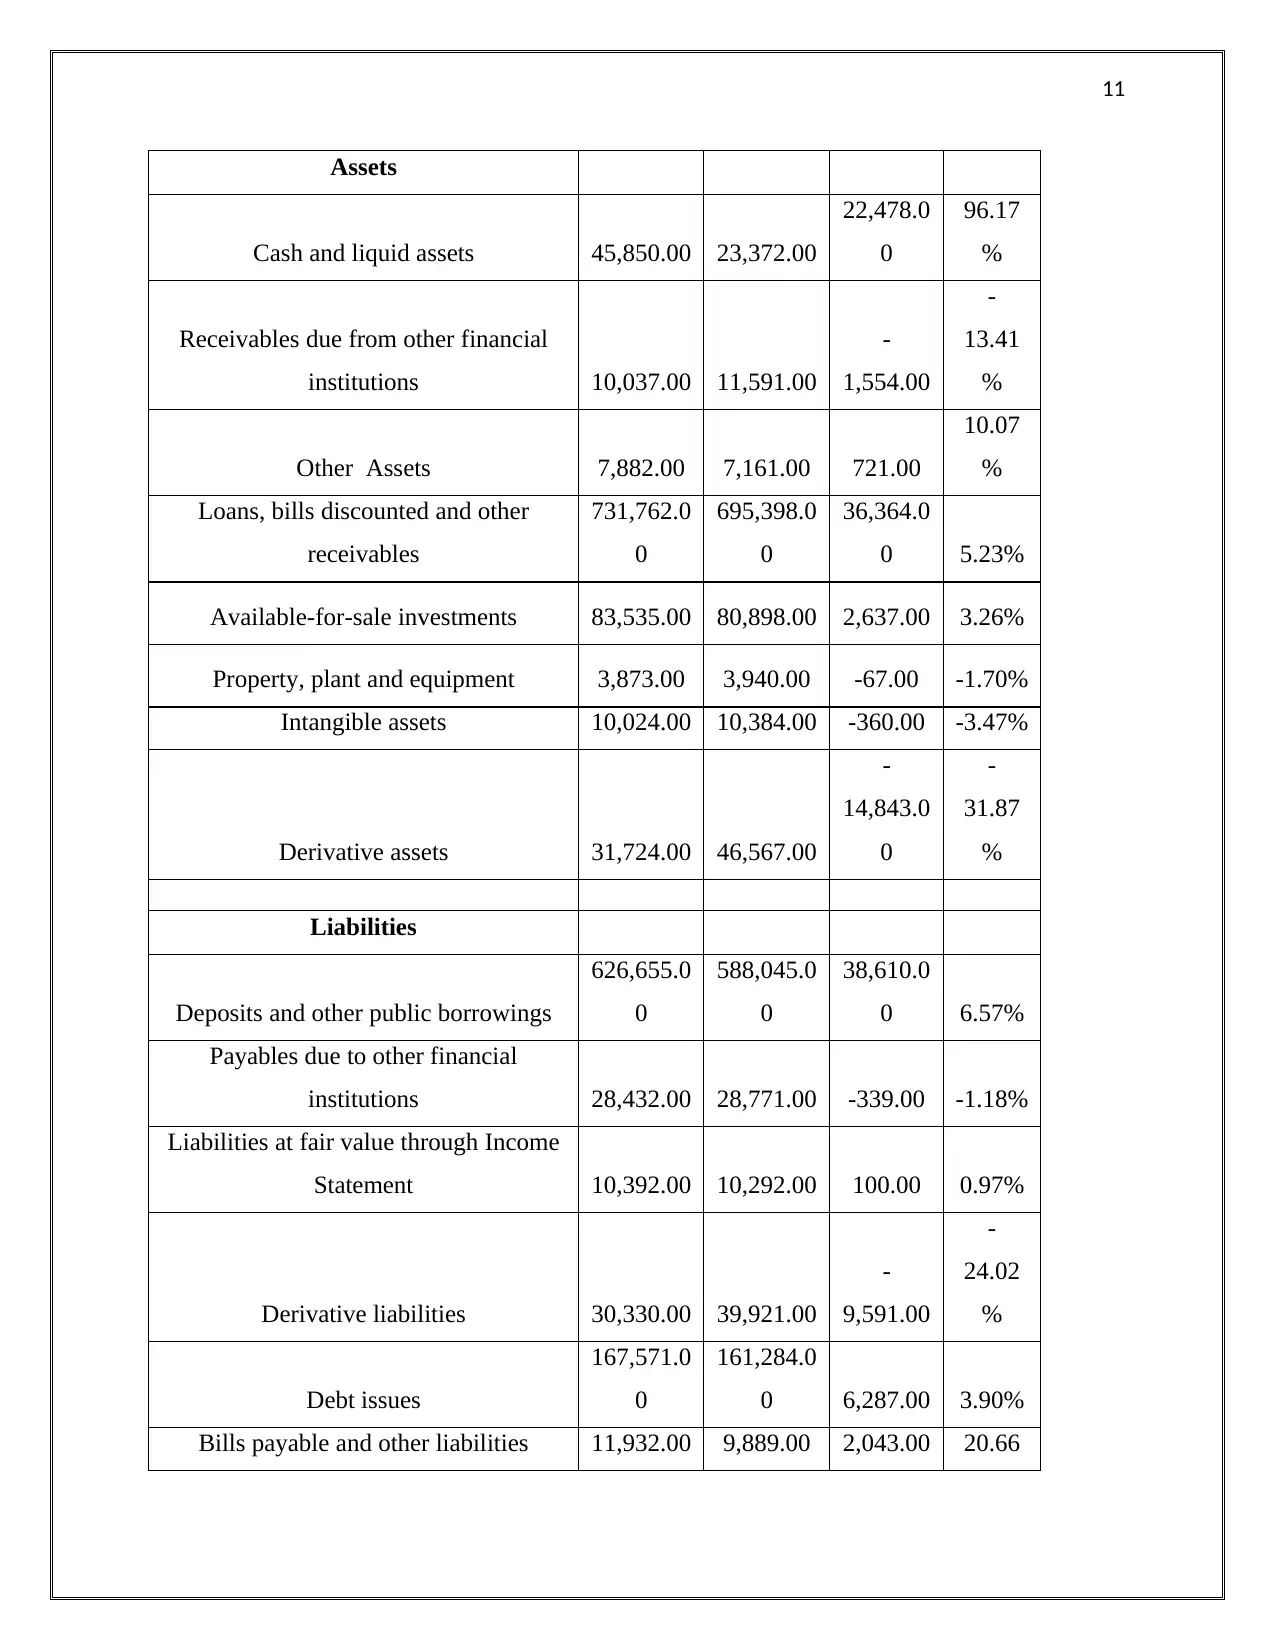
Assets
Cash and liquid assets 45,850.00 23,372.00
22,478.0
0
96.17
%
Receivables due from other financial
institutions 10,037.00 11,591.00
-
1,554.00
-
13.41
%
Other Assets 7,882.00 7,161.00 721.00
10.07
%
Loans, bills discounted and other
receivables
731,762.0
0
695,398.0
0
36,364.0
0 5.23%
Available-for-sale investments 83,535.00 80,898.00 2,637.00 3.26%
Property, plant and equipment 3,873.00 3,940.00 -67.00 -1.70%
Intangible assets 10,024.00 10,384.00 -360.00 -3.47%
Derivative assets 31,724.00 46,567.00
-
14,843.0
0
-
31.87
%
Liabilities
Deposits and other public borrowings
626,655.0
0
588,045.0
0
38,610.0
0 6.57%
Payables due to other financial
institutions 28,432.00 28,771.00 -339.00 -1.18%
Liabilities at fair value through Income
Statement 10,392.00 10,292.00 100.00 0.97%
Derivative liabilities 30,330.00 39,921.00
-
9,591.00
-
24.02
%
Debt issues
167,571.0
0
161,284.0
0 6,287.00 3.90%
Bills payable and other liabilities 11,932.00 9,889.00 2,043.00 20.66
12
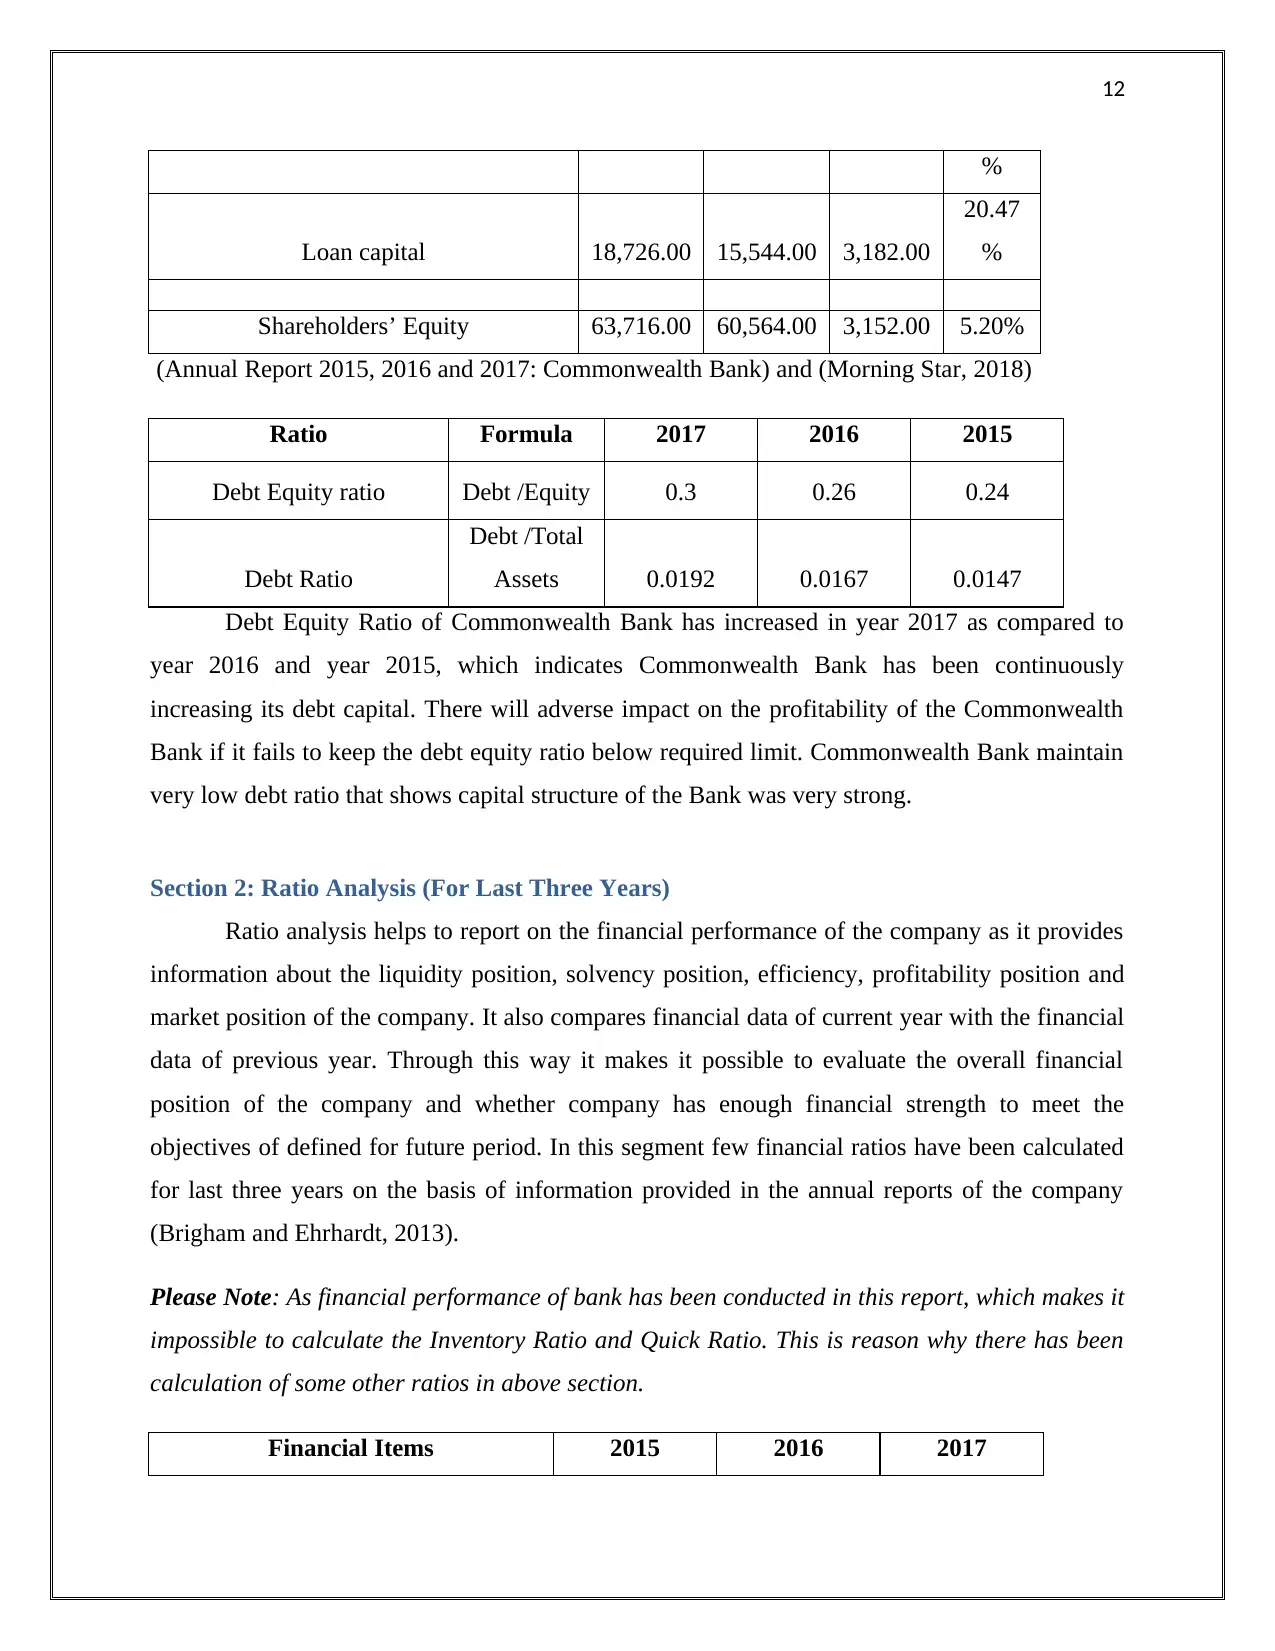
%
Loan capital 18,726.00 15,544.00 3,182.00
20.47
%
Shareholders’ Equity 63,716.00 60,564.00 3,152.00 5.20%
(Annual Report 2015, 2016 and 2017: Commonwealth Bank) and (Morning Star, 2018)
Ratio Formula 2017 2016 2015
Debt Equity ratio Debt /Equity 0.3 0.26 0.24
Debt Ratio
Debt /Total
Assets 0.0192 0.0167 0.0147
Debt Equity Ratio of Commonwealth Bank has increased in year 2017 as compared to
year 2016 and year 2015, which indicates Commonwealth Bank has been continuously
increasing its debt capital. There will adverse impact on the profitability of the Commonwealth
Bank if it fails to keep the debt equity ratio below required limit. Commonwealth Bank maintain
very low debt ratio that shows capital structure of the Bank was very strong.
Section 2: Ratio Analysis (For Last Three Years)
Ratio analysis helps to report on the financial performance of the company as it provides
information about the liquidity position, solvency position, efficiency, profitability position and
market position of the company. It also compares financial data of current year with the financial
data of previous year. Through this way it makes it possible to evaluate the overall financial
position of the company and whether company has enough financial strength to meet the
objectives of defined for future period. In this segment few financial ratios have been calculated
for last three years on the basis of information provided in the annual reports of the company
(Brigham and Ehrhardt, 2013).
Please Note: As financial performance of bank has been conducted in this report, which makes it
impossible to calculate the Inventory Ratio and Quick Ratio. This is reason why there has been
calculation of some other ratios in above section.
Financial Items 2015 2016 2017
%
Loan capital 18,726.00 15,544.00 3,182.00
20.47
%
Shareholders’ Equity 63,716.00 60,564.00 3,152.00 5.20%
(Annual Report 2015, 2016 and 2017: Commonwealth Bank) and (Morning Star, 2018)
Ratio Formula 2017 2016 2015
Debt Equity ratio Debt /Equity 0.3 0.26 0.24
Debt Ratio
Debt /Total
Assets 0.0192 0.0167 0.0147
Debt Equity Ratio of Commonwealth Bank has increased in year 2017 as compared to
year 2016 and year 2015, which indicates Commonwealth Bank has been continuously
increasing its debt capital. There will adverse impact on the profitability of the Commonwealth
Bank if it fails to keep the debt equity ratio below required limit. Commonwealth Bank maintain
very low debt ratio that shows capital structure of the Bank was very strong.
Section 2: Ratio Analysis (For Last Three Years)
Ratio analysis helps to report on the financial performance of the company as it provides
information about the liquidity position, solvency position, efficiency, profitability position and
market position of the company. It also compares financial data of current year with the financial
data of previous year. Through this way it makes it possible to evaluate the overall financial
position of the company and whether company has enough financial strength to meet the
objectives of defined for future period. In this segment few financial ratios have been calculated
for last three years on the basis of information provided in the annual reports of the company
(Brigham and Ehrhardt, 2013).
Please Note: As financial performance of bank has been conducted in this report, which makes it
impossible to calculate the Inventory Ratio and Quick Ratio. This is reason why there has been
calculation of some other ratios in above section.
Financial Items 2015 2016 2017
⊘ This is a preview!⊘
Do you want full access?
Subscribe today to unlock all pages.
Trusted by 1+ million students worldwide
1 out of 18
Related Documents


Your All-in-One AI-Powered Toolkit for Academic Success.
+13062052269
info@desklib.com
Available 24*7 on WhatsApp / Email
![[object Object]](/_next/static/media/star-bottom.7253800d.svg)
Unlock your academic potential
Copyright © 2020–2026 A2Z Services. All Rights Reserved. Developed and managed by ZUCOL.