HI5002 Finance for Business - CBA Company Performance Analysis Report
VerifiedAdded on 2022/12/30
|14
|4134
|64
Report
AI Summary
This assignment analyzes the financial performance of the Commonwealth Bank (CBA), focusing on its key products and services, with an emphasis on mobile banking as a primary service. The report delves into the bank's liquidity and capital structure, examining financial ratios such as the loan-to-deposit ratio, debt-to-equity ratio, and debt ratio over a three-year period. It assesses the bank's non-current assets, including property, plant, and equipment, and the depreciation method used. Furthermore, the report conducts a scenario analysis, evaluating the net present value (NPV) under normal, worst-case, and best-case scenarios to understand the sensitivity of the investment. Finally, the assignment analyzes the bank's share price performance using the price-to-earnings (PE) ratio and stock movement, culminating in a recommendation letter to a client, justifying the inclusion of CBA in their investment portfolio. The analysis highlights both the strengths and weaknesses of CBA's financial position and provides insights into its future sustainability and potential for growth.

Running head: FINANCE FOR BUSINESS - MASTERS
Finance for business – masters
Name of the student
Name of the university
Student ID
Author note
Finance for business – masters
Name of the student
Name of the university
Student ID
Author note
Paraphrase This Document
Need a fresh take? Get an instant paraphrase of this document with our AI Paraphraser
1FINANCE FOR BUSINESS - MASTERS
Table of Contents
Abstract.......................................................................................................................................2
I. Introduction...........................................................................................................................3
II. Financial analysis of Commonwealth Bank.........................................................................3
2.1 Description of key product or service................................................................................3
2.2 Calculation and analysis of the selected performance ratios...........................................3
2.3 Analysis of non-current asset............................................................................................5
2.4 Scenario analysis..............................................................................................................6
2.5 Issuance of bonds or shares.............................................................................................8
2.6 PE ratio and share price movement..................................................................................9
III. Recommendation letter...................................................................................................10
IV. Conclusion......................................................................................................................11
Reference..................................................................................................................................12
2FINANCE FOR BUSINESS - MASTERS
Abstract
The task portrays the main issues associated with Commonwealth Bank, its financial
performance from different aspects, acceptability of new project under different scenarios and
its share price movements. Among others, the key service provided by the bank is the mobile
banking as it is the 1st one that became successful in implementing the fully functional mobile
banking services. Regarding liquidity position it is found that the loan deposit ratio has been
reduced from 126.67% to 119.61% over the 3 years period. The capital structure of the bank
shows that significantly high level of debt that may raise question on its future sustainability.
During the last year the bank did not issue any shares, however covered bond issued by it
amounting to $555 million. Further, though the net profit of the bank is in reducing trend over
the past 3 years, the PE ratio and share price have been improved during the same period.
⊘ This is a preview!⊘
Do you want full access?
Subscribe today to unlock all pages.
Trusted by 1+ million students worldwide
3FINANCE FOR BUSINESS - MASTERS
I. Introduction
Purpose of the assignment is to analyse the financial performance of any ASX listed
company that will be Commonwealth Bank Australia (CBA) for this assignment.
Commonwealth Bank was established under Commonwealth Bank Act during the year 1911
and it started operating during the year 1912. It was empowered to conduct the savings as
well as general business related to banking. At present the bank has 52,000 employees and
800,000 shareholders. It offers wide range of services for assisting the Australians to build as
well as manage the finances. Objective of the bank is becoming the finest organization in
Australia providing financial services through excelling the customer’s services as well as
strategies of the bank for recognising significant opportunities within business. It will further
help in developing more value for the people, stakeholders and people (Commbank.com.au
2019). The task will depict the key product or services offered by the entity and importance of
those products or services. In the next section the report will comment upon its capital
structure as well as liquidity position taking into account the financial data provided through its
annual report for last 3 years. Next, the report will conduct the analysis of non-current assets
along with the method of depreciation used by the bank. In the next section it will conduct
scenario analysis for the situation provided and will comment upon the normal case, worst
case and best case analysis that will help in understanding the sensitivity of NPV. The report
will also highlight and comment upon the performance of its share price through its PE ratio
and stock movement. Based on all these facts the report will provide the recommendation
letter to the client that will provide the explanation regarding why the entity shall be included in
his / her portfolio.
II. Financial analysis of Commonwealth Bank
2.1 Description of key product or service
Different products and services related to business banking are offered by CBA those
include business accounts, merchant services, business loans, superannuation, asset
finance, investment, insurance and investments. However, the key service provided by the
bank among others is the mobile banking. Though implantation of the mobile technology was
not the new approach for the Australian customers, CBA is 1st one that became successful in
implementing the fully functional mobile banking services through offering free application for
different mobiles along with iPhone (Revelli and Viviani 2015). Its competitors like Westpac
and ANZ also implemented the mobile banking even before CBA, however, it was only limited
to iPhone to be functioned it fully. Since, its 1st implementation of the services related to
mobile banking, CBA is managing as well as maintaining the same on continuous basis
through making the service more convenient as well as efficient for any of the mobile where
internet can be used. Further, it simplified the lives of number of customers and offers them
the eservices related to transfer of money, paying bills, checking the account balances
through using the mobile phones (Commbank.com.au 2019).
2.2 Calculation and analysis of the selected performance ratios
Liquidity ratio – liquidity ratios helps to determine the ability of the company whether it is
able to meet its short term debt obligation with available short term assets. Analysis of
liquidity position plays important role to the potential investors as it says lot about the
company’s existing obligation and future prospects. Deposit funding ratio or loans to deposit
ratio is used in case of banks for measuring through comparing total loans of a bank with its
Paraphrase This Document
Need a fresh take? Get an instant paraphrase of this document with our AI Paraphraser

4FINANCE FOR BUSINESS - MASTERS
total deposits over the same period of time. It is computed through dividing the total loan
amount by total deposit amounts and is expressed in percentage form and the percentage of
more than 100% signifies that the bank is earning sufficient amount to cover up its liabilities
(Ahmed 2015).
Liability ratio 2019 2018 2017
Deposit funding ratio/Loan deposit ratio
Current assets/current liabilities
119.61
%
120.44
%
126.67
%
2019 2018 2017
116.00%
118.00%
120.00%
122.00%
124.00%
126.00%
128.00%
Deposit funding ratio
The above presented table and graph represents the percentage and trends of deposit
funding ratio over the 3 years period covering the year 2017, 2018 and 2019. It is signifying
that the bank’s ability to receive deposits against providing loans has been deteriorated. It can
be established through the finding that the same has been reduced from 126.67% to 119.61%
over the 3 years period. It means for each dollar of loan the bank was receiving $1.26 in 2017
whereas in 2019 it is receiving $1.19 of deposits for each $ 1 of loans. The decreasing trend
is also signifying that the bank will not have considerable amount of available reserves for
unforseen as well as expected contingencies (Robinson et al. 2015).
Capital structure ratio – these are also known as leverage ratios and are defined as the
financial ratio that is used for measuring the entity’s long-term stability as well as its structure.
These ratios further signify that mix of the funds used by the entity including the amount
funded by the owners and he amount funded by the lenders for requirements of the
company’s operation. Different capital structure ratios those can be used to analyse the
entity’s capital structure are debt equity ratio and debt ratio (Alexakis et al. 2019).
Capital structure ratio 2019 2018 2017
Debt equity ratio 13.02 13.37 14.34
Debt ratio 0.93 0.93 0.93
5FINANCE FOR BUSINESS - MASTERS
2019 2018 2017
0.00
2.00
4.00
6.00
8.00
10.00
12.00
14.00
16.00
Capital structure ratio
Debt equity
ratio
Debt ratio
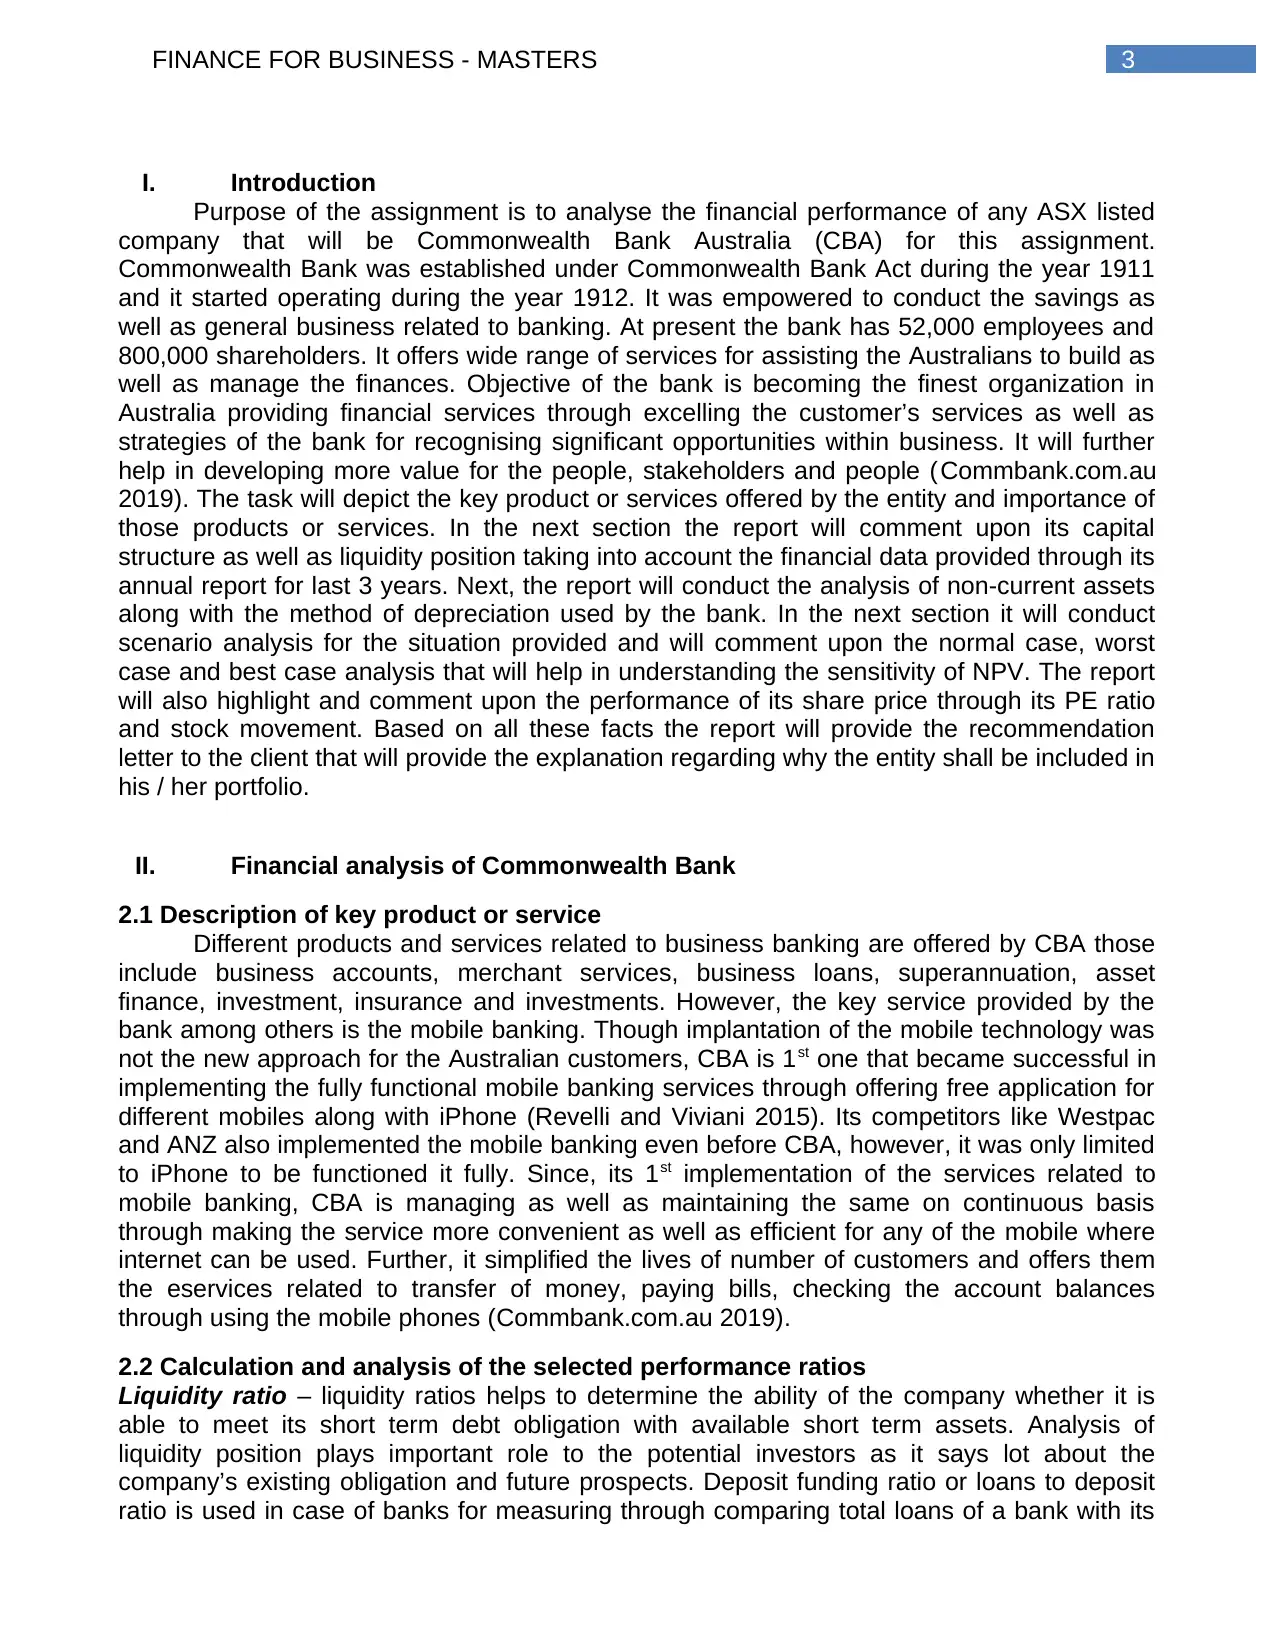
Debt equity ratio – this ratio is also known as the gearing ratio or risk ratio and is a capital
structure or leverage ratio. It is used for computing the weights of financial obligations
including total debt as compared to total equity. It further highlights the way in which the entity
structures its capital that is whether it is tilted towards equity or debt (Omar et al. 2014).
Though the debt to equity ratio varies from industry to industry, generally the same of 1 to 1.5
is considered as ideal. From the above it can be identified that though the bank was able to
reduce its debt equity ratio from 14.34 times to 13.02 times over the period of past 3 years,
the debt portion is significantly high as against equity. High level of debt equity ratio signifies
that the bank is overburdened with the debt and significant amount is spent towards payment
of interest and any further loss will lead to insolvency (Commbank.com.au 2019).
Debt ratio – it is used to measure the portion of assets paid with the debt. This ratio helps in
measuring the solvency of the bank. Though the debt ratio varies from industry to industry,
generally lower level of debt ratio that is 0.4 or lower is preferred if the cash flows of the bank
are subject to unpredictable variation as the same will lead to unserviceable debt. From the
above it can be identified that the bank’s debt ratio has not been changed much and
remained at 0.93 over the period of past 3 years, the debt used for acquiring assets is
significantly high (Wagner et al. 2015).
Hence, if the overall liquidity and capital structure of the bank is considered it can be
determined that liquidity position of the company over the past 3 years has been deteriorated.
Further, the capital structure of the bank includes significantly high level of debt that may raise
question on its future sustainability.
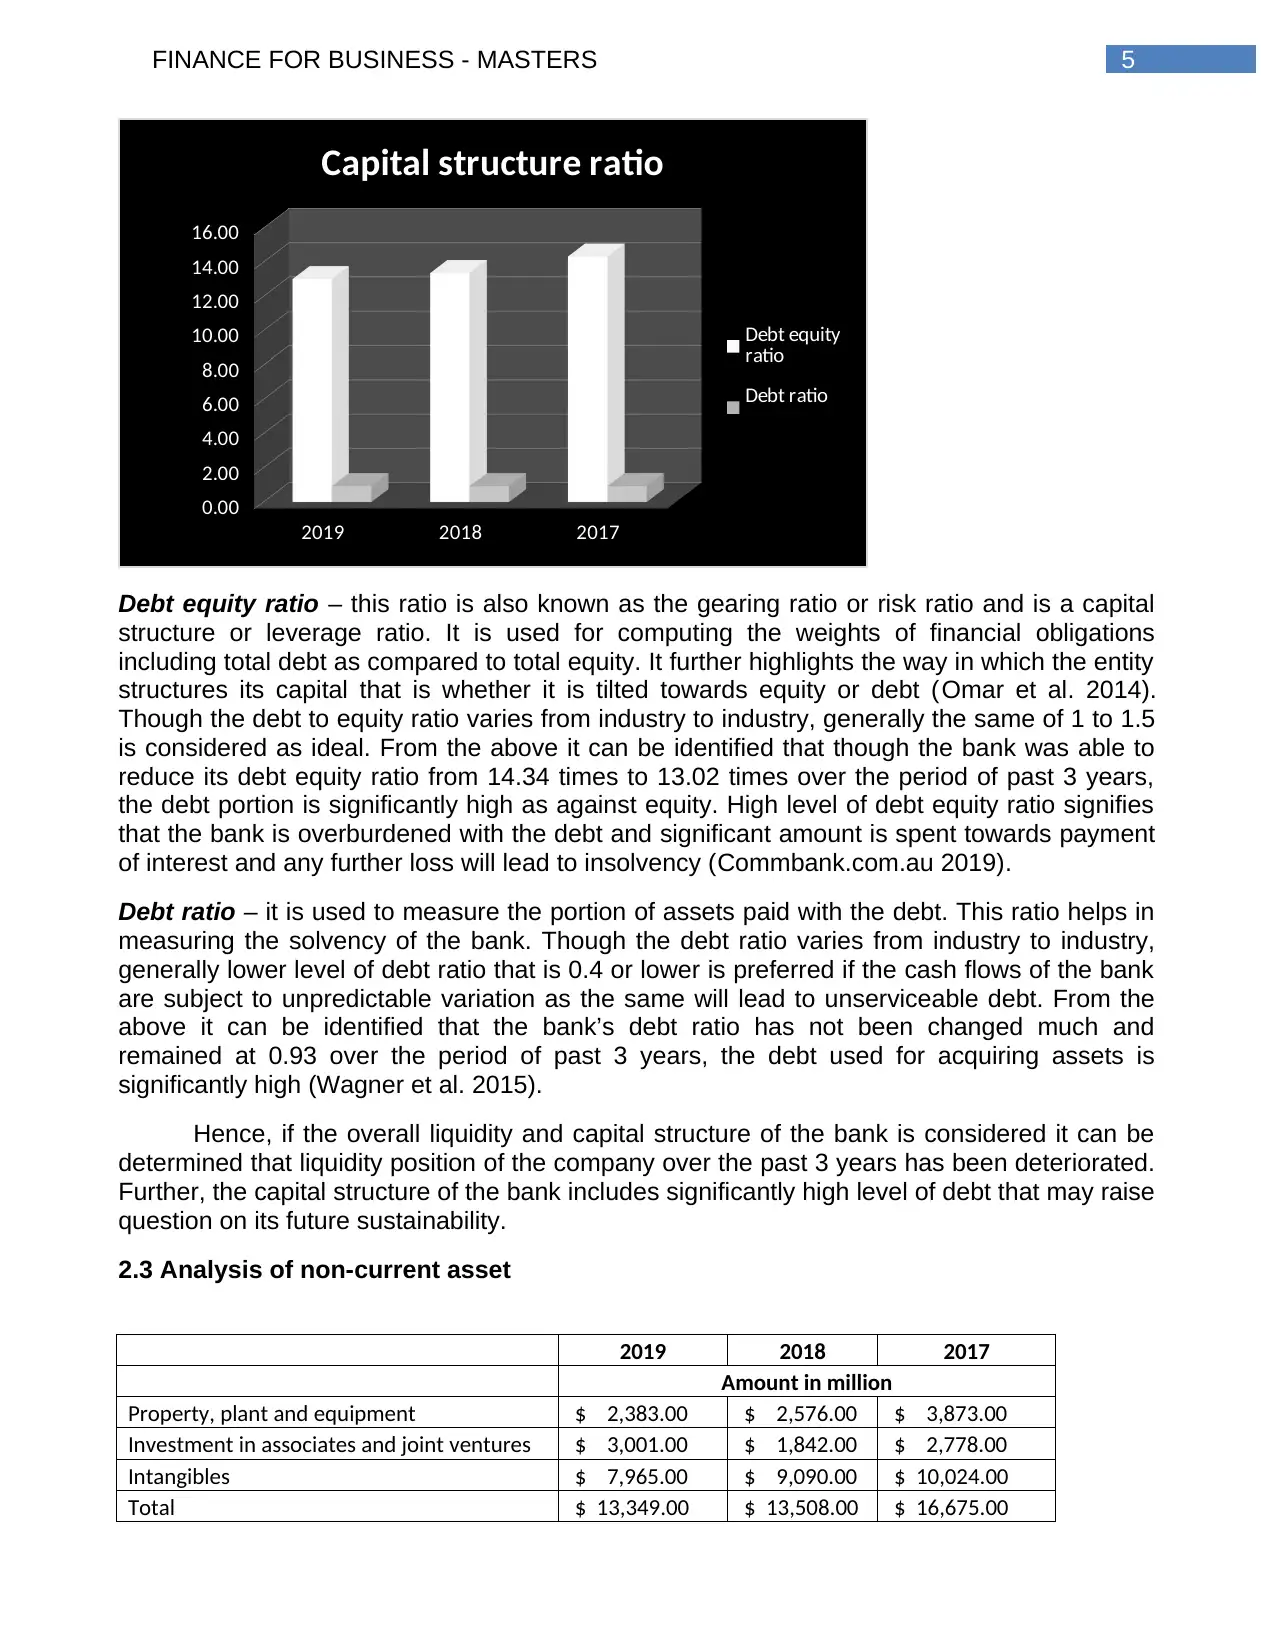
2.3 Analysis of non-current asset
2019 2018 2017
Amount in million
Property, plant and equipment $ 2,383.00 $ 2,576.00 $ 3,873.00
Investment in associates and joint ventures $ 3,001.00 $ 1,842.00 $ 2,778.00
Intangibles $ 7,965.00 $ 9,090.00 $ 10,024.00
Total $ 13,349.00 $ 13,508.00 $ 16,675.00
2019 2018 2017
0.00
2.00
4.00
6.00
8.00
10.00
12.00
14.00
16.00
Capital structure ratio
Debt equity
ratio
Debt ratio
Debt equity ratio – this ratio is also known as the gearing ratio or risk ratio and is a capital
structure or leverage ratio. It is used for computing the weights of financial obligations
including total debt as compared to total equity. It further highlights the way in which the entity
structures its capital that is whether it is tilted towards equity or debt (Omar et al. 2014).
Though the debt to equity ratio varies from industry to industry, generally the same of 1 to 1.5
is considered as ideal. From the above it can be identified that though the bank was able to
reduce its debt equity ratio from 14.34 times to 13.02 times over the period of past 3 years,
the debt portion is significantly high as against equity. High level of debt equity ratio signifies
that the bank is overburdened with the debt and significant amount is spent towards payment
of interest and any further loss will lead to insolvency (Commbank.com.au 2019).
Debt ratio – it is used to measure the portion of assets paid with the debt. This ratio helps in
measuring the solvency of the bank. Though the debt ratio varies from industry to industry,
generally lower level of debt ratio that is 0.4 or lower is preferred if the cash flows of the bank
are subject to unpredictable variation as the same will lead to unserviceable debt. From the
above it can be identified that the bank’s debt ratio has not been changed much and
remained at 0.93 over the period of past 3 years, the debt used for acquiring assets is
significantly high (Wagner et al. 2015).
Hence, if the overall liquidity and capital structure of the bank is considered it can be
determined that liquidity position of the company over the past 3 years has been deteriorated.
Further, the capital structure of the bank includes significantly high level of debt that may raise
question on its future sustainability.
2.3 Analysis of non-current asset
2019 2018 2017
Amount in million
Property, plant and equipment $ 2,383.00 $ 2,576.00 $ 3,873.00
Investment in associates and joint ventures $ 3,001.00 $ 1,842.00 $ 2,778.00
Intangibles $ 7,965.00 $ 9,090.00 $ 10,024.00
Total $ 13,349.00 $ 13,508.00 $ 16,675.00
⊘ This is a preview!⊘
Do you want full access?
Subscribe today to unlock all pages.
Trusted by 1+ million students worldwide
6FINANCE FOR BUSINESS - MASTERS
Above table presents the schedule of the bank’s non-current assets that portrays that
the amount invested in non-current assets have been reduced over the past period of 3 years.
However, amount of total assets have been increased over the same period that is indicating
that the bank is shifting towards investment in current assets rather than non-current assets.
Though the company purchased some property, plant and equipment (PPE) during the
concerned period amount of PPE sold is more as compared to amount of PPE purchased by
it. Hence, the amount of PPE reduced from $3873 million to $2383 million over the concerned
period. The company used straight line method for depreciating PPE. Hence, the value of
PPE is uniformly reduced over their useful life till it reaches the salvage value (Gamayuni
2015).
Operating cash flow is the section represented under the cash flow statement that
delivers information of the entity’s ability to generate cash from the core activities of the entity.
Generally the operating cash flow is computed as per the below mentioned formula –
Operating cash flow = Net income + non-cash expenses + changes in the working capital.
Non-cash expenses include the expenses like depreciation or amortization expenses
represented under the income statement of the organization. While computing the cash flow
of a long term project depreciation is deducted while computing the project’s income.
However, at the time of computing the cash flow the depreciation expenses is added back as
the same is non-cash expenses. Further, while computing the capex the depreciation
expenses is added to the difference of current PPE and previous PPE. This is analysed while
purchasing long term asset as the same are not shown under income statement but have
significant impact on the cash flows (Huang and Kou 2014).
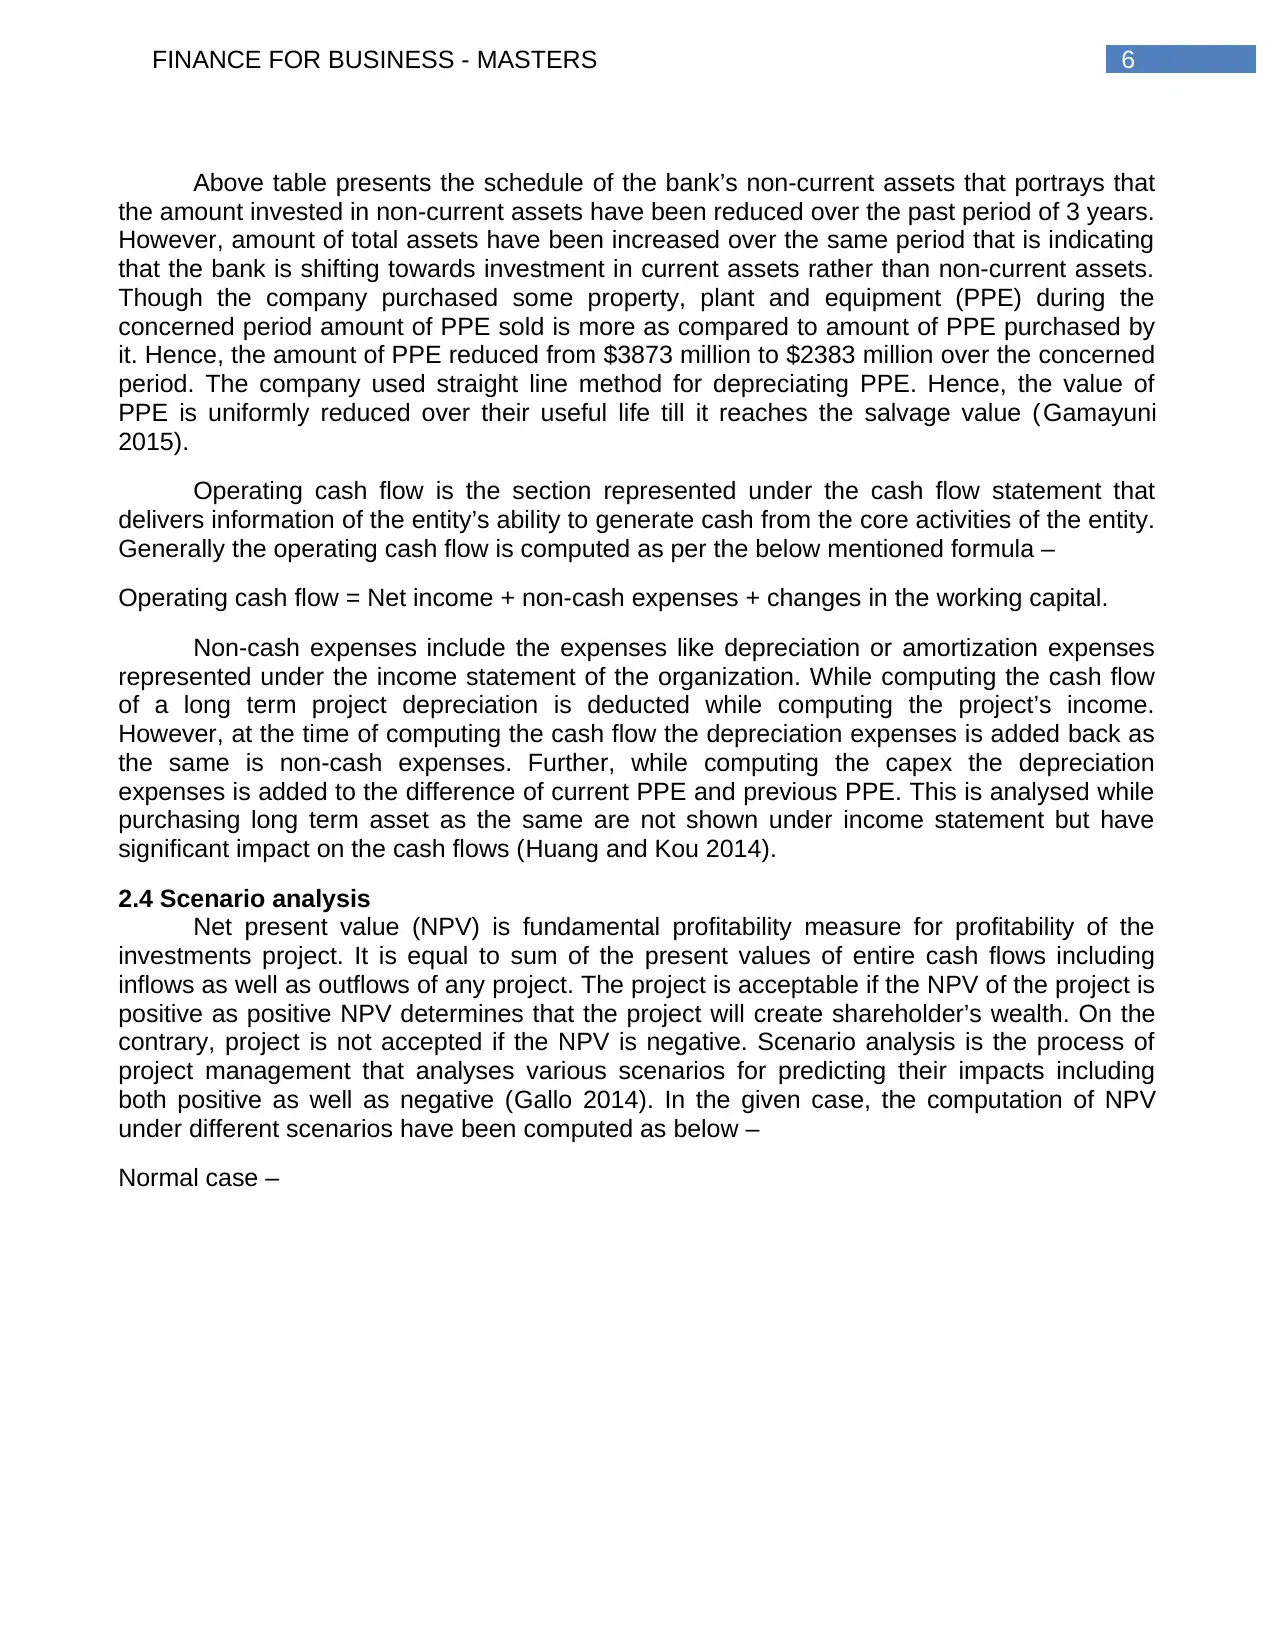
2.4 Scenario analysis
Net present value (NPV) is fundamental profitability measure for profitability of the
investments project. It is equal to sum of the present values of entire cash flows including
inflows as well as outflows of any project. The project is acceptable if the NPV of the project is
positive as positive NPV determines that the project will create shareholder’s wealth. On the
contrary, project is not accepted if the NPV is negative. Scenario analysis is the process of
project management that analyses various scenarios for predicting their impacts including
both positive as well as negative (Gallo 2014). In the given case, the computation of NPV
under different scenarios have been computed as below –
Normal case –
Above table presents the schedule of the bank’s non-current assets that portrays that
the amount invested in non-current assets have been reduced over the past period of 3 years.
However, amount of total assets have been increased over the same period that is indicating
that the bank is shifting towards investment in current assets rather than non-current assets.
Though the company purchased some property, plant and equipment (PPE) during the
concerned period amount of PPE sold is more as compared to amount of PPE purchased by
it. Hence, the amount of PPE reduced from $3873 million to $2383 million over the concerned
period. The company used straight line method for depreciating PPE. Hence, the value of
PPE is uniformly reduced over their useful life till it reaches the salvage value (Gamayuni
2015).
Operating cash flow is the section represented under the cash flow statement that
delivers information of the entity’s ability to generate cash from the core activities of the entity.
Generally the operating cash flow is computed as per the below mentioned formula –
Operating cash flow = Net income + non-cash expenses + changes in the working capital.
Non-cash expenses include the expenses like depreciation or amortization expenses
represented under the income statement of the organization. While computing the cash flow
of a long term project depreciation is deducted while computing the project’s income.
However, at the time of computing the cash flow the depreciation expenses is added back as
the same is non-cash expenses. Further, while computing the capex the depreciation
expenses is added to the difference of current PPE and previous PPE. This is analysed while
purchasing long term asset as the same are not shown under income statement but have
significant impact on the cash flows (Huang and Kou 2014).
2.4 Scenario analysis
Net present value (NPV) is fundamental profitability measure for profitability of the
investments project. It is equal to sum of the present values of entire cash flows including
inflows as well as outflows of any project. The project is acceptable if the NPV of the project is
positive as positive NPV determines that the project will create shareholder’s wealth. On the
contrary, project is not accepted if the NPV is negative. Scenario analysis is the process of
project management that analyses various scenarios for predicting their impacts including
both positive as well as negative (Gallo 2014). In the given case, the computation of NPV
under different scenarios have been computed as below –
Normal case –
Paraphrase This Document
Need a fresh take? Get an instant paraphrase of this document with our AI Paraphraser
7FINANCE FOR BUSINESS - MASTERS
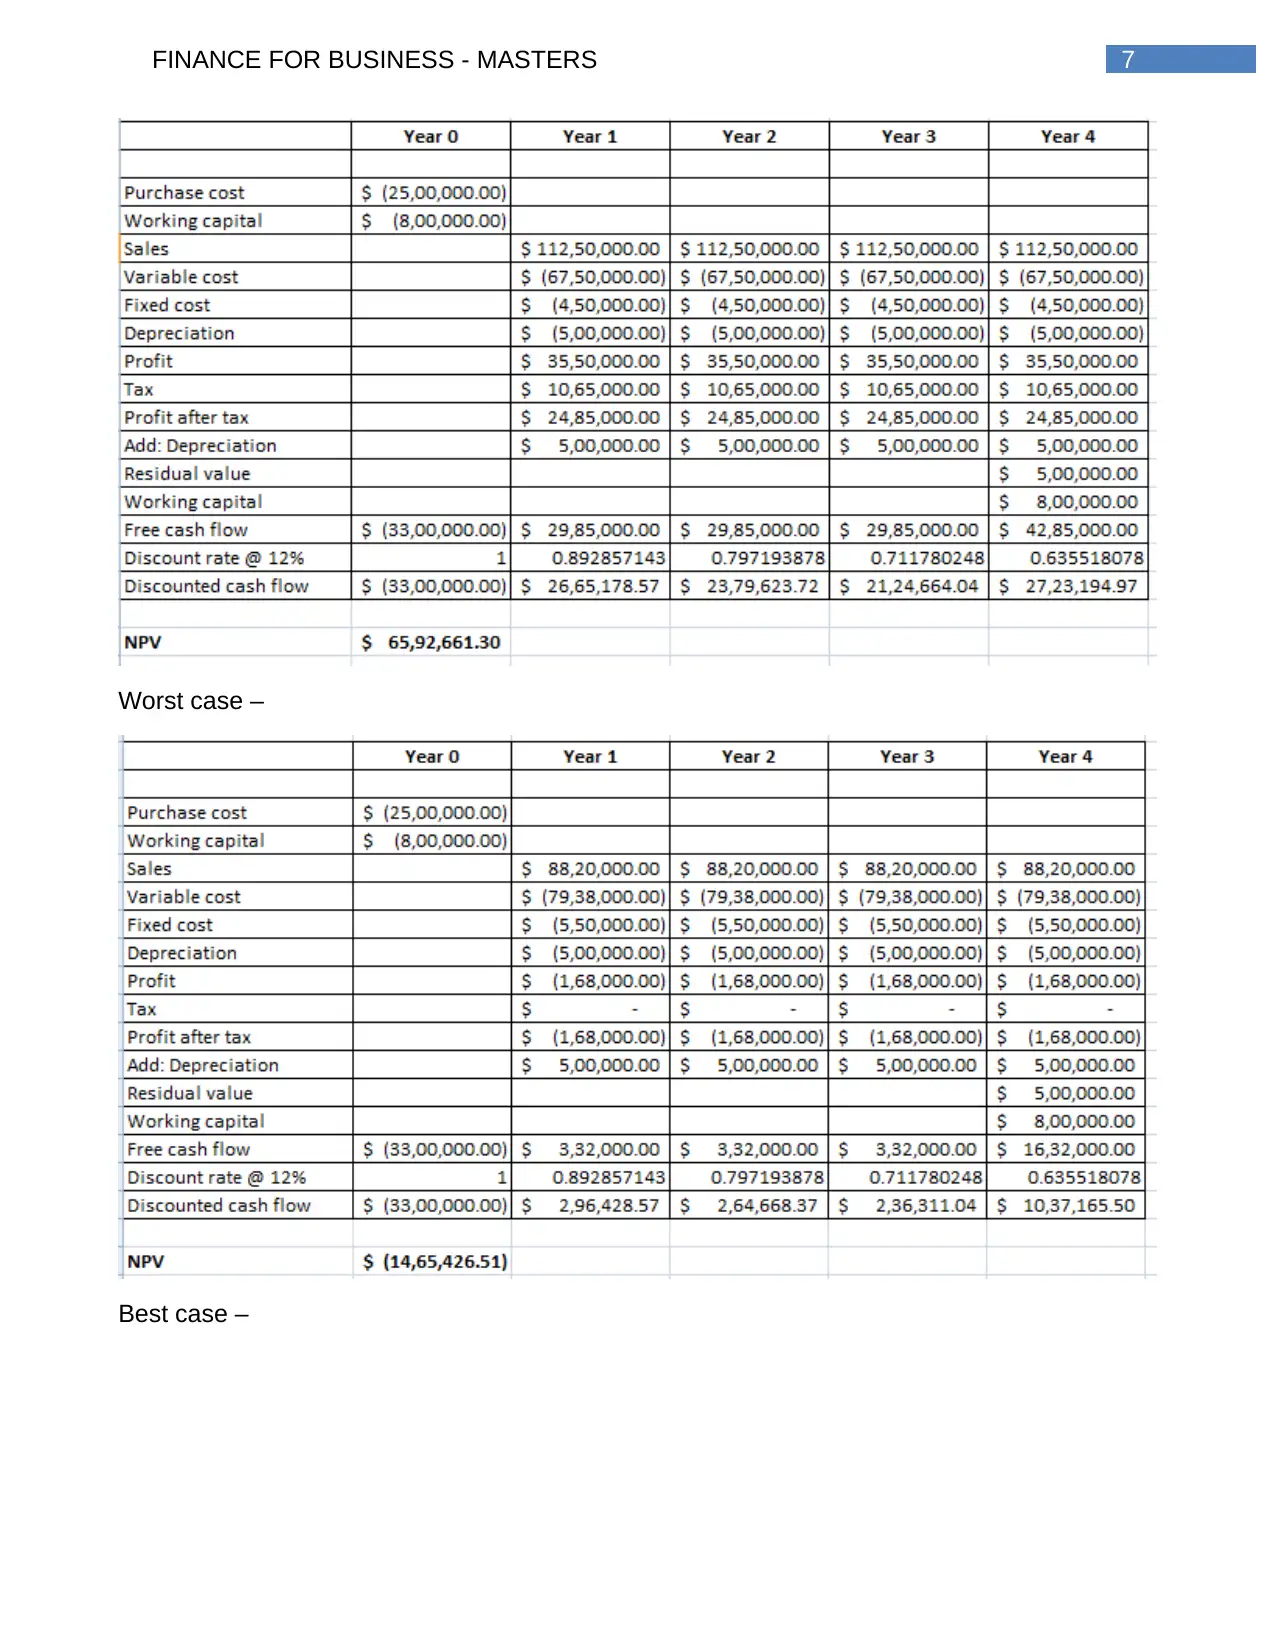
Worst case –
Best case –
Worst case –
Best case –
8FINANCE FOR BUSINESS - MASTERS
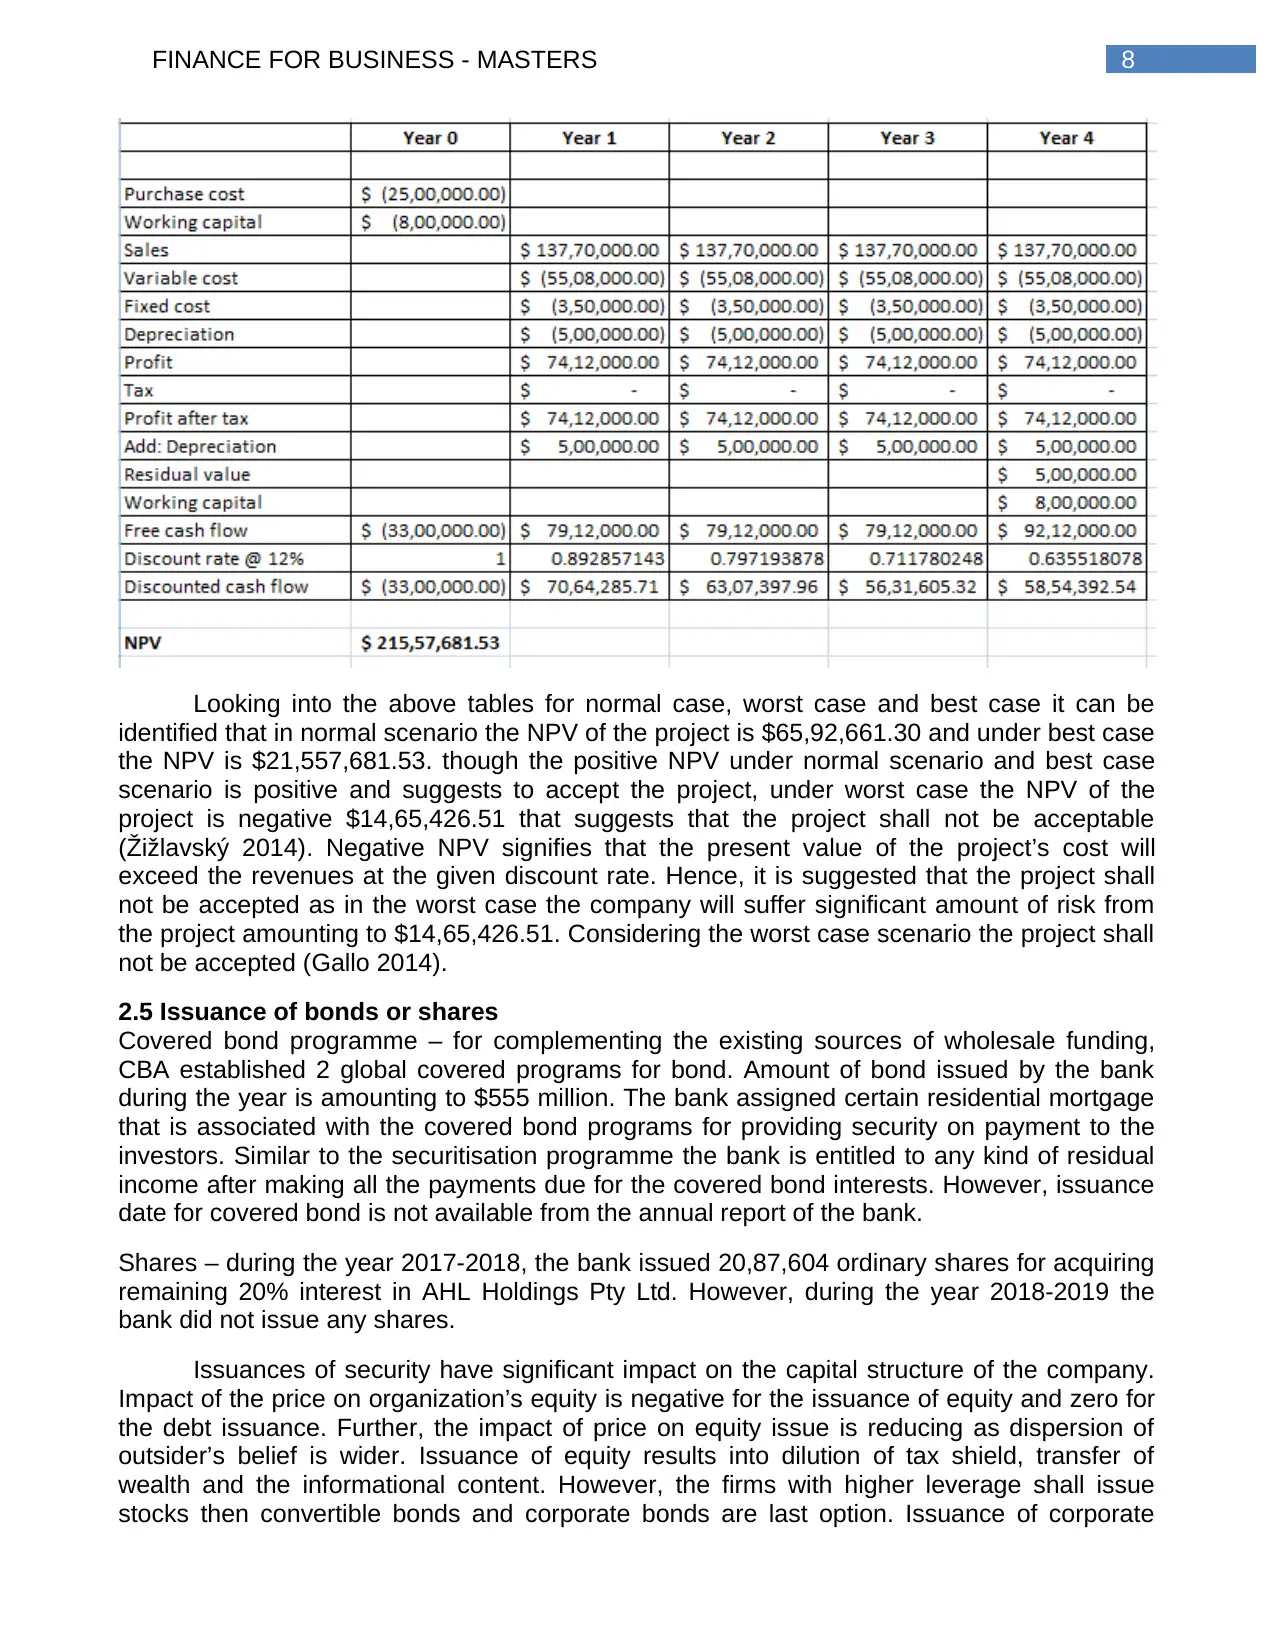
Looking into the above tables for normal case, worst case and best case it can be
identified that in normal scenario the NPV of the project is $65,92,661.30 and under best case
the NPV is $21,557,681.53. though the positive NPV under normal scenario and best case
scenario is positive and suggests to accept the project, under worst case the NPV of the
project is negative $14,65,426.51 that suggests that the project shall not be acceptable
(Žižlavský 2014). Negative NPV signifies that the present value of the project’s cost will
exceed the revenues at the given discount rate. Hence, it is suggested that the project shall
not be accepted as in the worst case the company will suffer significant amount of risk from
the project amounting to $14,65,426.51. Considering the worst case scenario the project shall
not be accepted (Gallo 2014).
2.5 Issuance of bonds or shares
Covered bond programme – for complementing the existing sources of wholesale funding,
CBA established 2 global covered programs for bond. Amount of bond issued by the bank
during the year is amounting to $555 million. The bank assigned certain residential mortgage
that is associated with the covered bond programs for providing security on payment to the
investors. Similar to the securitisation programme the bank is entitled to any kind of residual
income after making all the payments due for the covered bond interests. However, issuance
date for covered bond is not available from the annual report of the bank.
Shares – during the year 2017-2018, the bank issued 20,87,604 ordinary shares for acquiring
remaining 20% interest in AHL Holdings Pty Ltd. However, during the year 2018-2019 the
bank did not issue any shares.
Issuances of security have significant impact on the capital structure of the company.
Impact of the price on organization’s equity is negative for the issuance of equity and zero for
the debt issuance. Further, the impact of price on equity issue is reducing as dispersion of
outsider’s belief is wider. Issuance of equity results into dilution of tax shield, transfer of
wealth and the informational content. However, the firms with higher leverage shall issue
stocks then convertible bonds and corporate bonds are last option. Issuance of corporate
⊘ This is a preview!⊘
Do you want full access?
Subscribe today to unlock all pages.
Trusted by 1+ million students worldwide
9FINANCE FOR BUSINESS - MASTERS
bonds have negative impact on the price earnings, however, the impact reduces over the long
term period. However, on short term period no significant impact is there on yield if corporate
bonds are issued (Karna, Richter and Riesenkampff 2016).
2.6 PE ratio and share price movement
Net profit –
2019 2018 2017
Net profit (in millions) $ 8,571.00 $ 9,329.00 $ 9,928.00
Net profit signifies the bank’s ability to generate profit from the revenues for its
shareholders after making payment for all the expenses. It reflects the financial health and
hence, the investors can analyse the profit trend before taking investment related decisions.
From the above it can be identified that the profit for the concerned period are in reducing
trend and dropped to $8571 million in 2019 from $9928 million in 2017. Major reason behind
the drop in net profit is the bank laid out additional $1 billion for compensating the customers
it ripped off. Further, the drop in income was also driven by the higher costs of its different
businesses (Dokas, Giokas and Tsamis 2014).
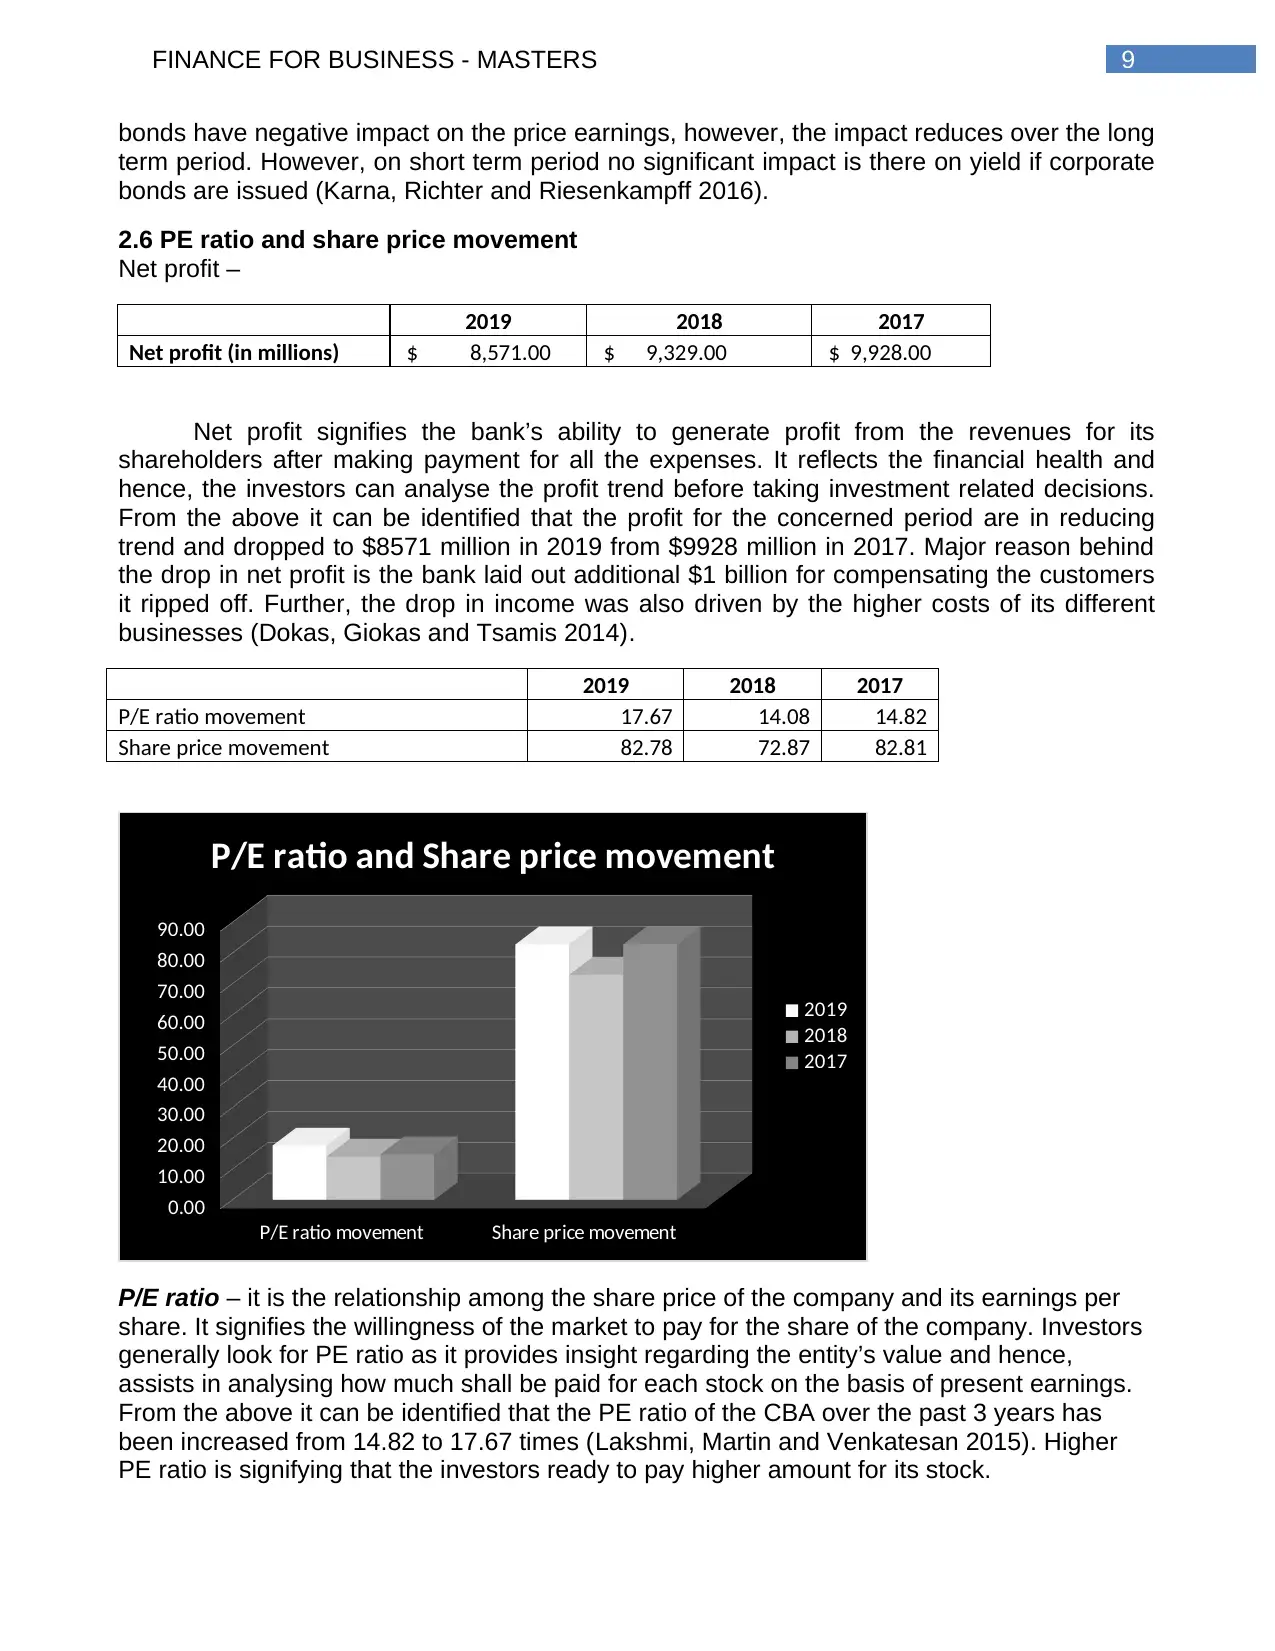
2019 2018 2017
P/E ratio movement 17.67 14.08 14.82
Share price movement 82.78 72.87 82.81
P/E ratio movement Share price movement
0.00
10.00
20.00
30.00
40.00
50.00
60.00
70.00
80.00
90.00
P/E ratio and Share price movement
2019
2018
2017
P/E ratio – it is the relationship among the share price of the company and its earnings per
share. It signifies the willingness of the market to pay for the share of the company. Investors
generally look for PE ratio as it provides insight regarding the entity’s value and hence,
assists in analysing how much shall be paid for each stock on the basis of present earnings.
From the above it can be identified that the PE ratio of the CBA over the past 3 years has
been increased from 14.82 to 17.67 times (Lakshmi, Martin and Venkatesan 2015). Higher
PE ratio is signifying that the investors ready to pay higher amount for its stock.
bonds have negative impact on the price earnings, however, the impact reduces over the long
term period. However, on short term period no significant impact is there on yield if corporate
bonds are issued (Karna, Richter and Riesenkampff 2016).
2.6 PE ratio and share price movement
Net profit –
2019 2018 2017
Net profit (in millions) $ 8,571.00 $ 9,329.00 $ 9,928.00
Net profit signifies the bank’s ability to generate profit from the revenues for its
shareholders after making payment for all the expenses. It reflects the financial health and
hence, the investors can analyse the profit trend before taking investment related decisions.
From the above it can be identified that the profit for the concerned period are in reducing
trend and dropped to $8571 million in 2019 from $9928 million in 2017. Major reason behind
the drop in net profit is the bank laid out additional $1 billion for compensating the customers
it ripped off. Further, the drop in income was also driven by the higher costs of its different
businesses (Dokas, Giokas and Tsamis 2014).
2019 2018 2017
P/E ratio movement 17.67 14.08 14.82
Share price movement 82.78 72.87 82.81
P/E ratio movement Share price movement
0.00
10.00
20.00
30.00
40.00
50.00
60.00
70.00
80.00
90.00
P/E ratio and Share price movement
2019
2018
2017
P/E ratio – it is the relationship among the share price of the company and its earnings per
share. It signifies the willingness of the market to pay for the share of the company. Investors
generally look for PE ratio as it provides insight regarding the entity’s value and hence,
assists in analysing how much shall be paid for each stock on the basis of present earnings.
From the above it can be identified that the PE ratio of the CBA over the past 3 years has
been increased from 14.82 to 17.67 times (Lakshmi, Martin and Venkatesan 2015). Higher
PE ratio is signifying that the investors ready to pay higher amount for its stock.
Paraphrase This Document
Need a fresh take? Get an instant paraphrase of this document with our AI Paraphraser
10FINANCE FOR BUSINESS - MASTERS
Share price movement – looking into the trend of share price movement over the last 3
years it is identified that though the net profit are in reducing trend, the share price went up to
$ 82.78 per share in 2019 from $ 72.87 per share in 2018 (Asx.com.au 2019). There are
differences between the trend of profit and share price as net profit drop as the bank laid out
additional $1 billion for compensating the customers it ripped off and excess expenses for
various businesses (Mayes 2014). However, the share price is increasing for last 6 months as
it followed the resolution of Hayne Royal Commission earlier 2019. The bank that was the
centre of different scandals start following the resolution of Hayne Royal Commission and
also pledged for shutting down one of its division that was most troubled that led to increase
of confidence among investors and hence, the share price went up (Asx.com.au 2019).
III. Recommendation letter
Andrew Johnson
Investment Solution Pty Ltd
231, Madison Avenue
Brisbane – 200 310
Date: 30th Aug 2019
Mr. John Taylor
299 Park Road,
Brisbane
Subject: Recommendation for investment portfolio
Dear Mr Taylor
This is to inform you I have completed the financial analysis of Commonwealth Bank taking
into consideration its performance over the past 3 years. Based on the analysis, I would like
to inform you that the net profit of the bank is in reducing trend however, the PE ratio and
share price have been improved. This denotes that even if the profit reduced, it is just the
temporary phase and the investors are ready to pay higher amount for each stock of the
bank. If the liquidity position is considered, it can be stated that the same is indicating that the
company is able to meet its liability efficiently. Though the bank has higher level of debt, it has
improved its leverage position over the last 3 years.
Hence, considering the overall performance it is recommended that the stock of CBA shall be
included in your portfolio.
Sincerely,
Andrew Johnson,
Investment analyst, Investment Solution Pty Ltd
11FINANCE FOR BUSINESS - MASTERS
IV. Conclusion
As the evidences presented it can be concluded that CBA offers wide range of services
for assisting the Australians to build as well as manage the finances. Considering the financial
performances of the bank in terms of its liquidity position and capital structure that portrays its
solvency position it can be determined that the bank’s ability to receive deposits against
providing loans has been deteriorated over the period of last 3 years. It indicates that the
bank will not have considerable amount of available reserves for unforseen as well as
expected contingencies. However, as the same is more than 100%, the bank is still in good
position to maintain its liquidity position. Further, the capital structure of the bank includes
significantly high level of debt that may raise question on its future sustainability. However, it
has improved its debt position over the years. Net profit and PE ratio further indicates that
even if the profit over the years have been reduced, it is just the temporary phase and the
investors are ready to pay higher amount for each stock of the bank. Hence, the stock of CBA
can be considered for investment.
⊘ This is a preview!⊘
Do you want full access?
Subscribe today to unlock all pages.
Trusted by 1+ million students worldwide
1 out of 14
Related Documents


Your All-in-One AI-Powered Toolkit for Academic Success.
+13062052269
info@desklib.com
Available 24*7 on WhatsApp / Email
![[object Object]](/_next/static/media/star-bottom.7253800d.svg)
Unlock your academic potential
Copyright © 2020–2026 A2Z Services. All Rights Reserved. Developed and managed by ZUCOL.