Financial Analysis Report: Commonwealth Bank Performance Evaluation
VerifiedAdded on 2023/04/04
|14
|3643
|99
Report
AI Summary
This report provides a comprehensive financial analysis of the Commonwealth Bank (CBA). It begins with an overview of CBA's core activities, market position, and historical context, highlighting its competitive advantages. The report then delves into a detailed financial analysis, including the calculation and interpretation of key performance ratios such as Return on Equity (ROE), Return on Assets (ROA), Net Profit Margin, Accounts Receivable Turnover, Receivable Turnover Days, and Asset Turnover Ratio. The analysis covers the years 2016-2018, providing trend analysis of the ratios. The report further examines the company's cash management cycle, discusses systematic and unsystematic risks, and analyzes the dividend policy and payout ratio. Finally, it concludes with a recommendation regarding the company's investment potential based on the financial findings.

Running head: FINANCE
Finance
Name of the student
Name of the university
Student ID
Author note
Finance
Name of the student
Name of the university
Student ID
Author note
Paraphrase This Document
Need a fresh take? Get an instant paraphrase of this document with our AI Paraphraser
1FINANCE
Abstract
Purpose of the report is to outline the core activities of Commonwealth Bank, market under
which it is operating and the history that may be significant for the company in gaining
competitive advantage. The report will focus on the financial analysis of the company
covering the description of the bank, computation and the analysis of performance ratios
including profitability ratio and efficiency ratios. It will further look into the cash management
cycle of the company through focusing on marketable securities and the systematic risks and
unsystematic risks involved with the company that may impact the financial performance
adversely. In addition to that it will also concentrate on the dividend policy and dividend
payout ratio of the company and whether the company can be considered for investment.
2FINANCE
Table of Contents
I. Introduction...........................................................................................................................3
II. Financial analysis.................................................................................................................3
2.1 Description of Commonwealth Bank.................................................................................3
2.2 Computation and the analysis of performance ratios.......................................................3
2.3 Cash management cycle...................................................................................................7
2.4 Sensitivity analysis............................................................................................................7
2.5 systematic risks and unsystematic risks that may impact the financial performance.......8
2.6 Dividend policy and dividend payout ratio.........................................................................9
III. Recommendation letter...................................................................................................10
IV. Conclusion......................................................................................................................10
Reference..................................................................................................................................12
⊘ This is a preview!⊘
Do you want full access?
Subscribe today to unlock all pages.
Trusted by 1+ million students worldwide
3FINANCE
I. Introduction
Main purpose of the report is to outline the core activities of Commonwealth Bank,
market under which it is operating and the history that may be significant for the company in
gaining competitive advantage. The report will further, focus on the performance of the entity
based on the outcome of its profitability ratio and efficiency ratio. It will further recognize the
marketable securities of the company and will comment upon the securities for managing the
cash. In the next step the report will perform the sensitivity analysis with the help of the data
provided. Further, the report will discuss regarding the systematic as well as unsystematic
risks those may have adverse impact on the performance of the company. Moreover, the
dividend payout ratio of the company will be highlighted and will state the dividend policy of
the entity (Vogel, 2014).
Commonwealth bank (CBA) was established in the year 1911 under Commonwealth
Bank act and it started operating in next year that is in 1912. At present the bank has more
than 52000 employees and shareholders of more than 800,000. It provides wide range of
products and services required for financial business management and for helping the
progress of the business. Further, business banking products offered by the bank includes
business loans, business credit cards, business accounts, merchant services,
superannuation, asset finance, insurances, investments and management of international
money. It is the 1st bank that implemented the fully functioned mobile banking service. Though
other banks like Westpac and ANZ implemented the mobile banking service before CBA, it
was limited to iPhone only for full functioning. Further, adoption of methodologies like project
management, outsourcing and strategic planning helps it to solve various issues
(Commbank.com.au, 2019).
II. Financial analysis
2.1 Description of Commonwealth Bank
CBA is multinational financial institution that was established in Australia in early days
of 19th century. The bank’s vision is to become the finest organization in Australia in context of
financial services through standing out in providing the customer service and the strategies of
the bank is to identify considerable opportunities within the business for developing more
value for the customers, stakeholders and people. Major competitive advantage of the bank is
that it is significantly serious regarding the customer service. Further, it is one of the examples
regarding the technology adopted by the bank that delivers excellent services to the
customers through utilizing up-to-date technologies (Robinson et al., 2015). Business loan,
bank transactions and accounts and personal lending are the major products and the services
in the market. Customers prefer these services at different dimensions through different
characteristics and at different service quality, locations, geographies and prices. Major Banks
in Australian banking industry majorly competes over the price and sizes. However, adoption
of methodologies like project management, outsourcing and strategic planning helps it to
solve various issues and gain the competitive advantages over the competitors like NAB, ANZ
and Westpac (Omar et al., 2014).
2.2 Computation and the analysis of performance ratios
Profitability ratio –
Paraphrase This Document
Need a fresh take? Get an instant paraphrase of this document with our AI Paraphraser
4FINANCE
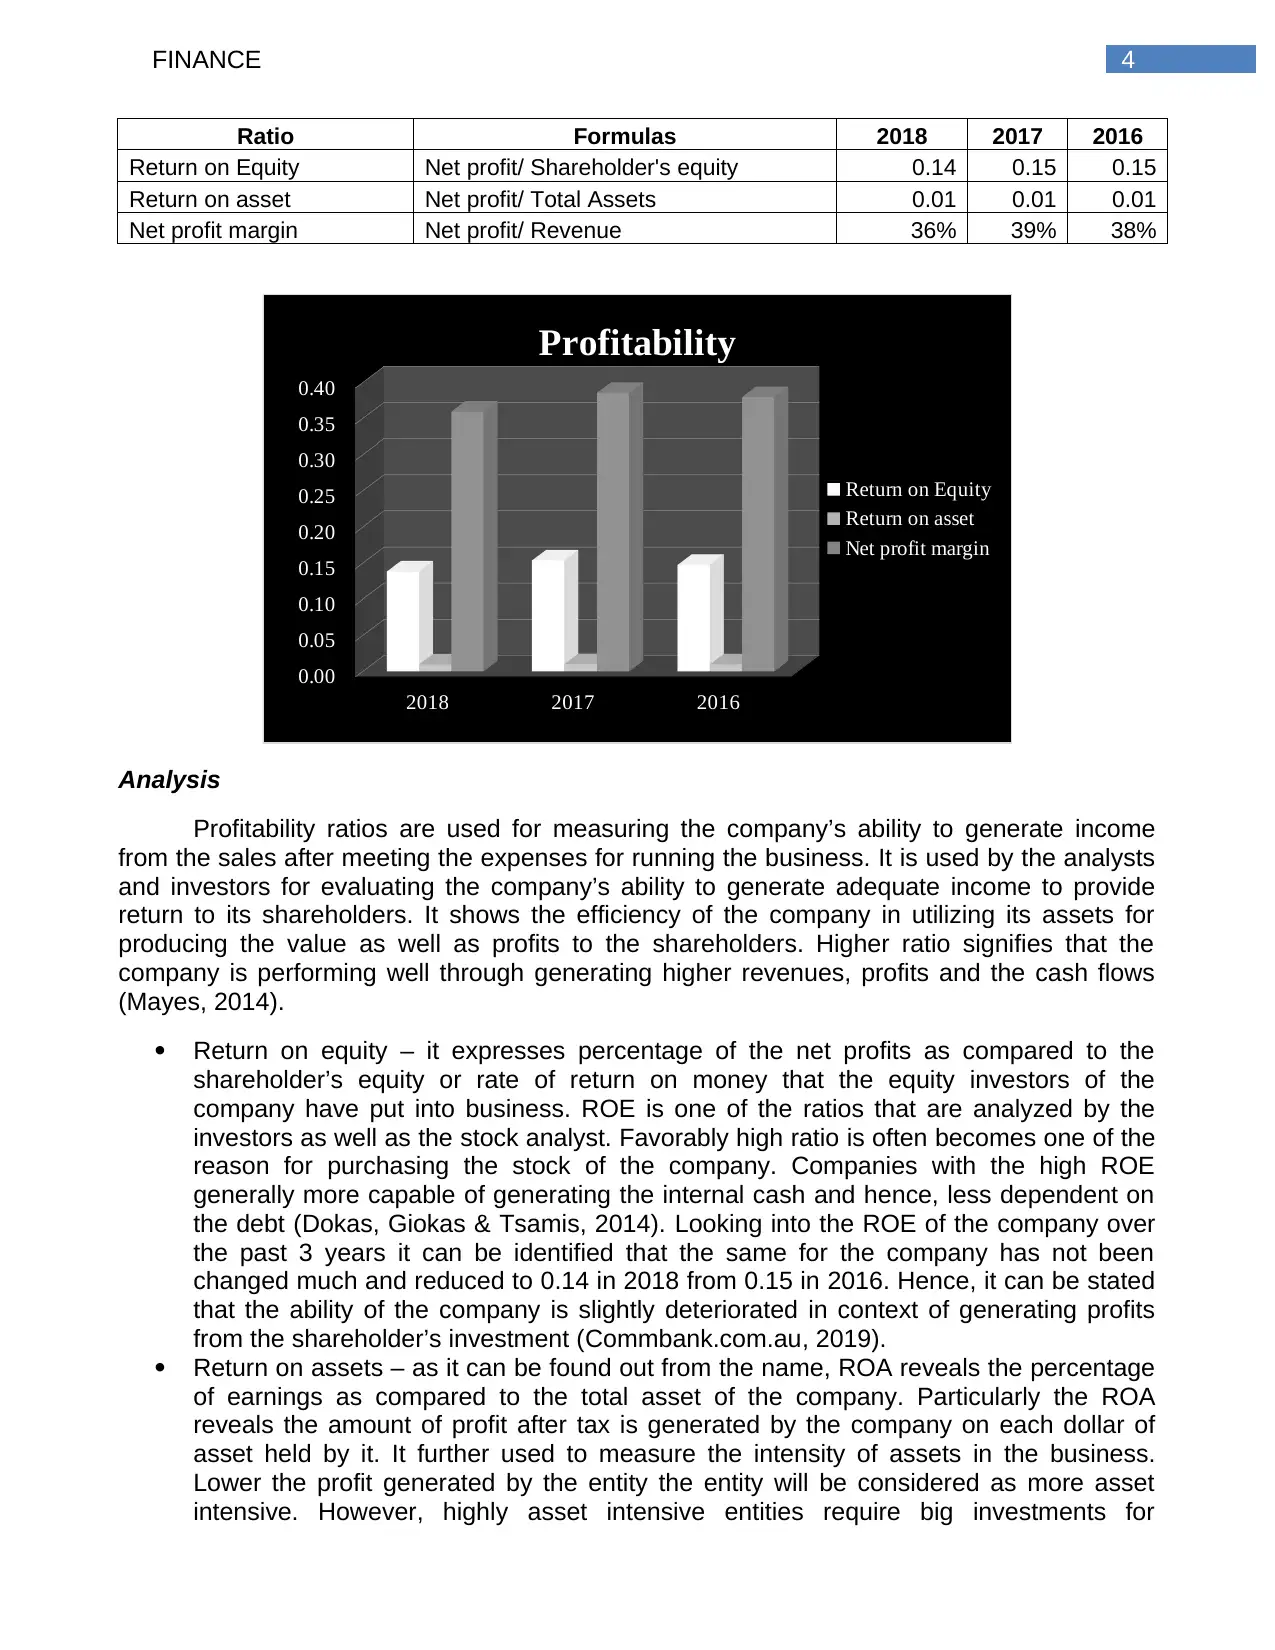
Ratio Formulas 2018 2017 2016
Return on Equity Net profit/ Shareholder's equity 0.14 0.15 0.15
Return on asset Net profit/ Total Assets 0.01 0.01 0.01
Net profit margin Net profit/ Revenue 36% 39% 38%
2018 2017 2016
0.00
0.05
0.10
0.15
0.20
0.25
0.30
0.35
0.40
Profitability
Return on Equity
Return on asset
Net profit margin
Analysis
Profitability ratios are used for measuring the company’s ability to generate income
from the sales after meeting the expenses for running the business. It is used by the analysts
and investors for evaluating the company’s ability to generate adequate income to provide
return to its shareholders. It shows the efficiency of the company in utilizing its assets for
producing the value as well as profits to the shareholders. Higher ratio signifies that the
company is performing well through generating higher revenues, profits and the cash flows
(Mayes, 2014).
Return on equity – it expresses percentage of the net profits as compared to the
shareholder’s equity or rate of return on money that the equity investors of the
company have put into business. ROE is one of the ratios that are analyzed by the
investors as well as the stock analyst. Favorably high ratio is often becomes one of the
reason for purchasing the stock of the company. Companies with the high ROE
generally more capable of generating the internal cash and hence, less dependent on
the debt (Dokas, Giokas & Tsamis, 2014). Looking into the ROE of the company over
the past 3 years it can be identified that the same for the company has not been
changed much and reduced to 0.14 in 2018 from 0.15 in 2016. Hence, it can be stated
that the ability of the company is slightly deteriorated in context of generating profits
from the shareholder’s investment (Commbank.com.au, 2019).
Return on assets – as it can be found out from the name, ROA reveals the percentage
of earnings as compared to the total asset of the company. Particularly the ROA
reveals the amount of profit after tax is generated by the company on each dollar of
asset held by it. It further used to measure the intensity of assets in the business.
Lower the profit generated by the entity the entity will be considered as more asset
intensive. However, highly asset intensive entities require big investments for
5FINANCE
purchasing the equipments and machineries for generating income. Looking into the
ROA of the company over the past 3 years it can be identified that the same for the
company has not been changed over the past 3 years. Hence, it can be stated that the
ability of the company has not been changed in context of generating profits through
deploying its assets (Commbank.com.au, 2019).
Net profit margin – net profit is the bottom line of the business. It focuses on the net
income of the entity and it compares the net profit with the revenues earned by it. Net
profit margin provides the final picture regarding how profitable the company is after
paying all the expenses including taxes and interests. Reason behind using net profit
margin as measure of the profitability is that it takes everything into consideration.
Major drawback of net profit margin is that it includes lot of noise like gains, time
expenses that make it harder for the compatibility sake. Looking into the net profit
margin of the company over the past 3 years it can be identified that the same for the
company has been reduced over the past 3 years and reduced to 36% in 2018 from
38% in 2016. Hence, it can be stated that the ability of the company has been reduced
in context of generating profits through revenues (Commbank.com.au, 2019).
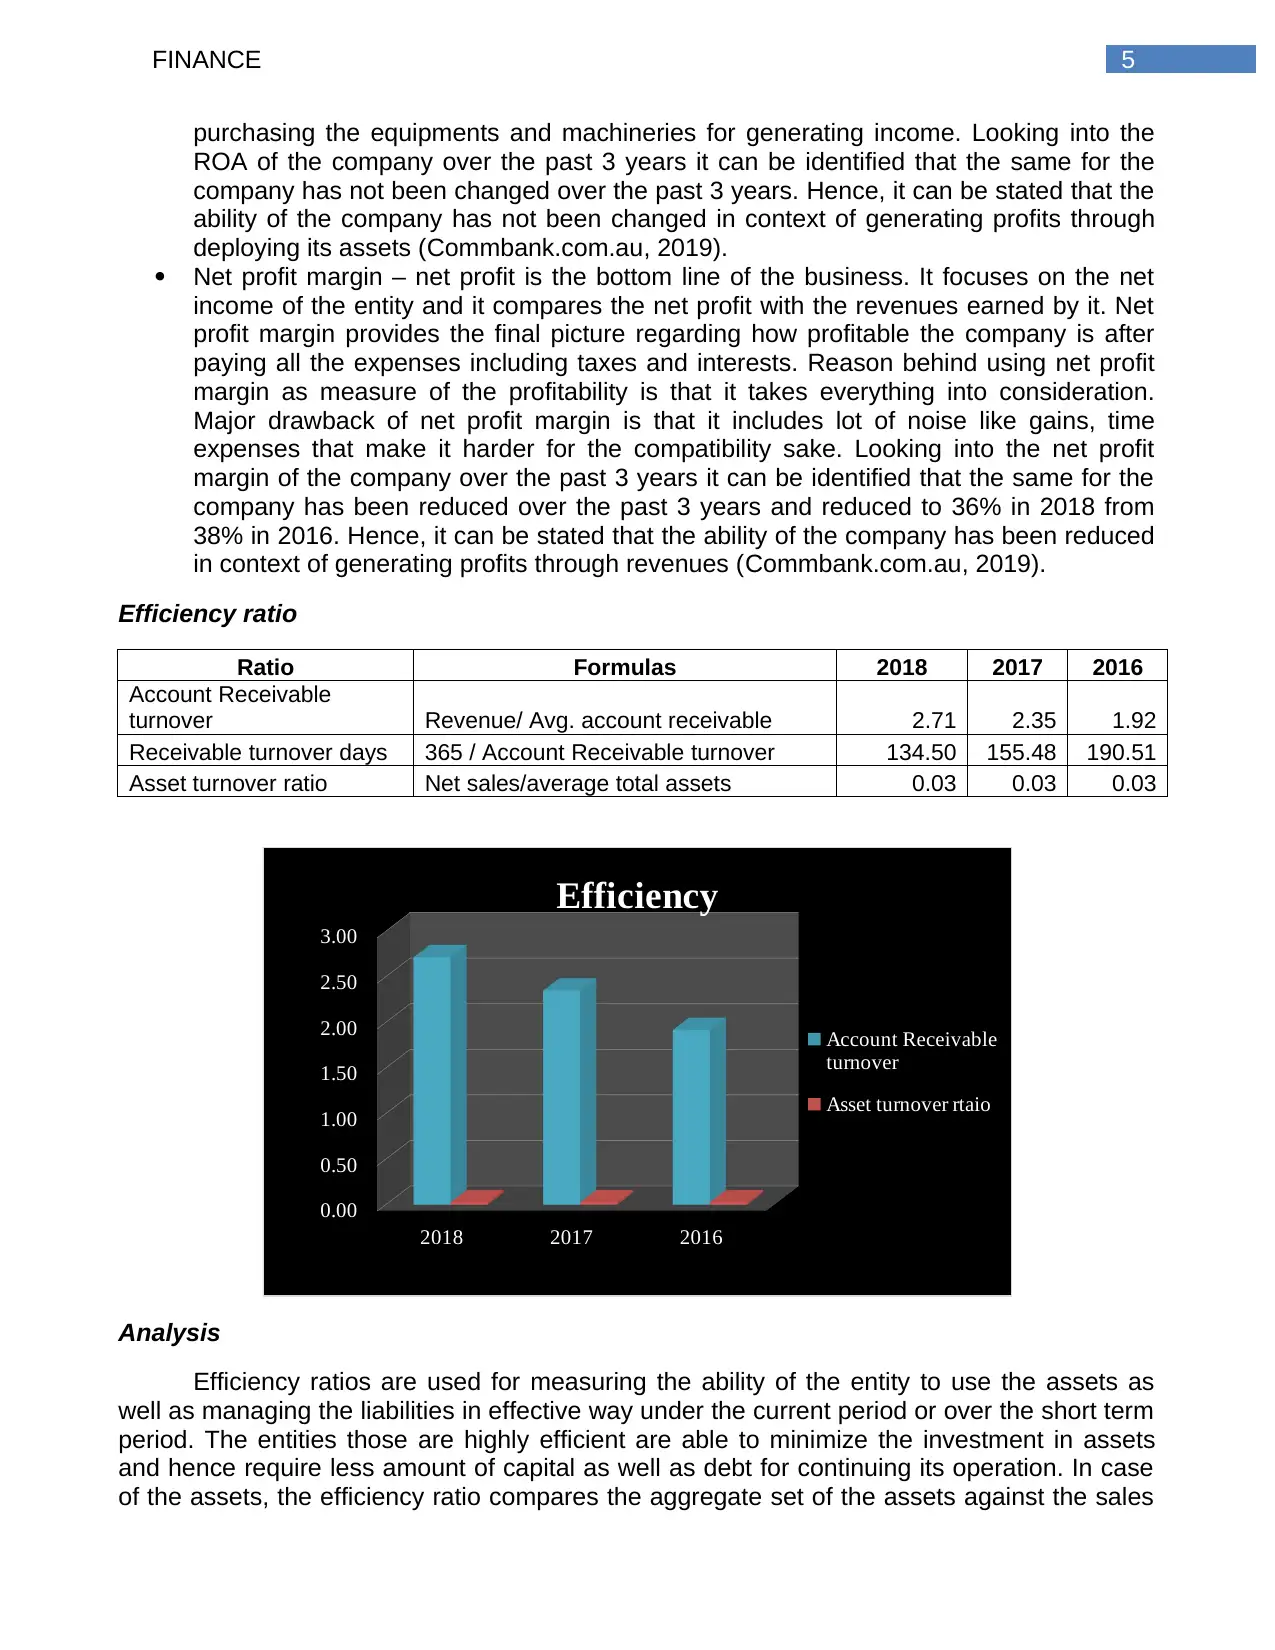
Efficiency ratio
Ratio Formulas 2018 2017 2016
Account Receivable
turnover Revenue/ Avg. account receivable 2.71 2.35 1.92
Receivable turnover days 365 / Account Receivable turnover 134.50 155.48 190.51
Asset turnover ratio Net sales/average total assets 0.03 0.03 0.03
2018 2017 2016
0.00
0.50
1.00
1.50
2.00
2.50
3.00
Efficiency
Account Receivable
turnover
Asset turnover rtaio
Analysis
Efficiency ratios are used for measuring the ability of the entity to use the assets as
well as managing the liabilities in effective way under the current period or over the short term
period. The entities those are highly efficient are able to minimize the investment in assets
and hence require less amount of capital as well as debt for continuing its operation. In case
of the assets, the efficiency ratio compares the aggregate set of the assets against the sales
purchasing the equipments and machineries for generating income. Looking into the
ROA of the company over the past 3 years it can be identified that the same for the
company has not been changed over the past 3 years. Hence, it can be stated that the
ability of the company has not been changed in context of generating profits through
deploying its assets (Commbank.com.au, 2019).
Net profit margin – net profit is the bottom line of the business. It focuses on the net
income of the entity and it compares the net profit with the revenues earned by it. Net
profit margin provides the final picture regarding how profitable the company is after
paying all the expenses including taxes and interests. Reason behind using net profit
margin as measure of the profitability is that it takes everything into consideration.
Major drawback of net profit margin is that it includes lot of noise like gains, time
expenses that make it harder for the compatibility sake. Looking into the net profit
margin of the company over the past 3 years it can be identified that the same for the
company has been reduced over the past 3 years and reduced to 36% in 2018 from
38% in 2016. Hence, it can be stated that the ability of the company has been reduced
in context of generating profits through revenues (Commbank.com.au, 2019).
Efficiency ratio
Ratio Formulas 2018 2017 2016
Account Receivable
turnover Revenue/ Avg. account receivable 2.71 2.35 1.92
Receivable turnover days 365 / Account Receivable turnover 134.50 155.48 190.51
Asset turnover ratio Net sales/average total assets 0.03 0.03 0.03
2018 2017 2016
0.00
0.50
1.00
1.50
2.00
2.50
3.00
Efficiency
Account Receivable
turnover
Asset turnover rtaio
Analysis
Efficiency ratios are used for measuring the ability of the entity to use the assets as
well as managing the liabilities in effective way under the current period or over the short term
period. The entities those are highly efficient are able to minimize the investment in assets
and hence require less amount of capital as well as debt for continuing its operation. In case
of the assets, the efficiency ratio compares the aggregate set of the assets against the sales
⊘ This is a preview!⊘
Do you want full access?
Subscribe today to unlock all pages.
Trusted by 1+ million students worldwide
6FINANCE
or against COGS. In case of the liabilities the efficiency ratios measures the efficiency of the
company with which it can pay the dues to its suppliers from whom it has purchased the
goods.
Accounts receivable ratio and receivables turnover days – accounts receivable
turnover ratio is used for computing the efficiency of the company in terms of its ability
to collect the dues from the sales made in credit. The ratio sounds like complex
accounting concepts that involve credit sales and the average amount of receivables.
High receivables turnover ratio signifies that the entity is able to collect the debts on
time which in turn will increase the cash flows and the credit is extended to right type of
customers which in turn will result into less amount of bad debts. Looking into the
accounts receivable ratio of the company over the past 3 years it can be identified that
the same for the company are in increasing trend over the past 3 years and increased
to 2.71 times in 2018 from 1.92 times in 2016 (Brockman, Tresl & Unlu, 2014). Hence,
it can be stated that the efficiency of the company has been increased in context of
collecting debts from the debtors. On the other hand, the receivable turnover days
states the days taken by the company on an average to collect its debts within the time
frame generally the accounting period. Looking into the receivable turnover days of
the company over the past 3 years it can be identified that the same for the company
are in reducing trend over the past 3 years and reduced to 134.5 days in 2018 from
190.51 days in 2016. Hence, it can be stated that the efficiency of the company has
been increased in context of collecting debts from the debtors (Commbank.com.au,
2019).
Asset turnover ratio – ATR determines the entity’s ability in context of generating the
revenue from the assets trough comparing net sales of entity with total assets. It is
computed through dividing the net sales of the company by the average amount of
total assets. To be more specific, it determines the average assets generated by the
company through deploying each dollar of the asset. It provides an insight to creditors
as well as the investors into internal management of the entity. Low asset turnover
ratio reflects poor collection practice of the entity. Looking into the ATR of the company
over the past 3 years it can be identified that the same for the company has not been
changed over the years from 2016 to 2018 and the ATR of 0.3 is signifying that the
company shall try to improve the ATR. 2018 from 0.15 in 2016 (Commbank.com.au,
2019).
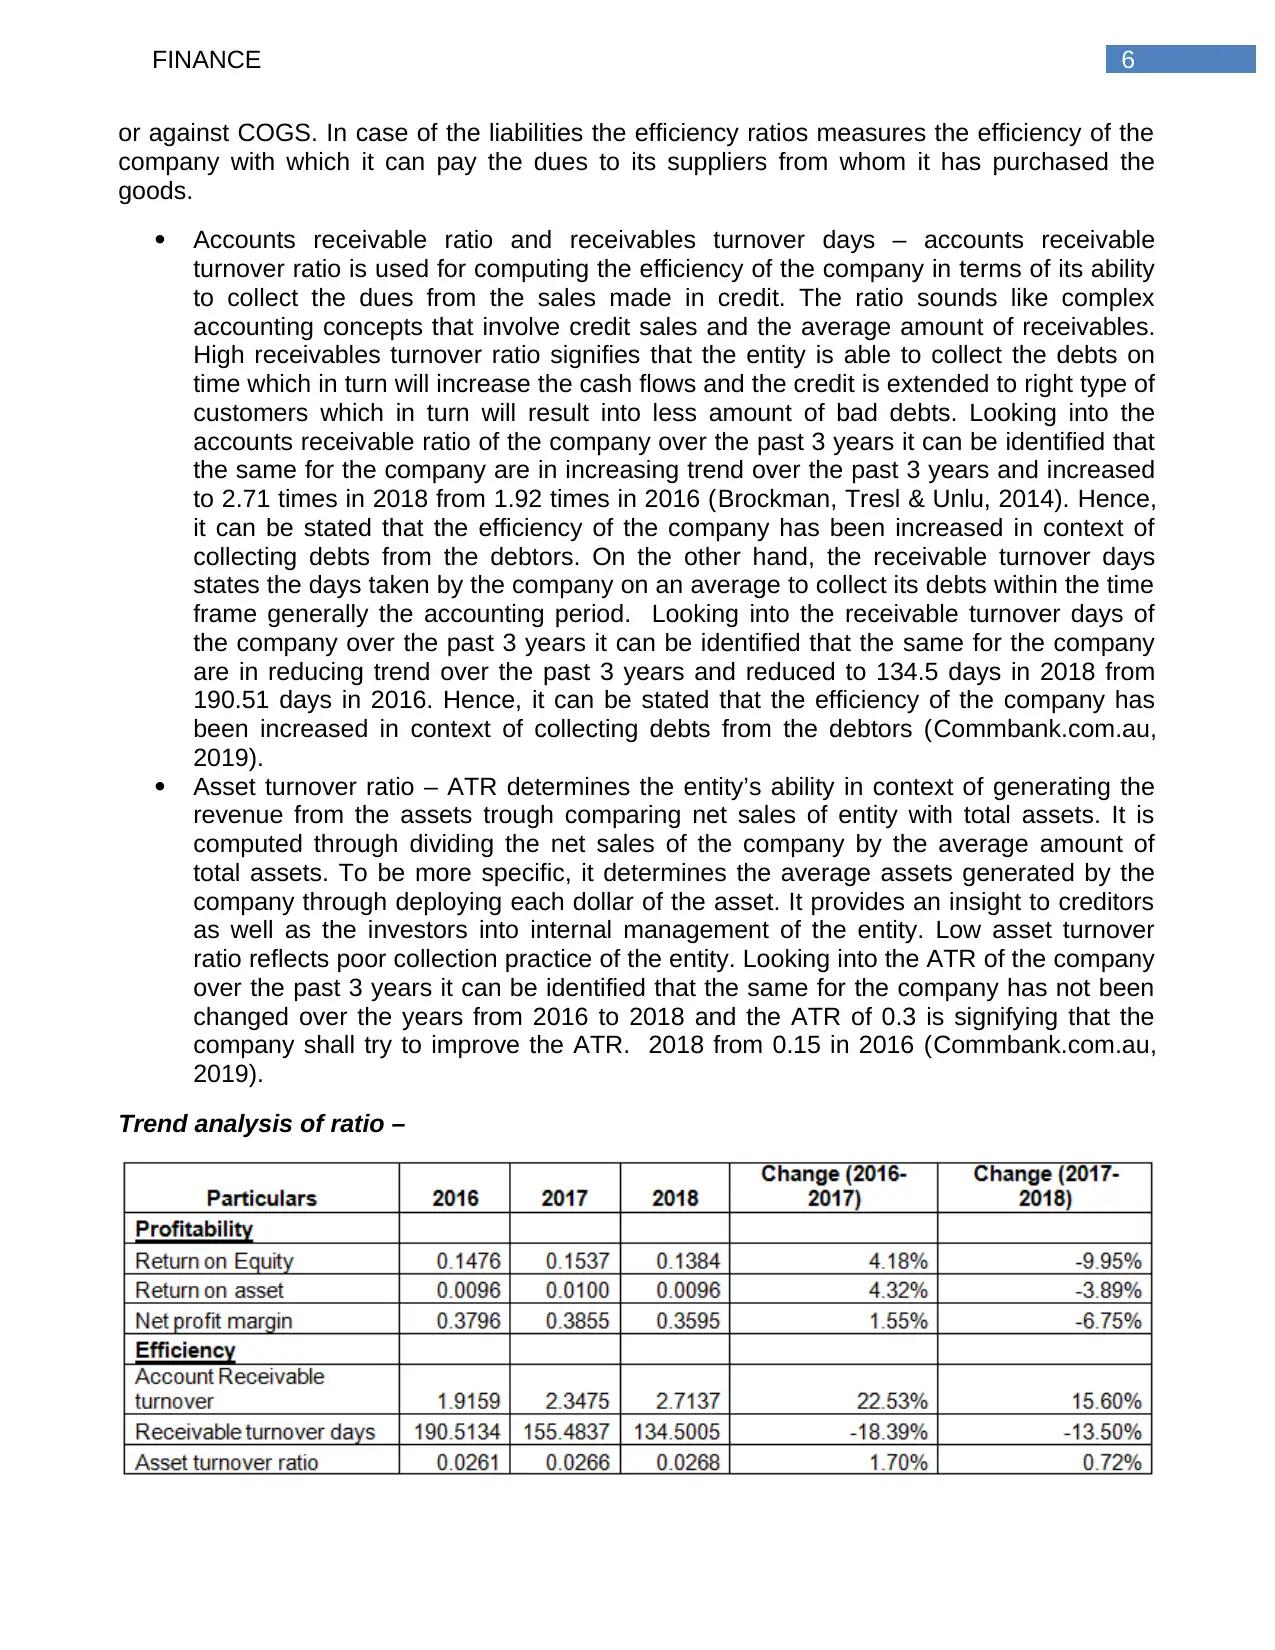
Trend analysis of ratio –
or against COGS. In case of the liabilities the efficiency ratios measures the efficiency of the
company with which it can pay the dues to its suppliers from whom it has purchased the
goods.
Accounts receivable ratio and receivables turnover days – accounts receivable
turnover ratio is used for computing the efficiency of the company in terms of its ability
to collect the dues from the sales made in credit. The ratio sounds like complex
accounting concepts that involve credit sales and the average amount of receivables.
High receivables turnover ratio signifies that the entity is able to collect the debts on
time which in turn will increase the cash flows and the credit is extended to right type of
customers which in turn will result into less amount of bad debts. Looking into the
accounts receivable ratio of the company over the past 3 years it can be identified that
the same for the company are in increasing trend over the past 3 years and increased
to 2.71 times in 2018 from 1.92 times in 2016 (Brockman, Tresl & Unlu, 2014). Hence,
it can be stated that the efficiency of the company has been increased in context of
collecting debts from the debtors. On the other hand, the receivable turnover days
states the days taken by the company on an average to collect its debts within the time
frame generally the accounting period. Looking into the receivable turnover days of
the company over the past 3 years it can be identified that the same for the company
are in reducing trend over the past 3 years and reduced to 134.5 days in 2018 from
190.51 days in 2016. Hence, it can be stated that the efficiency of the company has
been increased in context of collecting debts from the debtors (Commbank.com.au,
2019).
Asset turnover ratio – ATR determines the entity’s ability in context of generating the
revenue from the assets trough comparing net sales of entity with total assets. It is
computed through dividing the net sales of the company by the average amount of
total assets. To be more specific, it determines the average assets generated by the
company through deploying each dollar of the asset. It provides an insight to creditors
as well as the investors into internal management of the entity. Low asset turnover
ratio reflects poor collection practice of the entity. Looking into the ATR of the company
over the past 3 years it can be identified that the same for the company has not been
changed over the years from 2016 to 2018 and the ATR of 0.3 is signifying that the
company shall try to improve the ATR. 2018 from 0.15 in 2016 (Commbank.com.au,
2019).
Trend analysis of ratio –
Paraphrase This Document
Need a fresh take? Get an instant paraphrase of this document with our AI Paraphraser
7FINANCE
From the above table it can be identified that all the profitability ratios over the years
from 2016 to 2017 has been in increasing trend. However, over the years from 2017 to 2018
the profitability ratios are in reducing trend. Hence, it is signifying that though the profitability
status of the company improved over 2016 – 2017, over the period of 2017-2018 it has been
deteriorated. On the other hand, if the efficiency ratios are considered it can be identified that
all the efficiency ratios over the years from 2016 to 2017 as well as from 2017 to 2018 have
been in increasing trend (Byrne & O’Connor, 2017)
2.3 Cash management cycle
Marketable securities reported by the company for the year ended 30th June 2018 are as
follows –
Trading assets - $ 32,254 million
Insurance assets - $ 372 million
Other assets - $ 258 million
Investments available for sale - $ 32,133 million (Commbank.com.au, 2019).
The entity reports marketable securities owned by it in the financial statement.
Marketable securities can be used for improving the cash management cycle of the company
as the marketable securities are readily available and are expected to get converted into cash
within period of 1 year (Ahmed, 2015).
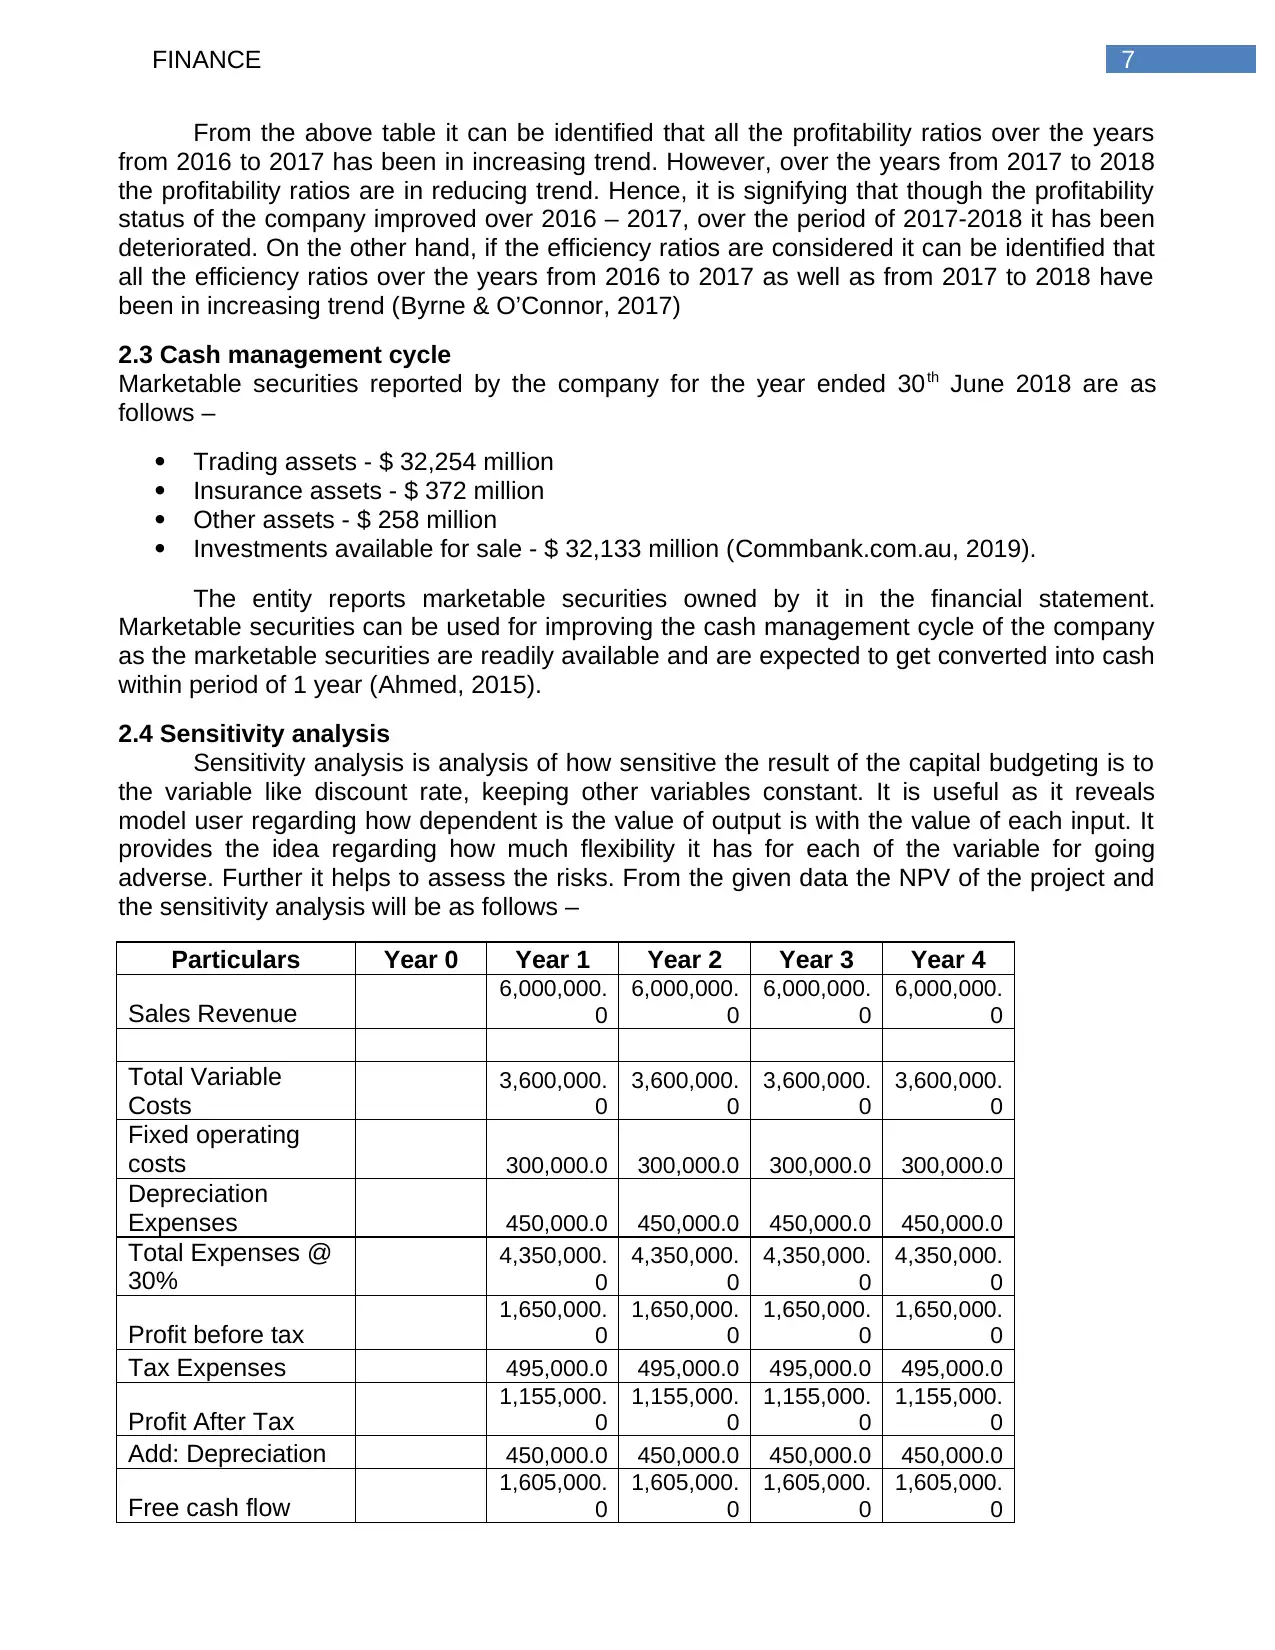
2.4 Sensitivity analysis
Sensitivity analysis is analysis of how sensitive the result of the capital budgeting is to
the variable like discount rate, keeping other variables constant. It is useful as it reveals
model user regarding how dependent is the value of output is with the value of each input. It
provides the idea regarding how much flexibility it has for each of the variable for going
adverse. Further it helps to assess the risks. From the given data the NPV of the project and
the sensitivity analysis will be as follows –
Particulars Year 0 Year 1 Year 2 Year 3 Year 4
Sales Revenue
6,000,000.
0
6,000,000.
0
6,000,000.
0
6,000,000.
0
Total Variable
Costs
3,600,000.
0
3,600,000.
0
3,600,000.
0
3,600,000.
0
Fixed operating
costs 300,000.0 300,000.0 300,000.0 300,000.0
Depreciation
Expenses 450,000.0 450,000.0 450,000.0 450,000.0
Total Expenses @
30%
4,350,000.
0
4,350,000.
0
4,350,000.
0
4,350,000.
0
Profit before tax
1,650,000.
0
1,650,000.
0
1,650,000.
0
1,650,000.
0
Tax Expenses 495,000.0 495,000.0 495,000.0 495,000.0
Profit After Tax
1,155,000.
0
1,155,000.
0
1,155,000.
0
1,155,000.
0
Add: Depreciation 450,000.0 450,000.0 450,000.0 450,000.0
Free cash flow
1,605,000.
0
1,605,000.
0
1,605,000.
0
1,605,000.
0
From the above table it can be identified that all the profitability ratios over the years
from 2016 to 2017 has been in increasing trend. However, over the years from 2017 to 2018
the profitability ratios are in reducing trend. Hence, it is signifying that though the profitability
status of the company improved over 2016 – 2017, over the period of 2017-2018 it has been
deteriorated. On the other hand, if the efficiency ratios are considered it can be identified that
all the efficiency ratios over the years from 2016 to 2017 as well as from 2017 to 2018 have
been in increasing trend (Byrne & O’Connor, 2017)
2.3 Cash management cycle
Marketable securities reported by the company for the year ended 30th June 2018 are as
follows –
Trading assets - $ 32,254 million
Insurance assets - $ 372 million
Other assets - $ 258 million
Investments available for sale - $ 32,133 million (Commbank.com.au, 2019).
The entity reports marketable securities owned by it in the financial statement.
Marketable securities can be used for improving the cash management cycle of the company
as the marketable securities are readily available and are expected to get converted into cash
within period of 1 year (Ahmed, 2015).
2.4 Sensitivity analysis
Sensitivity analysis is analysis of how sensitive the result of the capital budgeting is to
the variable like discount rate, keeping other variables constant. It is useful as it reveals
model user regarding how dependent is the value of output is with the value of each input. It
provides the idea regarding how much flexibility it has for each of the variable for going
adverse. Further it helps to assess the risks. From the given data the NPV of the project and
the sensitivity analysis will be as follows –
Particulars Year 0 Year 1 Year 2 Year 3 Year 4
Sales Revenue
6,000,000.
0
6,000,000.
0
6,000,000.
0
6,000,000.
0
Total Variable
Costs
3,600,000.
0
3,600,000.
0
3,600,000.
0
3,600,000.
0
Fixed operating
costs 300,000.0 300,000.0 300,000.0 300,000.0
Depreciation
Expenses 450,000.0 450,000.0 450,000.0 450,000.0
Total Expenses @
30%
4,350,000.
0
4,350,000.
0
4,350,000.
0
4,350,000.
0
Profit before tax
1,650,000.
0
1,650,000.
0
1,650,000.
0
1,650,000.
0
Tax Expenses 495,000.0 495,000.0 495,000.0 495,000.0
Profit After Tax
1,155,000.
0
1,155,000.
0
1,155,000.
0
1,155,000.
0
Add: Depreciation 450,000.0 450,000.0 450,000.0 450,000.0
Free cash flow
1,605,000.
0
1,605,000.
0
1,605,000.
0
1,605,000.
0
8FINANCE
Cost of Machine
-
2,000,000.
0
Working Capital
required -60,000.0 60,000.0
Salvage Value 200,000.0
Cash Flows
-
2,060,000.
0
1,605,000.
0
1,605,000.
0
1,605,000.
0
1,865,000.
0
discounting factor
@10% 1.0 0.9 0.8 0.8 0.7
PV of Cash Flow
-
2,060,000.
0
1,459,090.
9
1,326,446.
3
1,205,860.
3
1,273,820.
1
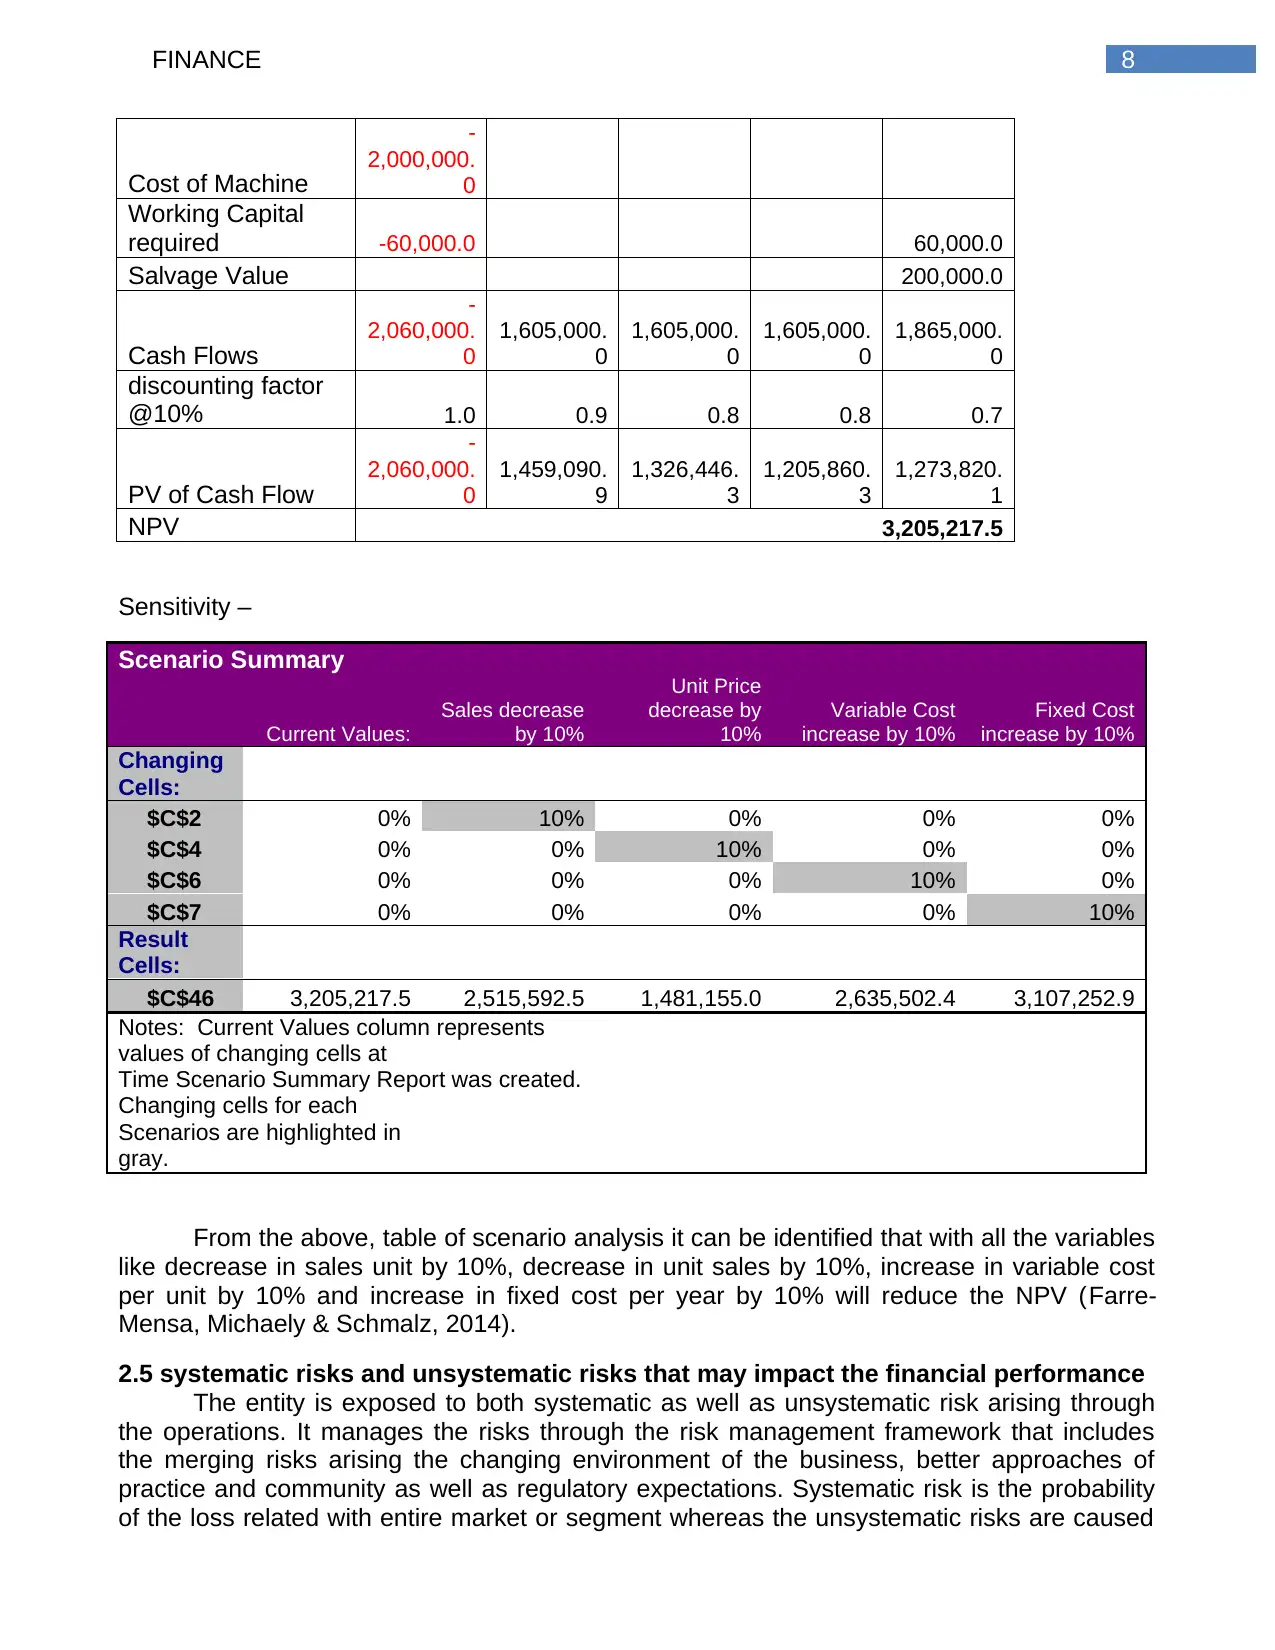
NPV 3,205,217.5
Sensitivity –
Scenario Summary
Current Values:
Sales decrease
by 10%
Unit Price
decrease by
10%
Variable Cost
increase by 10%
Fixed Cost
increase by 10%
Changing
Cells:
$C$2 0% 10% 0% 0% 0%
$C$4 0% 0% 10% 0% 0%
$C$6 0% 0% 0% 10% 0%
$C$7 0% 0% 0% 0% 10%
Result
Cells:
$C$46 3,205,217.5 2,515,592.5 1,481,155.0 2,635,502.4 3,107,252.9
Notes: Current Values column represents
values of changing cells at
Time Scenario Summary Report was created.
Changing cells for each
Scenarios are highlighted in
gray.
From the above, table of scenario analysis it can be identified that with all the variables
like decrease in sales unit by 10%, decrease in unit sales by 10%, increase in variable cost
per unit by 10% and increase in fixed cost per year by 10% will reduce the NPV (Farre-
Mensa, Michaely & Schmalz, 2014).
2.5 systematic risks and unsystematic risks that may impact the financial performance
The entity is exposed to both systematic as well as unsystematic risk arising through
the operations. It manages the risks through the risk management framework that includes
the merging risks arising the changing environment of the business, better approaches of
practice and community as well as regulatory expectations. Systematic risk is the probability
of the loss related with entire market or segment whereas the unsystematic risks are caused
Cost of Machine
-
2,000,000.
0
Working Capital
required -60,000.0 60,000.0
Salvage Value 200,000.0
Cash Flows
-
2,060,000.
0
1,605,000.
0
1,605,000.
0
1,605,000.
0
1,865,000.
0
discounting factor
@10% 1.0 0.9 0.8 0.8 0.7
PV of Cash Flow
-
2,060,000.
0
1,459,090.
9
1,326,446.
3
1,205,860.
3
1,273,820.
1
NPV 3,205,217.5
Sensitivity –
Scenario Summary
Current Values:
Sales decrease
by 10%
Unit Price
decrease by
10%
Variable Cost
increase by 10%
Fixed Cost
increase by 10%
Changing
Cells:
$C$2 0% 10% 0% 0% 0%
$C$4 0% 0% 10% 0% 0%
$C$6 0% 0% 0% 10% 0%
$C$7 0% 0% 0% 0% 10%
Result
Cells:
$C$46 3,205,217.5 2,515,592.5 1,481,155.0 2,635,502.4 3,107,252.9
Notes: Current Values column represents
values of changing cells at
Time Scenario Summary Report was created.
Changing cells for each
Scenarios are highlighted in
gray.
From the above, table of scenario analysis it can be identified that with all the variables
like decrease in sales unit by 10%, decrease in unit sales by 10%, increase in variable cost
per unit by 10% and increase in fixed cost per year by 10% will reduce the NPV (Farre-
Mensa, Michaely & Schmalz, 2014).
2.5 systematic risks and unsystematic risks that may impact the financial performance
The entity is exposed to both systematic as well as unsystematic risk arising through
the operations. It manages the risks through the risk management framework that includes
the merging risks arising the changing environment of the business, better approaches of
practice and community as well as regulatory expectations. Systematic risk is the probability
of the loss related with entire market or segment whereas the unsystematic risks are caused
⊘ This is a preview!⊘
Do you want full access?
Subscribe today to unlock all pages.
Trusted by 1+ million students worldwide
9FINANCE
owing to internal factors that can be controlled or can be reduced in relatively short span of
the time (Gamayuni, 2015).
Systematic risks involved with the company are as follows –
Credit risks – it is the potential for loss that arises from failure of counterparty to meet
the contractual obligation of the company. At the level of portfolio, credit risk involves
concentration risk that arises from independencies among customers and
concentration of exposures to the geographical regions and the industry sectors (Seay,
2014).
Market risks – it is the risk that the prices as well as market risks will change and it may
have adverse impact on the profitability or net worth of the company it includes the
changes in the interest rates, changes in the rates of foreign exchange, credit spreads,
commodity and equity prices and the resale value of the operating leased assets at the
maturity (Lakshmi, Martin & Venkatesan, 2015).
Unsystematic risks involved with the company are as follows –
Operational risk – it is the risk of the loss generated from failed or inadequate internal
processes, systems and people or from the external events.
Compliance risk – it is the risk associated with financial loss, reputational damage for
which the performance of the company may impacted adversely (Crane, Michenaud &
Weston, 2016).
2.6 Dividend policy and dividend payout ratio
The bank seeks to –
Pay the cash dividend at sustainable and strong levels
Maximize use of the franking account through paying the franked dividends fully
Target full year payout ratio of 70% - 80%
Paraphrase This Document
Need a fresh take? Get an instant paraphrase of this document with our AI Paraphraser
10FINANCE
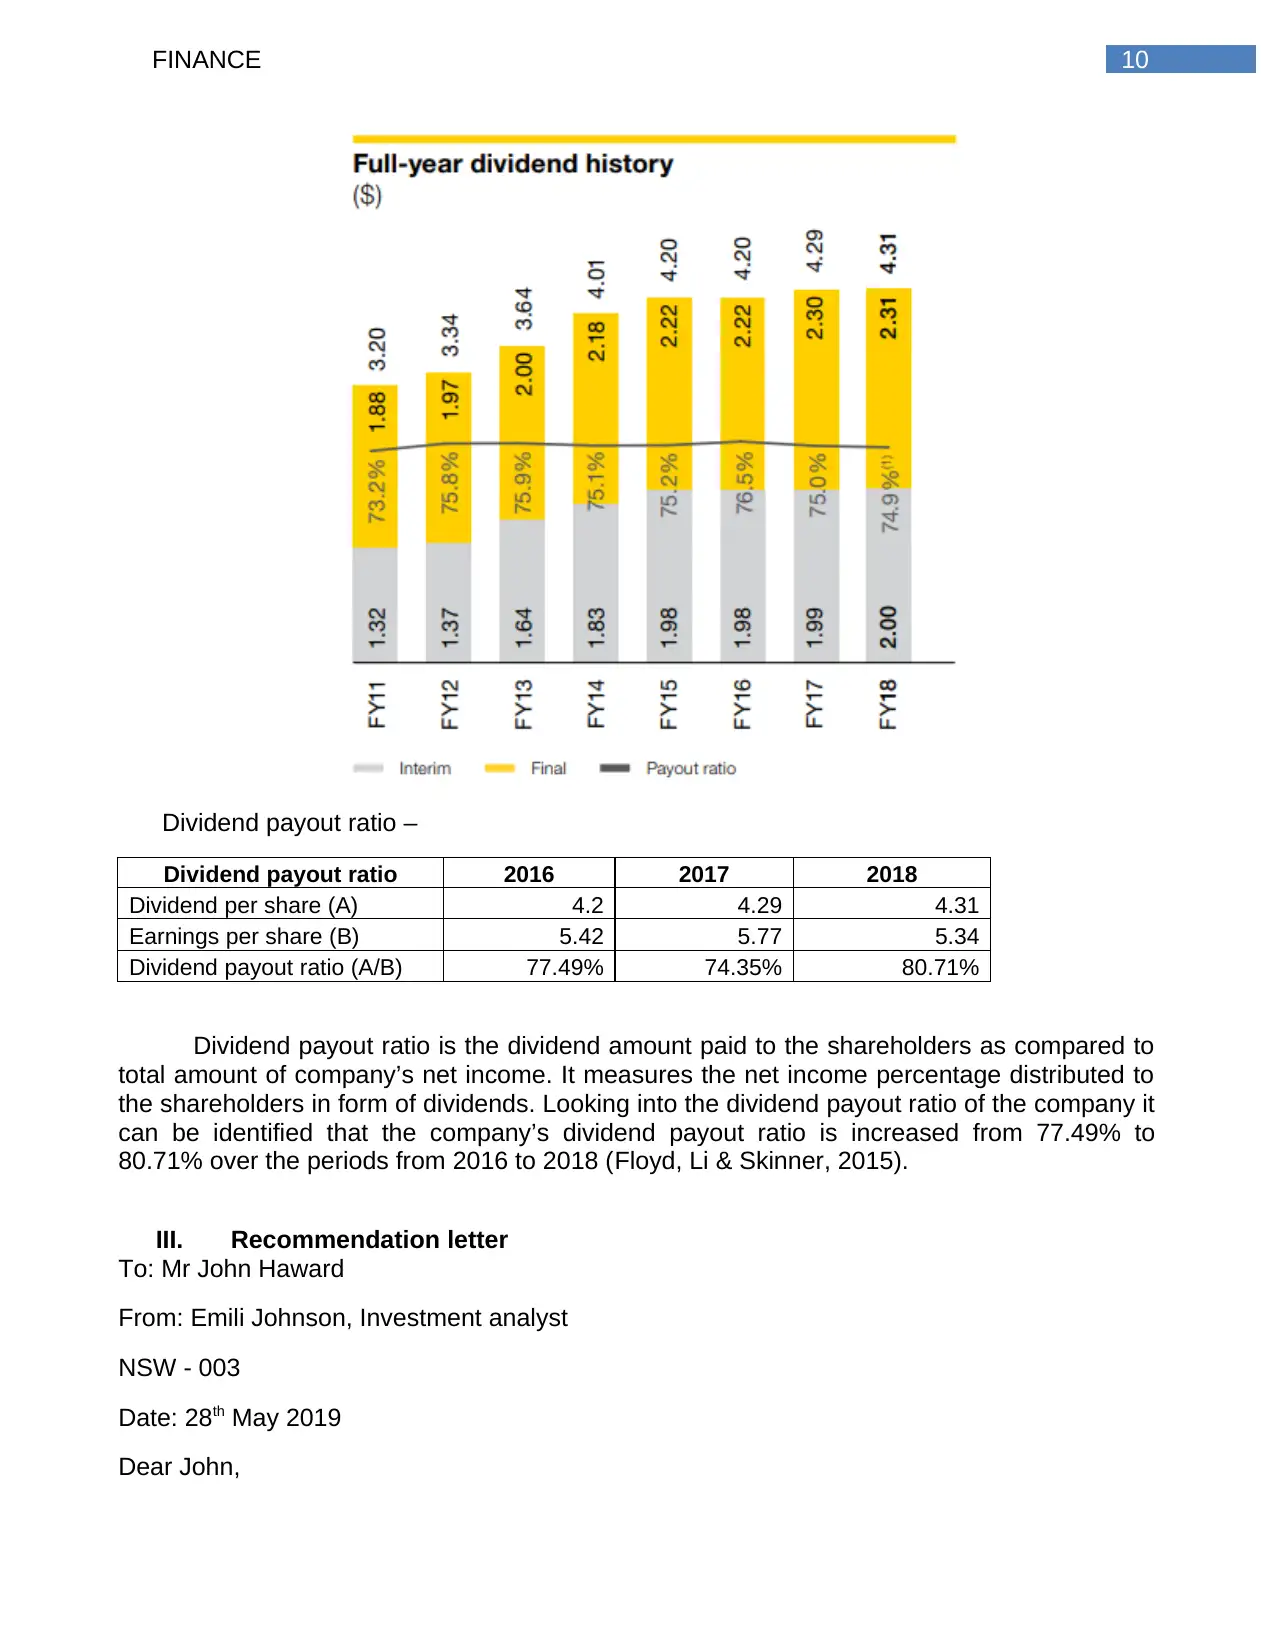
Dividend payout ratio –
Dividend payout ratio 2016 2017 2018
Dividend per share (A) 4.2 4.29 4.31
Earnings per share (B) 5.42 5.77 5.34
Dividend payout ratio (A/B) 77.49% 74.35% 80.71%
Dividend payout ratio is the dividend amount paid to the shareholders as compared to
total amount of company’s net income. It measures the net income percentage distributed to
the shareholders in form of dividends. Looking into the dividend payout ratio of the company it
can be identified that the company’s dividend payout ratio is increased from 77.49% to
80.71% over the periods from 2016 to 2018 (Floyd, Li & Skinner, 2015).
III. Recommendation letter
To: Mr John Haward
From: Emili Johnson, Investment analyst
NSW - 003
Date: 28th May 2019
Dear John,
11FINANCE
This is to bring your kind attention that the analysis for Commonwealth Bank that was asked
by you has been completed. Looking into the performance of the bank over the last 3 years
covering the period from 2016 – 2018, it can be suggested that the bank can be considered
for investing the money. The reason behind this suggestion is that all the profitability ratios
over the years from 2016 to 2017 have been in increasing trend. However, though the same
over the years from 2017 to 2018 are in reducing trend it is still profitable and able to provide
return to the shareholders. On the other hand, if the efficiency ratios are considered it can be
identified that all the efficiency ratios over the years from 2016 to 2017 as well as from 2017
to 2018 have been in increasing trend. Hence, the performance of the company is signifying
that the shares of the entity can be purchased.
Sincerely,
Emili Johnson, Investment analyst
IV. Conclusion
It can be concluded from the above that the Commonwealth Bank provides wide range
of products and services required for financial business management and for helping the
progress of the business. Further, business banking products offered by the bank includes
business loans, business credit cards, business accounts, merchant services,
superannuation, asset finance, insurances, investments and management of international
money. Looking into the dividend payout ratio of the company it can be identified that the
company is regular in paying dividend and the company’s dividend payout ratio is increased
from 77.49% to 80.71% over the periods from 2016 to 2018. Further, the performance of the
company is signifying that the shares of the entity can be purchased.
⊘ This is a preview!⊘
Do you want full access?
Subscribe today to unlock all pages.
Trusted by 1+ million students worldwide
1 out of 14
Related Documents


Your All-in-One AI-Powered Toolkit for Academic Success.
+13062052269
info@desklib.com
Available 24*7 on WhatsApp / Email
![[object Object]](/_next/static/media/star-bottom.7253800d.svg)
Unlock your academic potential
Copyright © 2020–2026 A2Z Services. All Rights Reserved. Developed and managed by ZUCOL.