Investment Analysis Report: Commonwealth Bank of Australia (CBA)

Verified

Added on  2020/03/16

|17
|3462
|49
Report
AI Summary
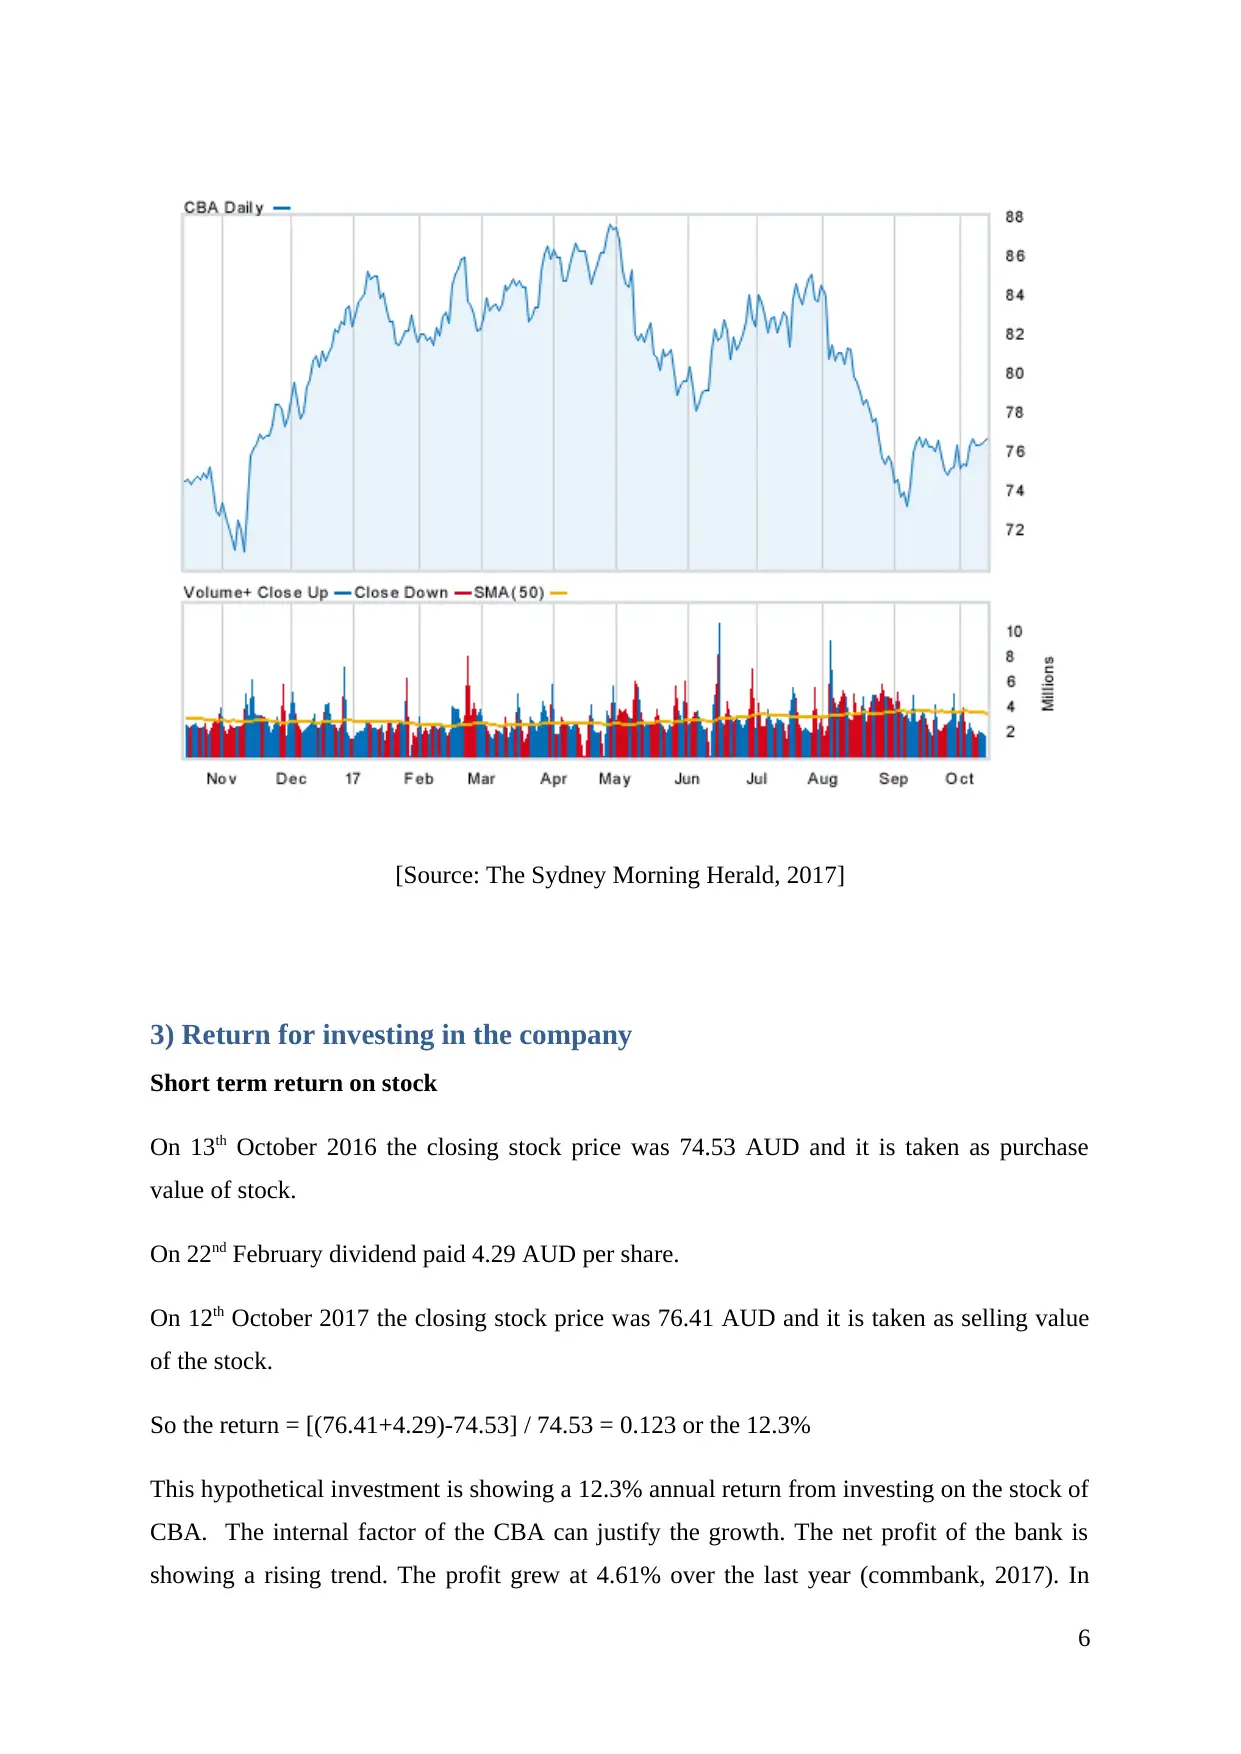
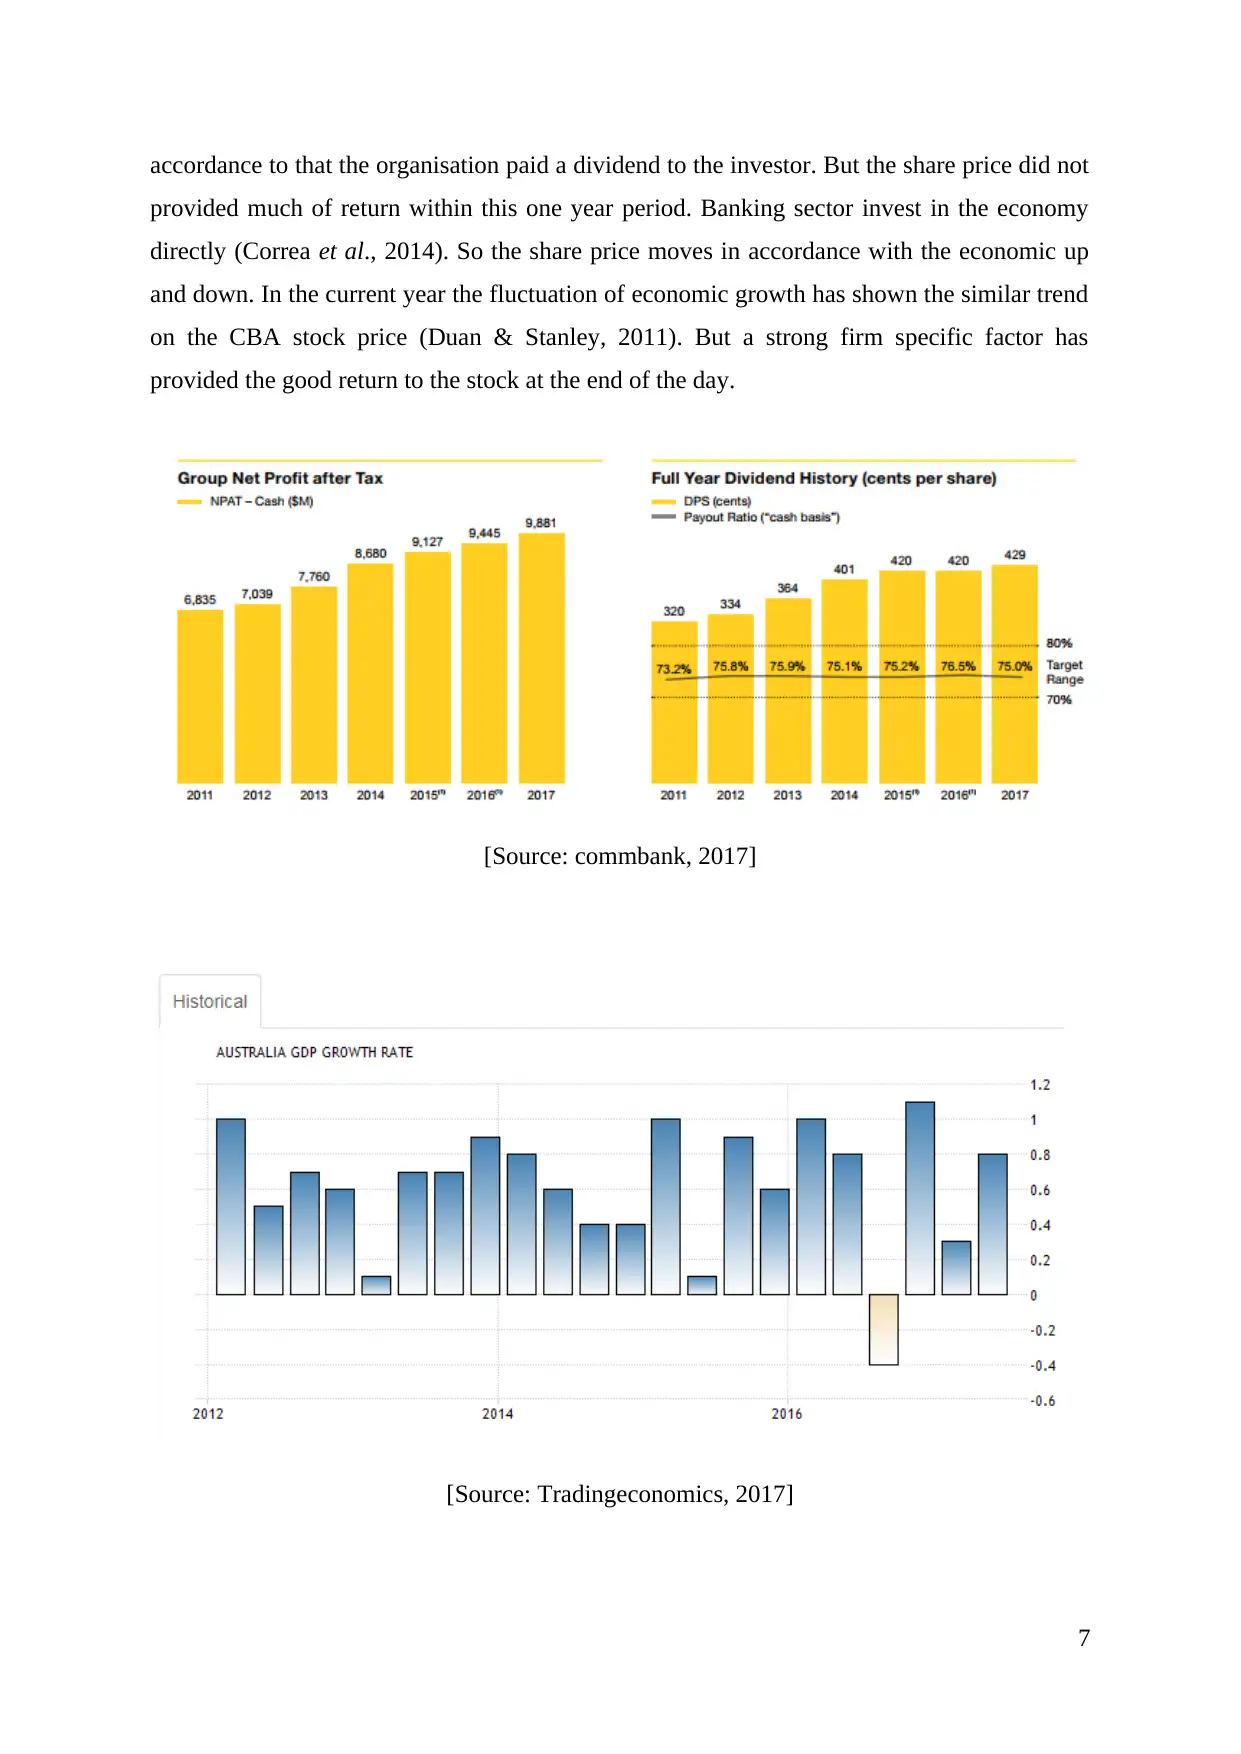
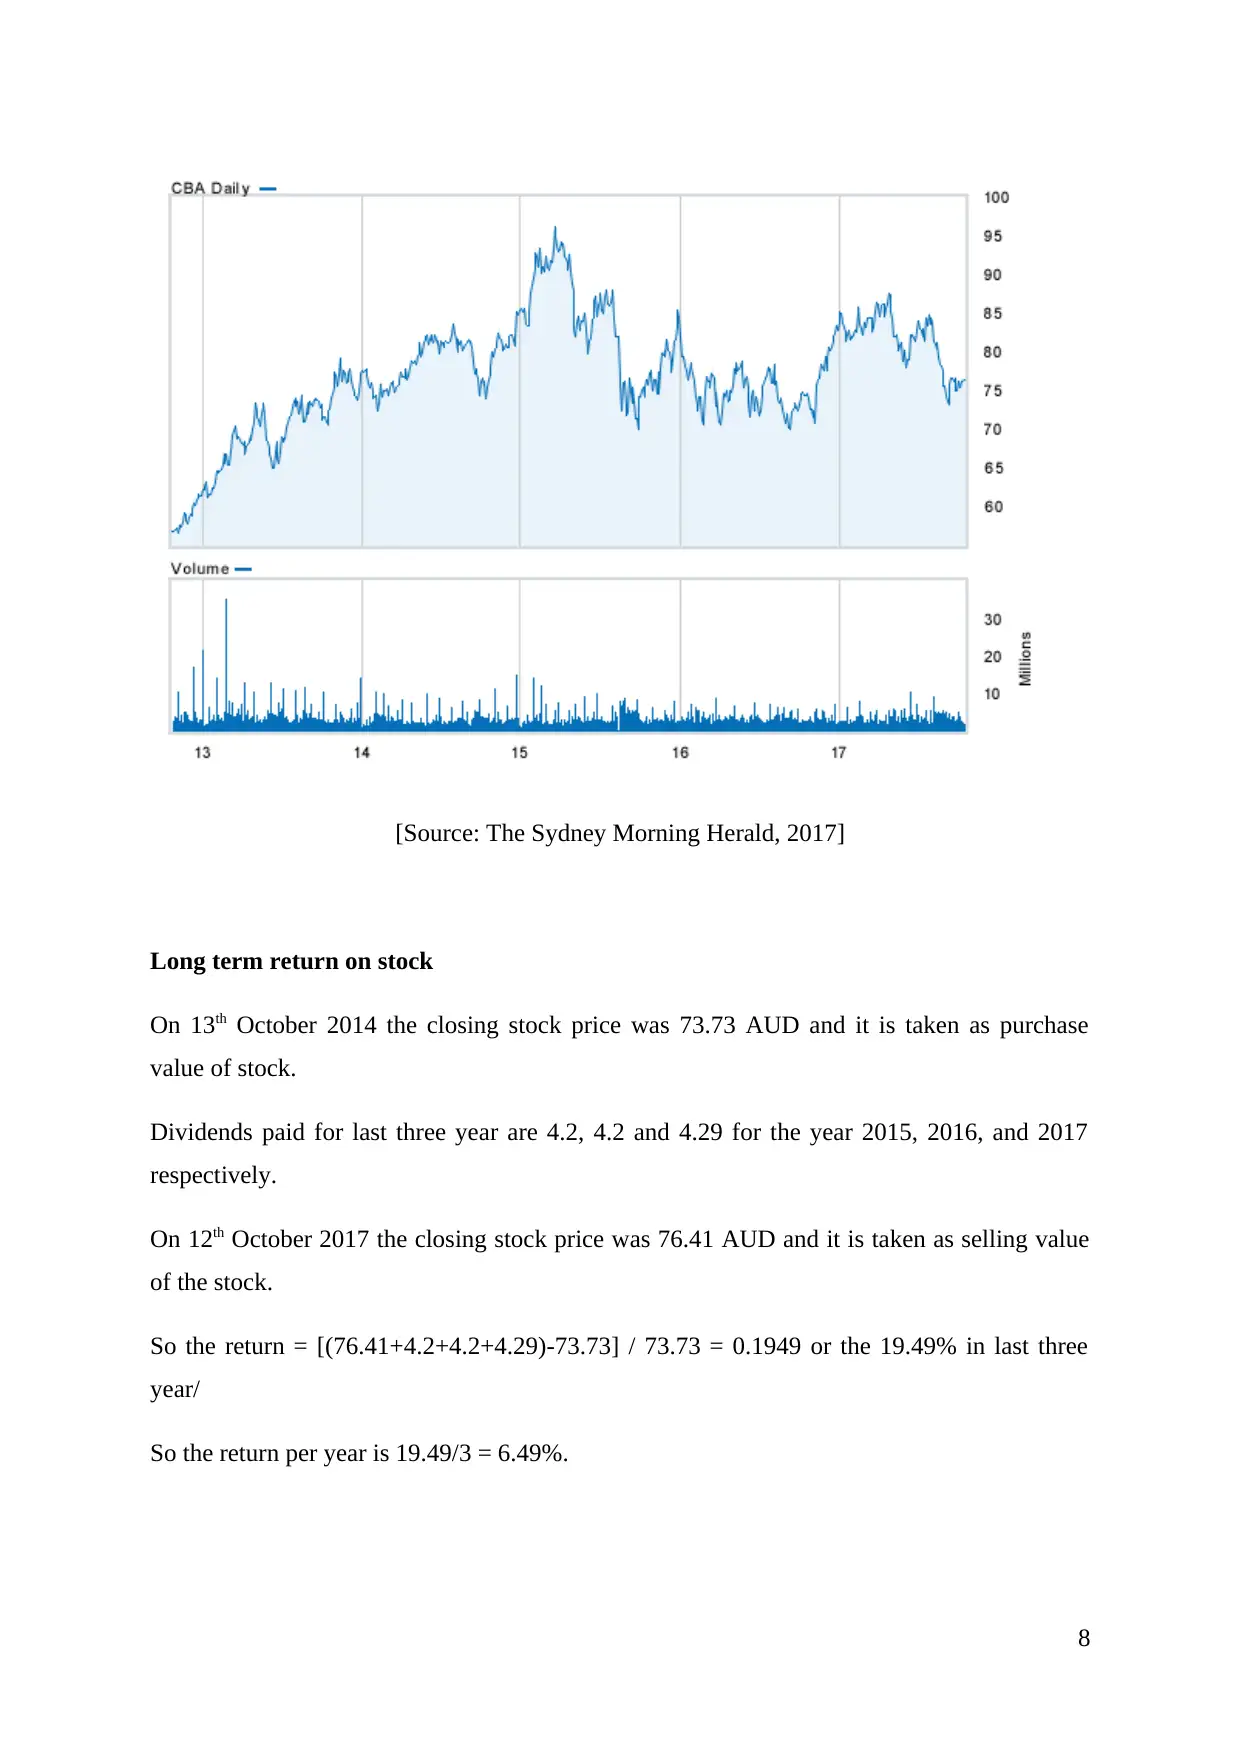
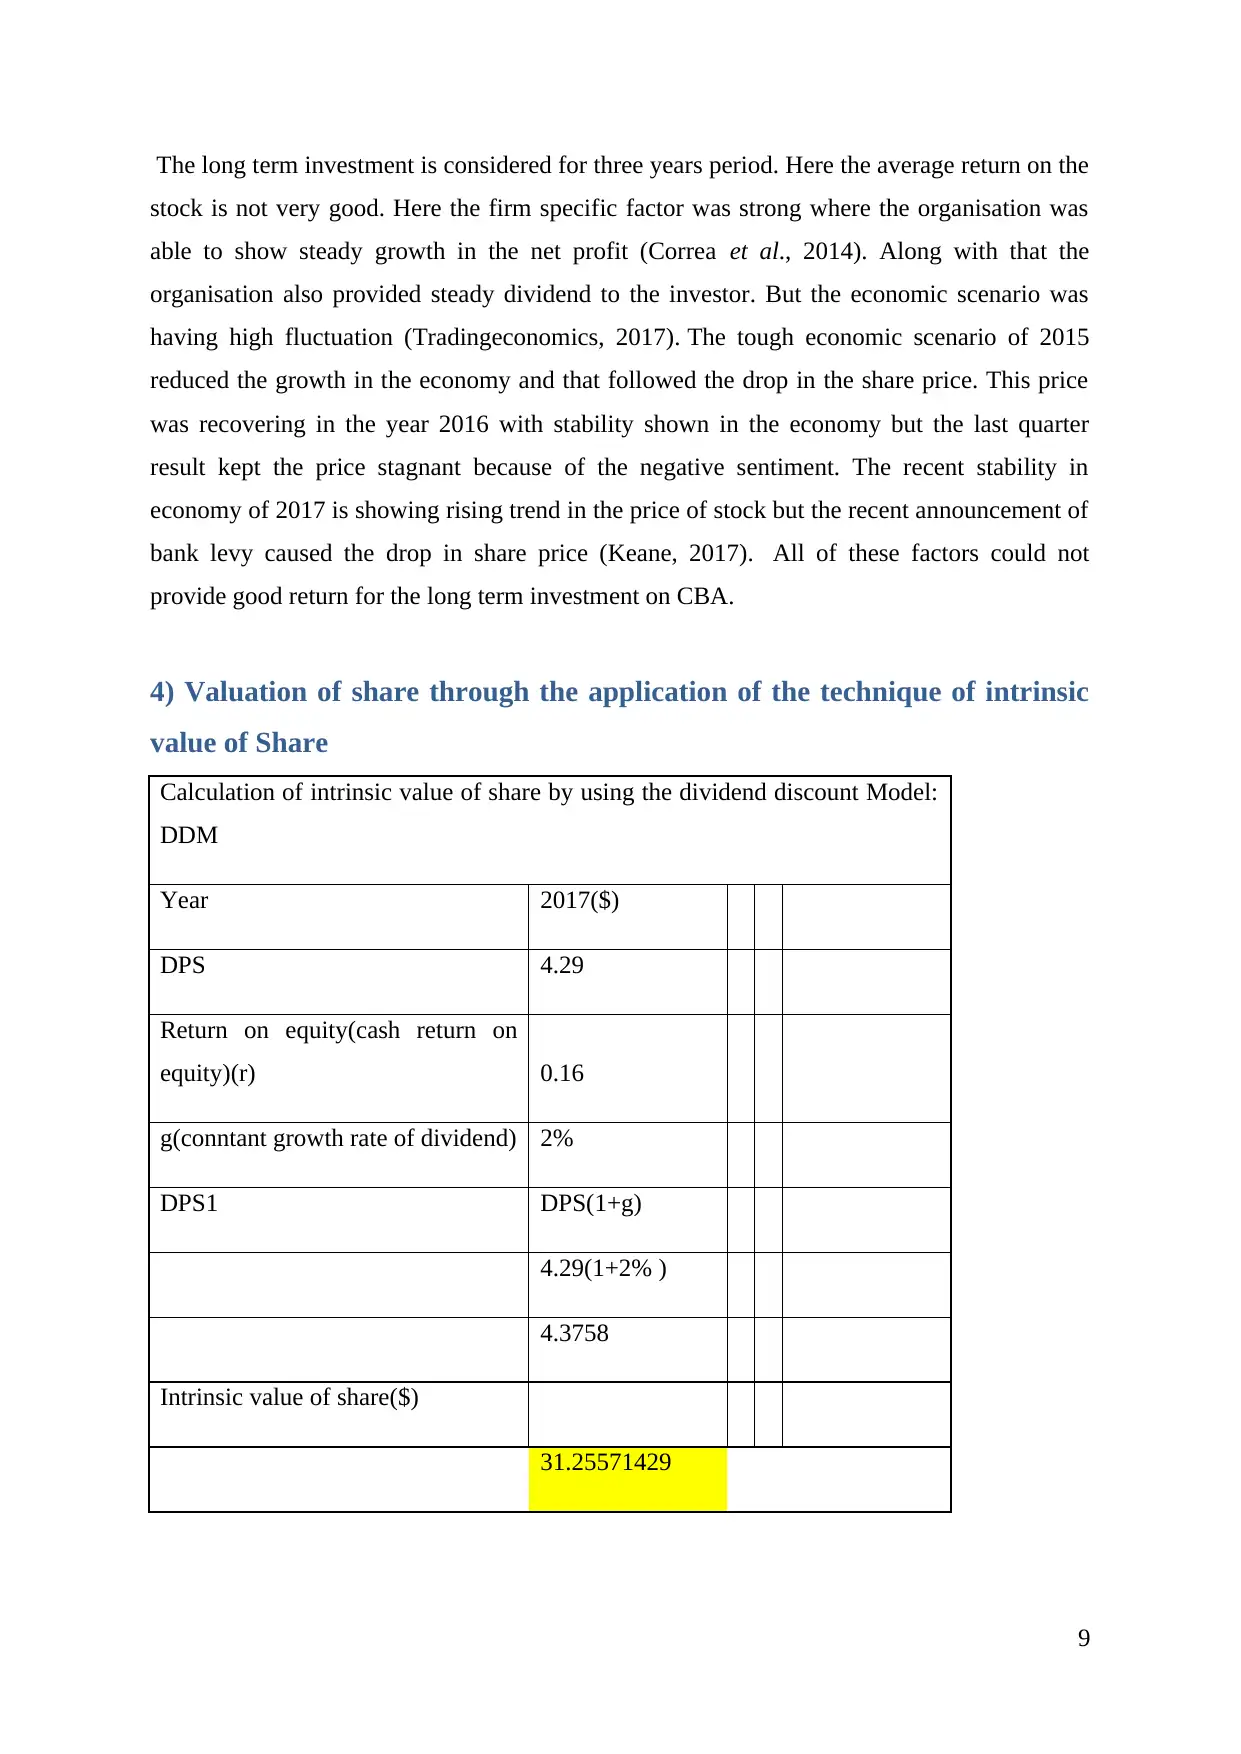
This report provides a comprehensive financial analysis of the Commonwealth Bank of Australia (CBA), evaluating its investment potential. The report begins by assessing shareholder value, examining customer satisfaction, employee diversity and training, and shareholder returns. It then analyzes the bank's trade volume and share price history, including fluctuations and trading trends. The report investigates both short-term and long-term returns on investment in CBA stock, considering dividends and economic factors. Furthermore, it applies the dividend discount model to determine the intrinsic value of CBA shares and evaluates the bank's investment projects, focusing on capital adequacy ratios. The report also examines CBA's dividend policy and its relationship to earnings per share, as well as the company's capital structure, including debt-equity ratios. Finally, the report summarizes CBA as an investment opportunity, considering its financial performance and market position.
Document Page
Business finance
1
tabler-icon-diamond-filled.svg

Paraphrase This Document

Need a fresh take? Get an instant paraphrase of this document with our AI Paraphraser
Document Page
Table of Contents
1. Shareholder’s value................................................................................................................3
2. Trade volume and share price history....................................................................................5
3) Return for investing in the company......................................................................................6
4) Valuation of share through the application of the technique of intrinsic value of Share......9
5) Evaluation of the investment projects of the company........................................................10
6. Dividend policy...................................................................................................................11
7) Analysis of the capital structure of the company.................................................................13
8. Company as investment opportunity....................................................................................14
Reference..................................................................................................................................16
2
Document Page
The current report is focused to provide some valuable insights for the investment
opportunity. Here the ‘Commonwealth bank of Australia’ or CBA is taken for analysis
(Commbank, 2017). CBA is the leading financial institution in Australia which provides
services like premium and retail banking, institutional and business banking, superannuation,
fund management, insurance, share broking services and other investment services.
1. Shareholder’s value
Customer
The bank has been able to create value for their customer over the last decade. The indication
can be seen from the customer satisfaction level statistics in the bank. The customer
satisfaction has risen from 70.5% to 82.7% in the last decade (commbank, 2017). On the
other hand the customer also dissatisfaction dropped from the 9.8% to 3.8%. Both of the
indicators are showing that the positive customer sentiments are helpful for future operation
of the organisation.
[Source: commbank, 2017]
Employee
CBA considers their employee as one of the most important asset for the organisation. The
organisation wants to be the first preference for the employee in the industry. The employees
have an important role to fulfil the vision set by the organisation. The organisation embrace
diversity in their recruitment policy and they time to time invest in them to increase value.
The organisation employees around 40% people from other cultural background (commbank,
3
Document Page
2017). This diversified employee base helps the organisation to service the customer from
different community. Women fill around 44% of management role in the organisation. This
44% is greater than the overall full time female employee in the financial industry (WGEA.
(2016). The organisation invests to create around 39.1 hour of training time per employee.
[Source: WGEA, 2016]
Shareholder
[Source: commbank, 2017]
4
tabler-icon-diamond-filled.svg

Paraphrase This Document

Need a fresh take? Get an instant paraphrase of this document with our AI Paraphraser
Document Page
The shareholders of the company are also getting more value. The average returns for the
large banks in the year 2017was around 13.9% (Pollari, 2017). In comparison to the return of
the CBA, the record is far better. Last year’s performance shows that the bank was able to
deliver 17.4% return to the shareholders. This aspect is also shown that the bank is able to
create greater value for their stakeholders.
2. Trade volume and share price history
CBA trading analysis can be done on the basis of the following graph chart of CBA. The
chart is showing the share price movement of the company over last one year with respect to
the trading volume per day. The chart shows the price at 74.53 AUD on 13th October 2016
and 76.41 AUD as per 12 October 2017 (Au.finance.yahoo, 2017). These shows a 2.5% rise
in the share price for the company over the last year period. This figure does not show the
actual scenario of price change over the last year period. In the in the April 27 2017 the price
peaked at 87.74 AUD and hit ground at 70.89 AUD on 9th November 2016. So within a year
the share price fluctuated by around 24%. The price is the primary indicator of the stock
performance in the stoke exchange (Brown, 2012). On the other hand the volume traded is
the secondary indicator for the share price and performance trend over the stoke exchange.
The average volume over the year remained at 4 million (The Sydney Morning Herald,
2017). The graph below quite shows a trend where the volume of trade has increased when
the share price dropped sharply. The peak share prices are not supported by the trade volume
(Brown, 2012). That means that when price dropped it happened with great volume which is
quite higher in comparison to price increasing period. The current upward movement of the
share price is having around 2 to 2.5 million trade volume (Au.finance.yahoo, 2017). The
rising price of share is not supported by the market interest in the stock. So in the short run
the reversal of the trend is quite possible.
5
Document Page
[Source: The Sydney Morning Herald, 2017]
3) Return for investing in the company
Short term return on stock
On 13th October 2016 the closing stock price was 74.53 AUD and it is taken as purchase
value of stock.
On 22nd February dividend paid 4.29 AUD per share.
On 12th October 2017 the closing stock price was 76.41 AUD and it is taken as selling value
of the stock.
So the return = [(76.41+4.29)-74.53] / 74.53 = 0.123 or the 12.3%
This hypothetical investment is showing a 12.3% annual return from investing on the stock of
CBA. The internal factor of the CBA can justify the growth. The net profit of the bank is
showing a rising trend. The profit grew at 4.61% over the last year (commbank, 2017). In
6
Document Page
accordance to that the organisation paid a dividend to the investor. But the share price did not
provided much of return within this one year period. Banking sector invest in the economy
directly (Correa et al., 2014). So the share price moves in accordance with the economic up
and down. In the current year the fluctuation of economic growth has shown the similar trend
on the CBA stock price (Duan & Stanley, 2011). But a strong firm specific factor has
provided the good return to the stock at the end of the day.
[Source: commbank, 2017]
[Source: Tradingeconomics, 2017]
7
tabler-icon-diamond-filled.svg

Paraphrase This Document

Need a fresh take? Get an instant paraphrase of this document with our AI Paraphraser
Document Page
[Source: The Sydney Morning Herald, 2017]
Long term return on stock
On 13th October 2014 the closing stock price was 73.73 AUD and it is taken as purchase
value of stock.
Dividends paid for last three year are 4.2, 4.2 and 4.29 for the year 2015, 2016, and 2017
respectively.
On 12th October 2017 the closing stock price was 76.41 AUD and it is taken as selling value
of the stock.
So the return = [(76.41+4.2+4.2+4.29)-73.73] / 73.73 = 0.1949 or the 19.49% in last three
year/
So the return per year is 19.49/3 = 6.49%.
8
Document Page
The long term investment is considered for three years period. Here the average return on the
stock is not very good. Here the firm specific factor was strong where the organisation was
able to show steady growth in the net profit (Correa et al., 2014). Along with that the
organisation also provided steady dividend to the investor. But the economic scenario was
having high fluctuation (Tradingeconomics, 2017). The tough economic scenario of 2015
reduced the growth in the economy and that followed the drop in the share price. This price
was recovering in the year 2016 with stability shown in the economy but the last quarter
result kept the price stagnant because of the negative sentiment. The recent stability in
economy of 2017 is showing rising trend in the price of stock but the recent announcement of
bank levy caused the drop in share price (Keane, 2017). All of these factors could not
provide good return for the long term investment on CBA.
4) Valuation of share through the application of the technique of intrinsic
value of Share
Calculation of intrinsic value of share by using the dividend discount Model:
DDM
Year 2017($)
DPS 4.29
Return on equity(cash return on
equity)(r) 0.16
g(conntant growth rate of dividend) 2%
DPS1 DPS(1+g)
4.29(1+2% )
4.3758
Intrinsic value of share($)
31.25571429
9
Document Page
The dividend discount model is the model which uses the expected value of dividend per
share for estimating the future intrinsic value of share. In this model it is assumed that the g is
constant over period and the cost of equity is 16% must be higher than the growth rate of
Dividends paid per share over years (2%)
Here the expected Share price is $31.22 which is much lower than the current price$76.41,
Therefore the share of the company is currently overvalued and therefore expected to decline
in near future (Pearl & Rosenbaum, 2013). Therefore it is recommended that existing share
holders should sale share and buying of new shares is not recommended.
5) Evaluation of the investment projects of the company
It is essential for the banks to maintain minimum capital adequacy ratios as it is a critical
indicator which indicates to that the bank is having enough cushion of fund to absorb a
substantial amount of losses before the bank becomes bankrupt and will consequently lose
the fund of the depositors (Hull, 2014).
The capital adequacy ratio is also an indirect indicator of the return of asset of the bank or
investments made by the banking organization (Levy, 2015). A banking organization has
funded all their assets through investments. Again a banking organization is involved in
investments through loan funding to the borrowers.
10
Year 2016 2017
DPS($) 4.2 4.29
g 2%
tabler-icon-diamond-filled.svg

Paraphrase This Document

Need a fresh take? Get an instant paraphrase of this document with our AI Paraphraser
Document Page
The capital adequacy ratio has been calculated for both the tire-1 & tire-2 capital of the
company. Tire-1 capital is those that are easily available at the event of loss coverage (Levy,
2015). The bank will only use the tire-2 capital if it is going to wind up.
A bank that is having a minimum of 8% investment is defined as a secured and solvent bank
for the investors. Here the current banking organization is having a total of capital adequacy
ratio of 14.2% in 2017 and in 2016 it was around 14.3%.This indicates that the bank is
capable to earn good cash return from the investments made by the company in Short run
(Hull, 2014).
If we look at the capital adequacy ratio of the banking organization between 2014-2017 then
it can be seen it was not only above 8 but has increased from 11% to 14%.Thus the long term
cash investment pattern of the company has managed to make good return on investments
6. Dividend policy
[Source: commbank, 2017]
11
Document Page
[Source: Mckenna, 2016]
The above first bar chart is showing the CBA’s dividend history for last 7 years. After the
year 2011 the dividend given by the company shows more or less an upward trend
(Sharedividends, 2017). CBA is a moderate dividend yield stock considering the industry
average of of Australian major banks, shown in the second bar chart. 2017’s dividend given
per share for the company is 4.29 AUD and the current earnings per share for the company
are 0.33 AUD. The company currently is paying around 75% dividend from the share of
profit. The organisation has around 800k shareholder of retail type. Considering that an
average return for a share holder would be 3820 AUD. The current payout ratio for the
dividend is 75%. Comparing the price of share with the dividend given shows a different
picture. From the 2015 onward the amount of dividend has been increased but the share
prices continue to drop or moved sidewise. The dividend payout should maximise the value
of the shareholder (Shao et al., 2013). The bar diagrams below shows the EPS figure for last
7 years. A close observation reveals that the dividend of the company is following the EPS
figure or its growth pattern. So it can be said the dividend policy of the business is a
progressive one (Shao et al., 2013). The organisation net profit is also rising and in
accordance to that the organisation would be able to follow the current dividend policy. The
dividend policy of CBA does not follow the share price movement. The debt factor is high
for the business as seen in the leverage ratio so continuous payment of high dividend may not
become sustainable for the organisation.
12
chevron_up_icon
1 out of 17
circle_padding
hide_on_mobile
zoom_out_icon
[object Object]