Corporate Accounting Analysis: Commonwealth vs Westpac Banks
VerifiedAdded on 2023/06/05
|22
|4540
|97
Report
AI Summary
This report undertakes a comprehensive financial analysis of two prominent Australian banks, Commonwealth Bank and Westpac Bank, examining their financial performance through various components of their financial reports. The analysis delves into the equity section, discussing share capital, retained earnings, and reserves, and comparing the debt-equity ratios of both banks. The cash flow statements are scrutinized to understand the flow of cash from operating, investing, and financing activities, with a comparative analysis over three years. Furthermore, the report explores the comprehensive income statements, focusing on items reported in other comprehensive income, and their impact on managerial performance evaluation. Corporate income tax is also analyzed, including tax expenses, effective tax rates, deferred tax liabilities and assets, and cash tax calculations. The report concludes by providing insights into the efficiency of the organizations' working, based on the financial data and analysis.
CORPORATE ACCOUNTING
Paraphrase This Document
Need a fresh take? Get an instant paraphrase of this document with our AI Paraphraser

EXECUTIVE SUMMARY
This assignment is prepared to financially analyse two listed companies of Australia that
operates in the same industry. The financial reports of Common Wealth and Westpac Banks
has been analysed in this assignment. At the end of this report, the users will be able to have a
view about the efficiency of the organisation’s working.
Contents
INTRODUCTION......................................................................................................................3
ANALYSIS OF EQUITY..........................................................................................................4
Discussion on each item of equity for both the companies....................................................4
Discussion and debt and equity of both the companies..........................................................6
Analysis of Cash flow statement................................................................................................7
Discussion on the cash flow statement of both the companies..............................................7
Comparison of cash flow of three years of both the companies.............................................8
Description of analysis of cash flow of both the companies................................................10
Analysis of comprehensive income statement.........................................................................11
Items reported in the other comprehensive income statement.............................................11
Reasons for not reporting these items in the profit and loss statement................................11
Comparative analysis of the items of the other comprehensive income statement..............11
Use of other comprehensive income in evaluation of performance of managers................12
Analysis of corporate income tax.............................................................................................13
Tax expense for the companies for the current year.............................................................13
Effective income tax rate......................................................................................................13
Deferred tax liabilities and assets.........................................................................................13
Increase in DTA and DTL....................................................................................................14
Calculation of cash tax using the book tax...........................................................................14
Calculation of cash tax rate..................................................................................................16
Difference in cash tax and book tax.....................................................................................16
Conclusion............................................................................................................................17
Bibliography.............................................................................................................................18
⊘ This is a preview!⊘
Do you want full access?
Subscribe today to unlock all pages.
Trusted by 1+ million students worldwide

Paraphrase This Document
Need a fresh take? Get an instant paraphrase of this document with our AI Paraphraser
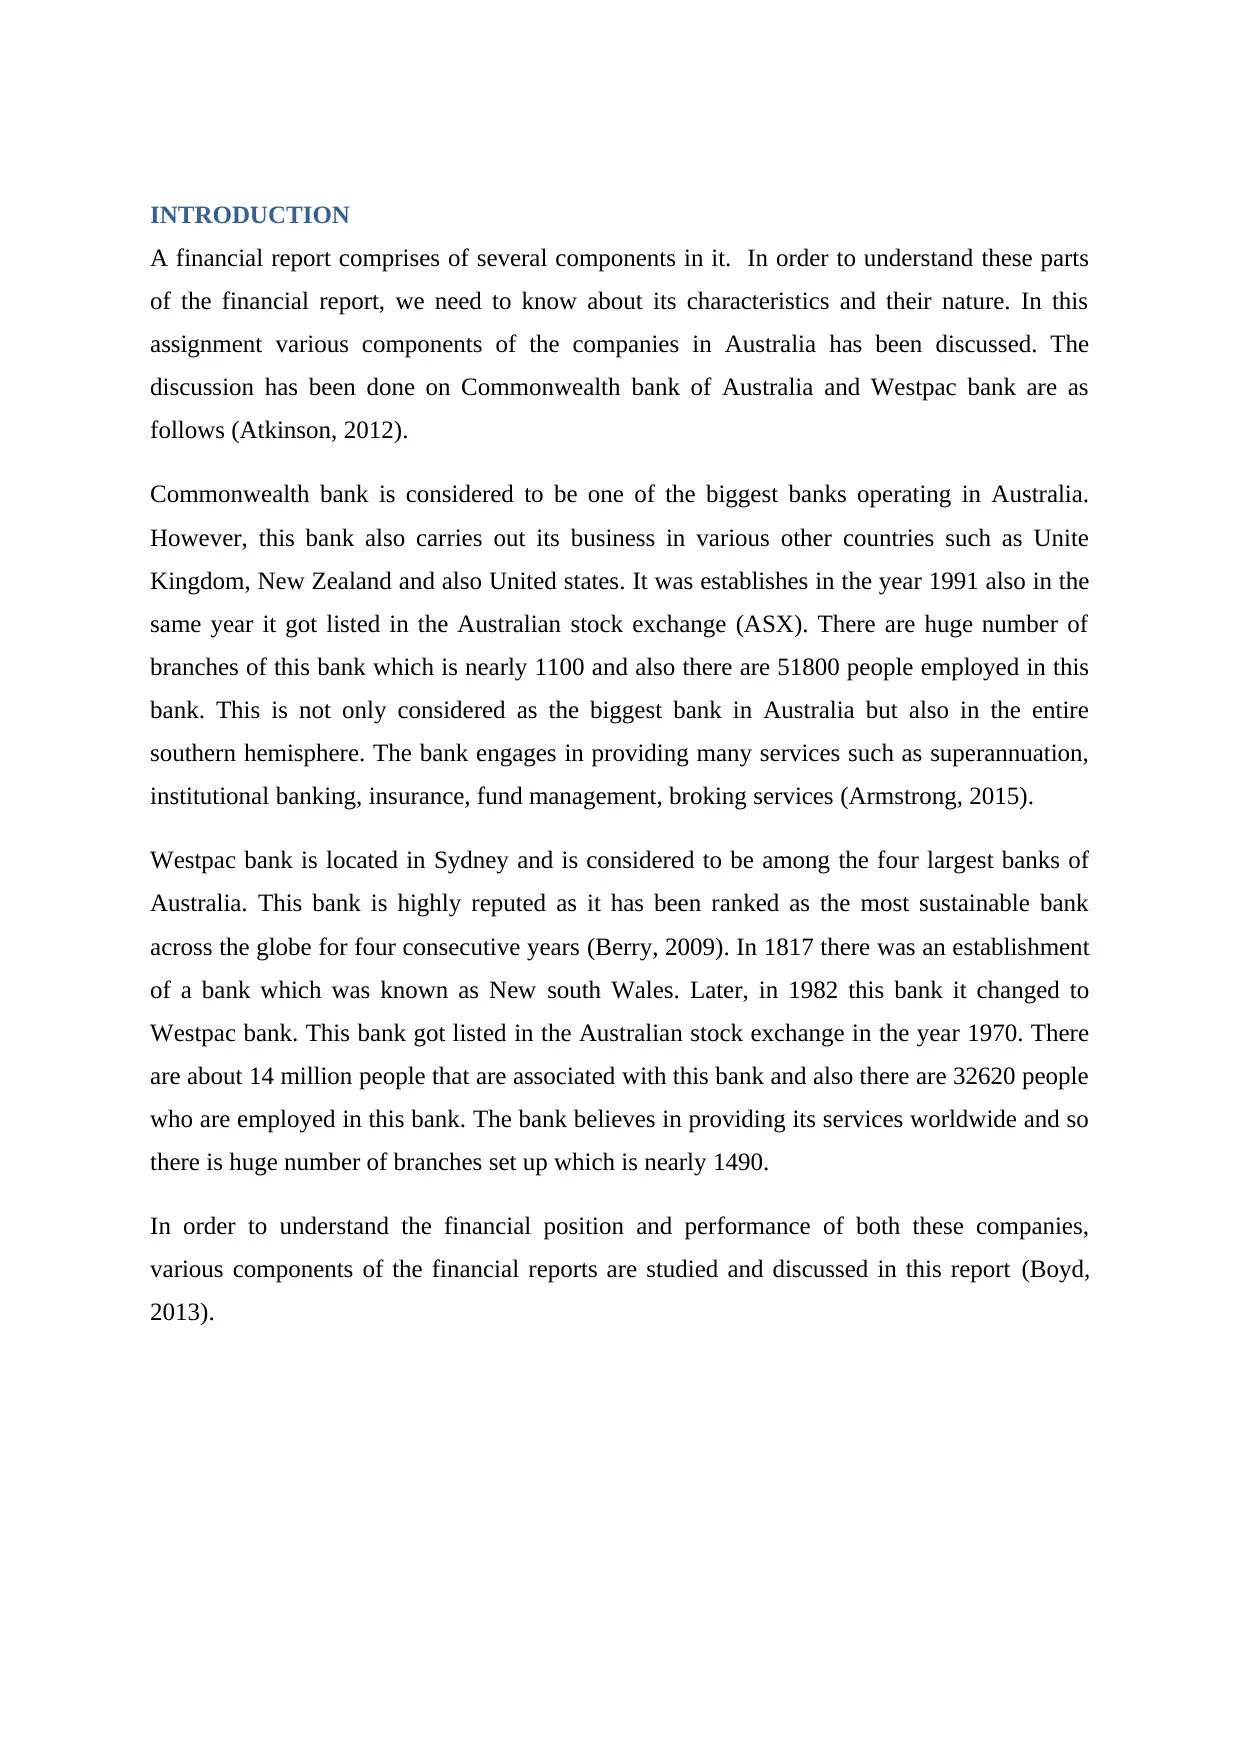
INTRODUCTION
A financial report comprises of several components in it. In order to understand these parts
of the financial report, we need to know about its characteristics and their nature. In this
assignment various components of the companies in Australia has been discussed. The
discussion has been done on Commonwealth bank of Australia and Westpac bank are as
follows (Atkinson, 2012).
Commonwealth bank is considered to be one of the biggest banks operating in Australia.
However, this bank also carries out its business in various other countries such as Unite
Kingdom, New Zealand and also United states. It was establishes in the year 1991 also in the
same year it got listed in the Australian stock exchange (ASX). There are huge number of
branches of this bank which is nearly 1100 and also there are 51800 people employed in this
bank. This is not only considered as the biggest bank in Australia but also in the entire
southern hemisphere. The bank engages in providing many services such as superannuation,
institutional banking, insurance, fund management, broking services (Armstrong, 2015).
Westpac bank is located in Sydney and is considered to be among the four largest banks of
Australia. This bank is highly reputed as it has been ranked as the most sustainable bank
across the globe for four consecutive years (Berry, 2009). In 1817 there was an establishment
of a bank which was known as New south Wales. Later, in 1982 this bank it changed to
Westpac bank. This bank got listed in the Australian stock exchange in the year 1970. There
are about 14 million people that are associated with this bank and also there are 32620 people
who are employed in this bank. The bank believes in providing its services worldwide and so
there is huge number of branches set up which is nearly 1490.
In order to understand the financial position and performance of both these companies,
various components of the financial reports are studied and discussed in this report (Boyd,
2013).
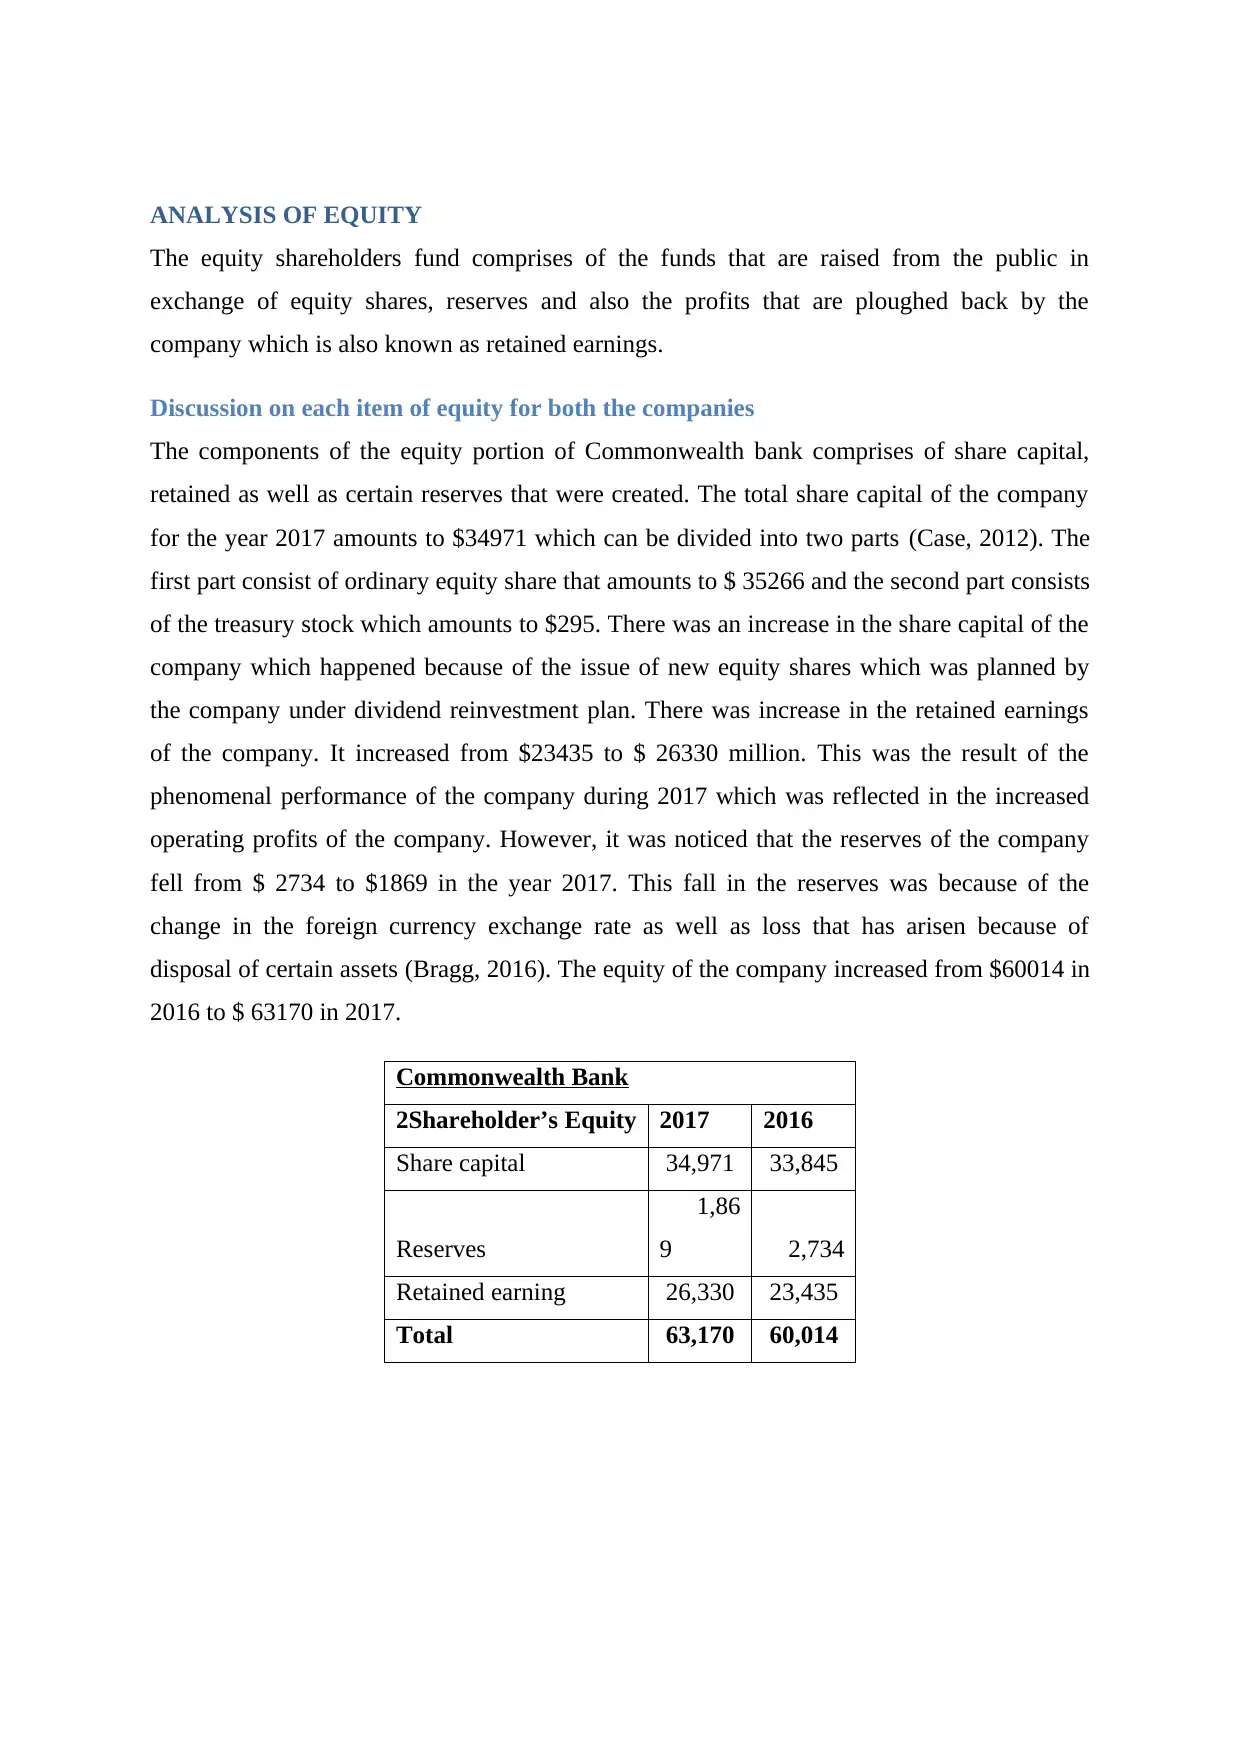
ANALYSIS OF EQUITY
The equity shareholders fund comprises of the funds that are raised from the public in
exchange of equity shares, reserves and also the profits that are ploughed back by the
company which is also known as retained earnings.
Discussion on each item of equity for both the companies
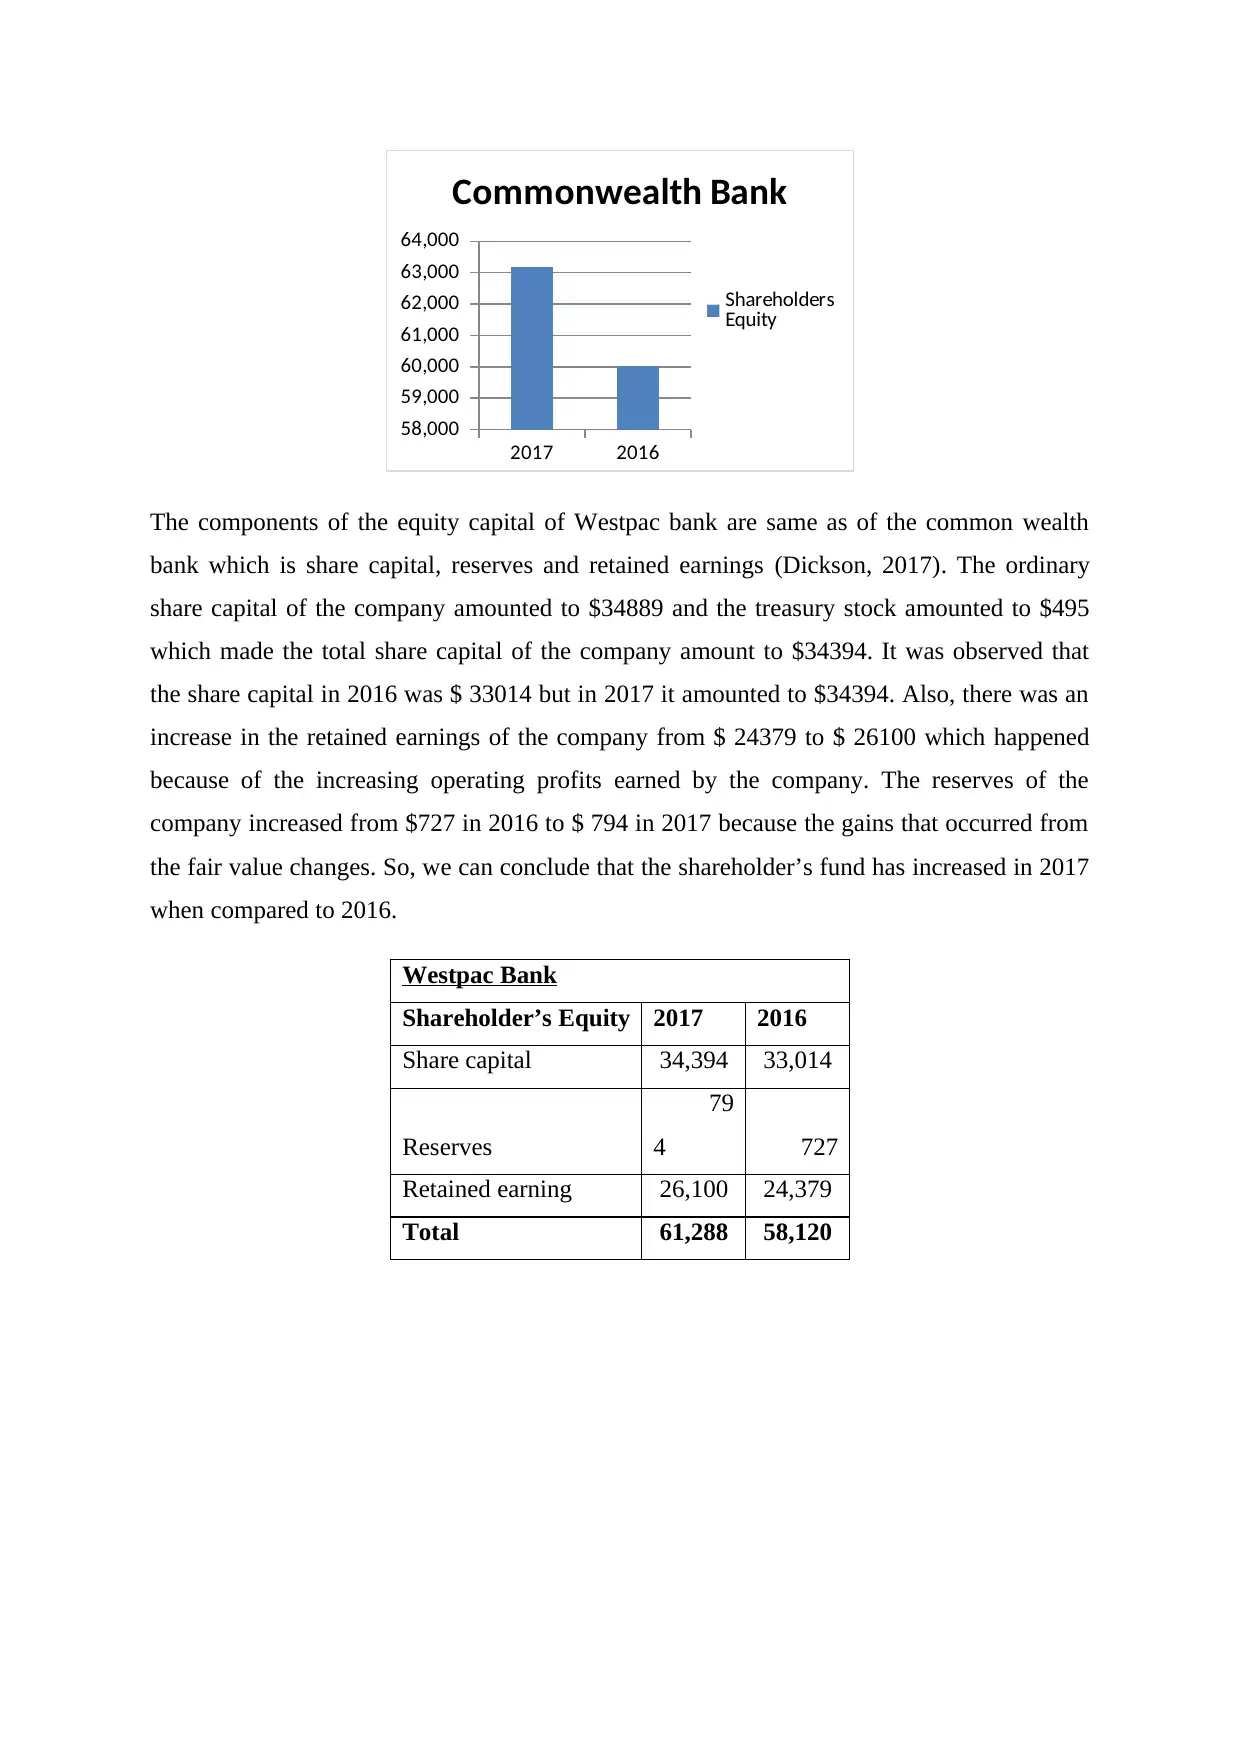
The components of the equity portion of Commonwealth bank comprises of share capital,
retained as well as certain reserves that were created. The total share capital of the company
for the year 2017 amounts to $34971 which can be divided into two parts (Case, 2012). The
first part consist of ordinary equity share that amounts to $ 35266 and the second part consists
of the treasury stock which amounts to $295. There was an increase in the share capital of the
company which happened because of the issue of new equity shares which was planned by
the company under dividend reinvestment plan. There was increase in the retained earnings
of the company. It increased from $23435 to $ 26330 million. This was the result of the
phenomenal performance of the company during 2017 which was reflected in the increased
operating profits of the company. However, it was noticed that the reserves of the company
fell from $ 2734 to $1869 in the year 2017. This fall in the reserves was because of the
change in the foreign currency exchange rate as well as loss that has arisen because of
disposal of certain assets (Bragg, 2016). The equity of the company increased from $60014 in
2016 to $ 63170 in 2017.
Commonwealth Bank
2Shareholder’s Equity 2017 2016
Share capital 34,971 33,845
Reserves
1,86
9 2,734
Retained earning 26,330 23,435
Total 63,170 60,014
The equity shareholders fund comprises of the funds that are raised from the public in
exchange of equity shares, reserves and also the profits that are ploughed back by the
company which is also known as retained earnings.
Discussion on each item of equity for both the companies
The components of the equity portion of Commonwealth bank comprises of share capital,
retained as well as certain reserves that were created. The total share capital of the company
for the year 2017 amounts to $34971 which can be divided into two parts (Case, 2012). The
first part consist of ordinary equity share that amounts to $ 35266 and the second part consists
of the treasury stock which amounts to $295. There was an increase in the share capital of the
company which happened because of the issue of new equity shares which was planned by
the company under dividend reinvestment plan. There was increase in the retained earnings
of the company. It increased from $23435 to $ 26330 million. This was the result of the
phenomenal performance of the company during 2017 which was reflected in the increased
operating profits of the company. However, it was noticed that the reserves of the company
fell from $ 2734 to $1869 in the year 2017. This fall in the reserves was because of the
change in the foreign currency exchange rate as well as loss that has arisen because of
disposal of certain assets (Bragg, 2016). The equity of the company increased from $60014 in
2016 to $ 63170 in 2017.
Commonwealth Bank
2Shareholder’s Equity 2017 2016
Share capital 34,971 33,845
Reserves
1,86
9 2,734
Retained earning 26,330 23,435
Total 63,170 60,014
⊘ This is a preview!⊘
Do you want full access?
Subscribe today to unlock all pages.
Trusted by 1+ million students worldwide
2017 2016
58,000
59,000
60,000
61,000
62,000
63,000
64,000
Commonwealth Bank
Shareholders
Equity
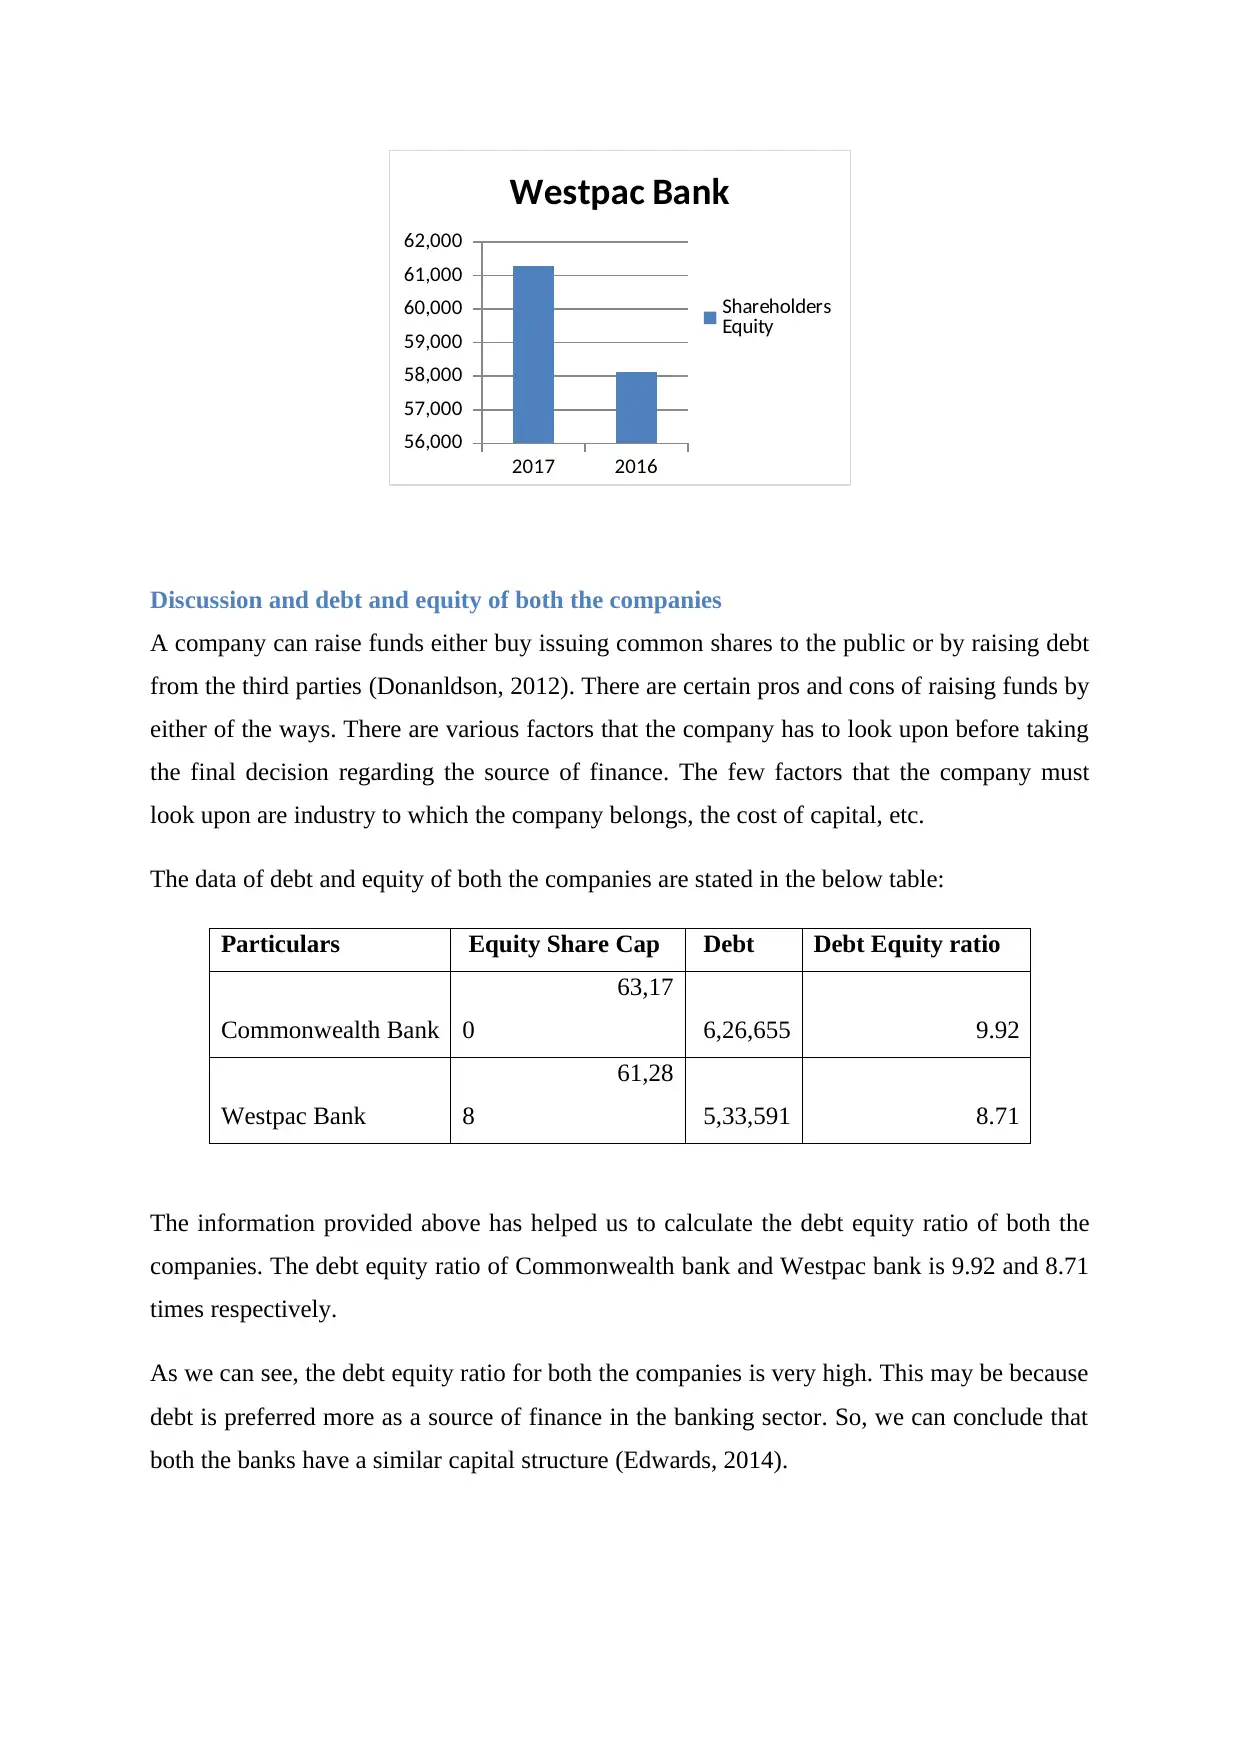
The components of the equity capital of Westpac bank are same as of the common wealth
bank which is share capital, reserves and retained earnings (Dickson, 2017). The ordinary
share capital of the company amounted to $34889 and the treasury stock amounted to $495
which made the total share capital of the company amount to $34394. It was observed that
the share capital in 2016 was $ 33014 but in 2017 it amounted to $34394. Also, there was an
increase in the retained earnings of the company from $ 24379 to $ 26100 which happened
because of the increasing operating profits earned by the company. The reserves of the
company increased from $727 in 2016 to $ 794 in 2017 because the gains that occurred from
the fair value changes. So, we can conclude that the shareholder’s fund has increased in 2017
when compared to 2016.
Westpac Bank
Shareholder’s Equity 2017 2016
Share capital 34,394 33,014
Reserves
79
4 727
Retained earning 26,100 24,379
Total 61,288 58,120
58,000
59,000
60,000
61,000
62,000
63,000
64,000
Commonwealth Bank
Shareholders
Equity
The components of the equity capital of Westpac bank are same as of the common wealth
bank which is share capital, reserves and retained earnings (Dickson, 2017). The ordinary
share capital of the company amounted to $34889 and the treasury stock amounted to $495
which made the total share capital of the company amount to $34394. It was observed that
the share capital in 2016 was $ 33014 but in 2017 it amounted to $34394. Also, there was an
increase in the retained earnings of the company from $ 24379 to $ 26100 which happened
because of the increasing operating profits earned by the company. The reserves of the
company increased from $727 in 2016 to $ 794 in 2017 because the gains that occurred from
the fair value changes. So, we can conclude that the shareholder’s fund has increased in 2017
when compared to 2016.
Westpac Bank
Shareholder’s Equity 2017 2016
Share capital 34,394 33,014
Reserves
79
4 727
Retained earning 26,100 24,379
Total 61,288 58,120
Paraphrase This Document
Need a fresh take? Get an instant paraphrase of this document with our AI Paraphraser
2017 2016
56,000
57,000
58,000
59,000
60,000
61,000
62,000
Westpac Bank
Shareholders
Equity
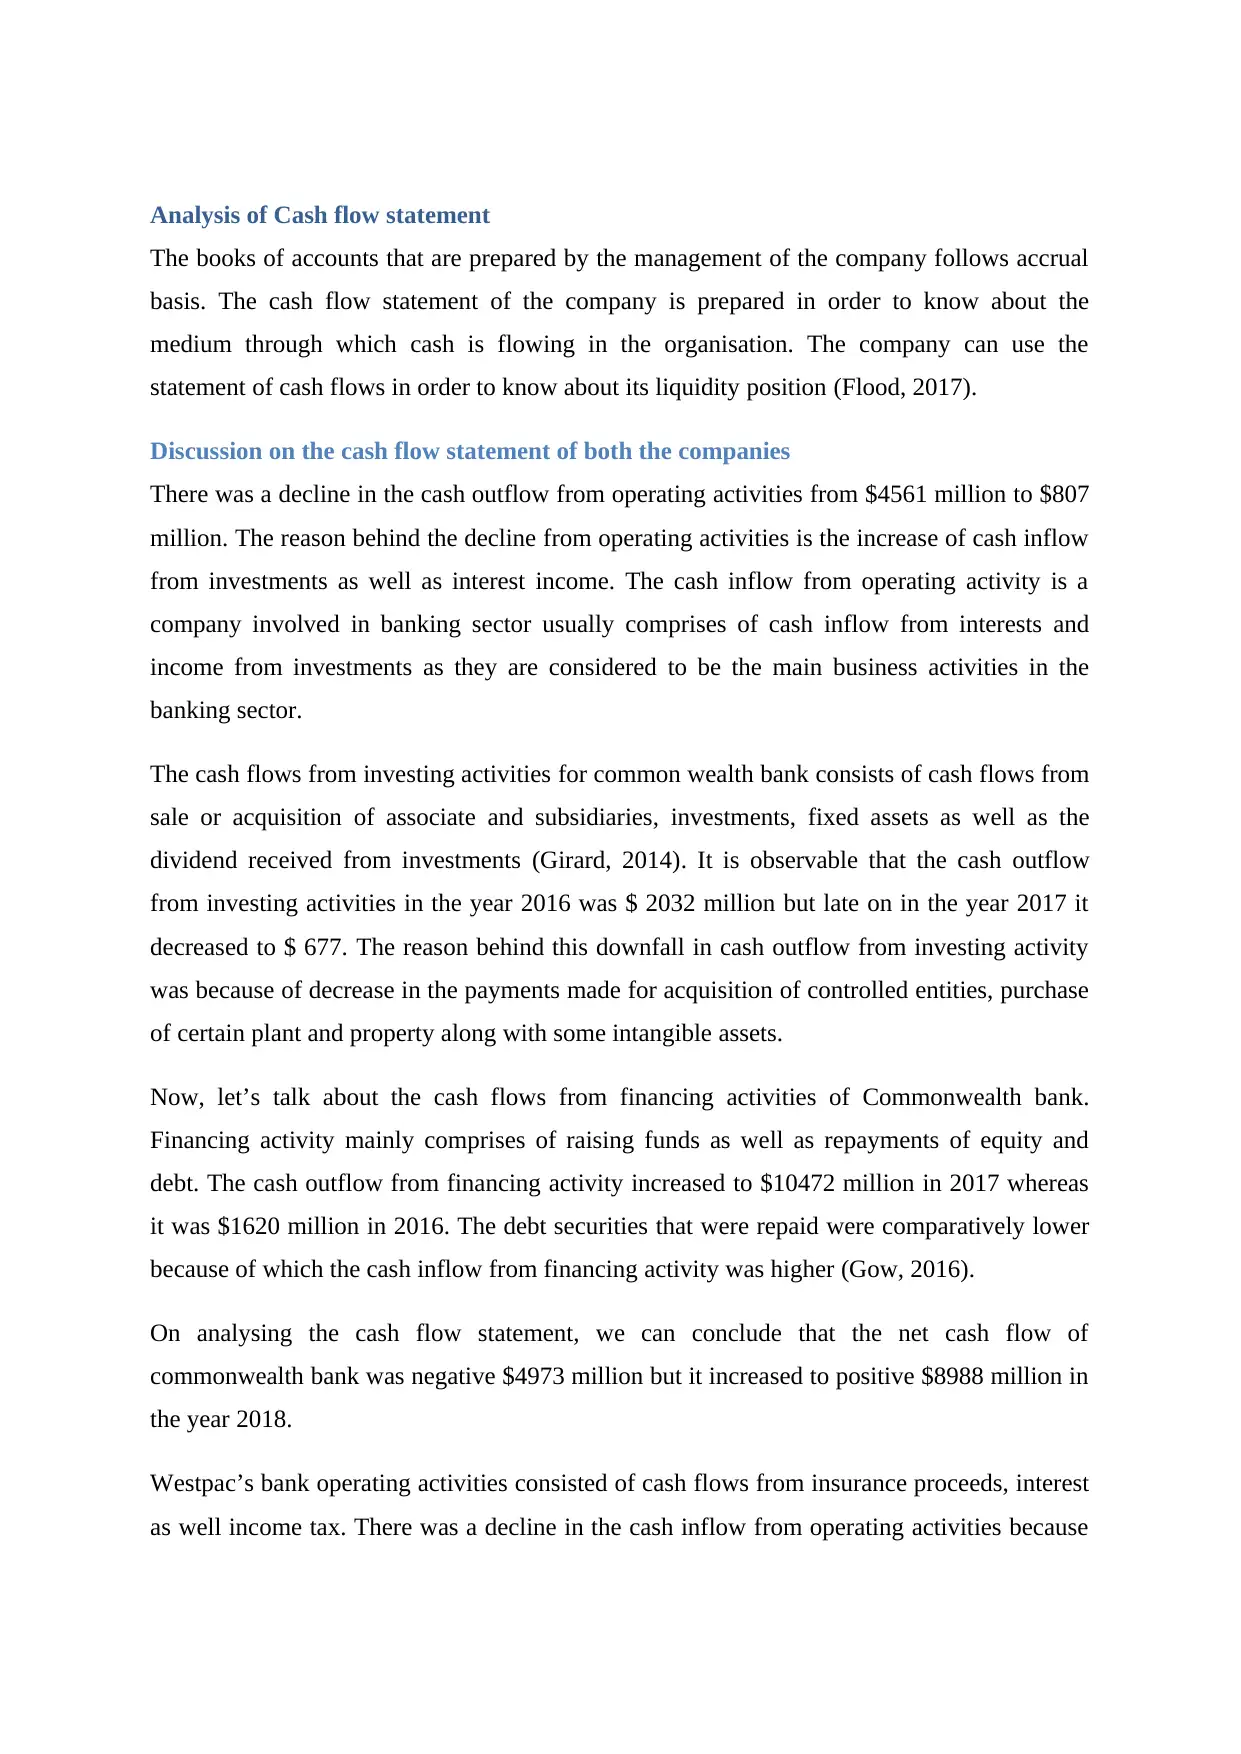
Discussion and debt and equity of both the companies
A company can raise funds either buy issuing common shares to the public or by raising debt
from the third parties (Donanldson, 2012). There are certain pros and cons of raising funds by
either of the ways. There are various factors that the company has to look upon before taking
the final decision regarding the source of finance. The few factors that the company must
look upon are industry to which the company belongs, the cost of capital, etc.
The data of debt and equity of both the companies are stated in the below table:
Particulars Equity Share Cap Debt Debt Equity ratio
Commonwealth Bank
63,17
0 6,26,655 9.92
Westpac Bank
61,28
8 5,33,591 8.71
The information provided above has helped us to calculate the debt equity ratio of both the
companies. The debt equity ratio of Commonwealth bank and Westpac bank is 9.92 and 8.71
times respectively.
As we can see, the debt equity ratio for both the companies is very high. This may be because
debt is preferred more as a source of finance in the banking sector. So, we can conclude that
both the banks have a similar capital structure (Edwards, 2014).
56,000
57,000
58,000
59,000
60,000
61,000
62,000
Westpac Bank
Shareholders
Equity
Discussion and debt and equity of both the companies
A company can raise funds either buy issuing common shares to the public or by raising debt
from the third parties (Donanldson, 2012). There are certain pros and cons of raising funds by
either of the ways. There are various factors that the company has to look upon before taking
the final decision regarding the source of finance. The few factors that the company must
look upon are industry to which the company belongs, the cost of capital, etc.
The data of debt and equity of both the companies are stated in the below table:
Particulars Equity Share Cap Debt Debt Equity ratio
Commonwealth Bank
63,17
0 6,26,655 9.92
Westpac Bank
61,28
8 5,33,591 8.71
The information provided above has helped us to calculate the debt equity ratio of both the
companies. The debt equity ratio of Commonwealth bank and Westpac bank is 9.92 and 8.71
times respectively.
As we can see, the debt equity ratio for both the companies is very high. This may be because
debt is preferred more as a source of finance in the banking sector. So, we can conclude that
both the banks have a similar capital structure (Edwards, 2014).
Analysis of Cash flow statement
The books of accounts that are prepared by the management of the company follows accrual
basis. The cash flow statement of the company is prepared in order to know about the
medium through which cash is flowing in the organisation. The company can use the
statement of cash flows in order to know about its liquidity position (Flood, 2017).
Discussion on the cash flow statement of both the companies
There was a decline in the cash outflow from operating activities from $4561 million to $807
million. The reason behind the decline from operating activities is the increase of cash inflow
from investments as well as interest income. The cash inflow from operating activity is a
company involved in banking sector usually comprises of cash inflow from interests and
income from investments as they are considered to be the main business activities in the
banking sector.
The cash flows from investing activities for common wealth bank consists of cash flows from
sale or acquisition of associate and subsidiaries, investments, fixed assets as well as the
dividend received from investments (Girard, 2014). It is observable that the cash outflow
from investing activities in the year 2016 was $ 2032 million but late on in the year 2017 it
decreased to $ 677. The reason behind this downfall in cash outflow from investing activity
was because of decrease in the payments made for acquisition of controlled entities, purchase
of certain plant and property along with some intangible assets.
Now, let’s talk about the cash flows from financing activities of Commonwealth bank.
Financing activity mainly comprises of raising funds as well as repayments of equity and
debt. The cash outflow from financing activity increased to $10472 million in 2017 whereas
it was $1620 million in 2016. The debt securities that were repaid were comparatively lower
because of which the cash inflow from financing activity was higher (Gow, 2016).
On analysing the cash flow statement, we can conclude that the net cash flow of
commonwealth bank was negative $4973 million but it increased to positive $8988 million in
the year 2018.
Westpac’s bank operating activities consisted of cash flows from insurance proceeds, interest
as well income tax. There was a decline in the cash inflow from operating activities because
⊘ This is a preview!⊘
Do you want full access?
Subscribe today to unlock all pages.
Trusted by 1+ million students worldwide
of the fall in the fair value of the investments. The cash inflow declined from $5497 in 2016
to $2820 in 2017.
Westpac’s investing activities consists of buying and selling of different securities or assets
(tangible as well as intangible). There was a decline in the cash outflow from investing
activities from $7245 in 2016 to $1698 in 2017. There were a lot of securities that were sold
and therefore, the cash outflow declined (Holtzman, 2013).
The financing activity of the Westpac’s bank consisted of raising funds or making repayment
of equity and debt securities. There was a fall in the cash inflow from financing activity to
552 million whereas it was $4573 in 2016. The reason behind this decreased cash inflow was
the cash outflow for repayments of debt (Horngren, 2012).
The overall cash flow for Westpac’s bank was $1674 million in 2017 and $2825 in 2016.
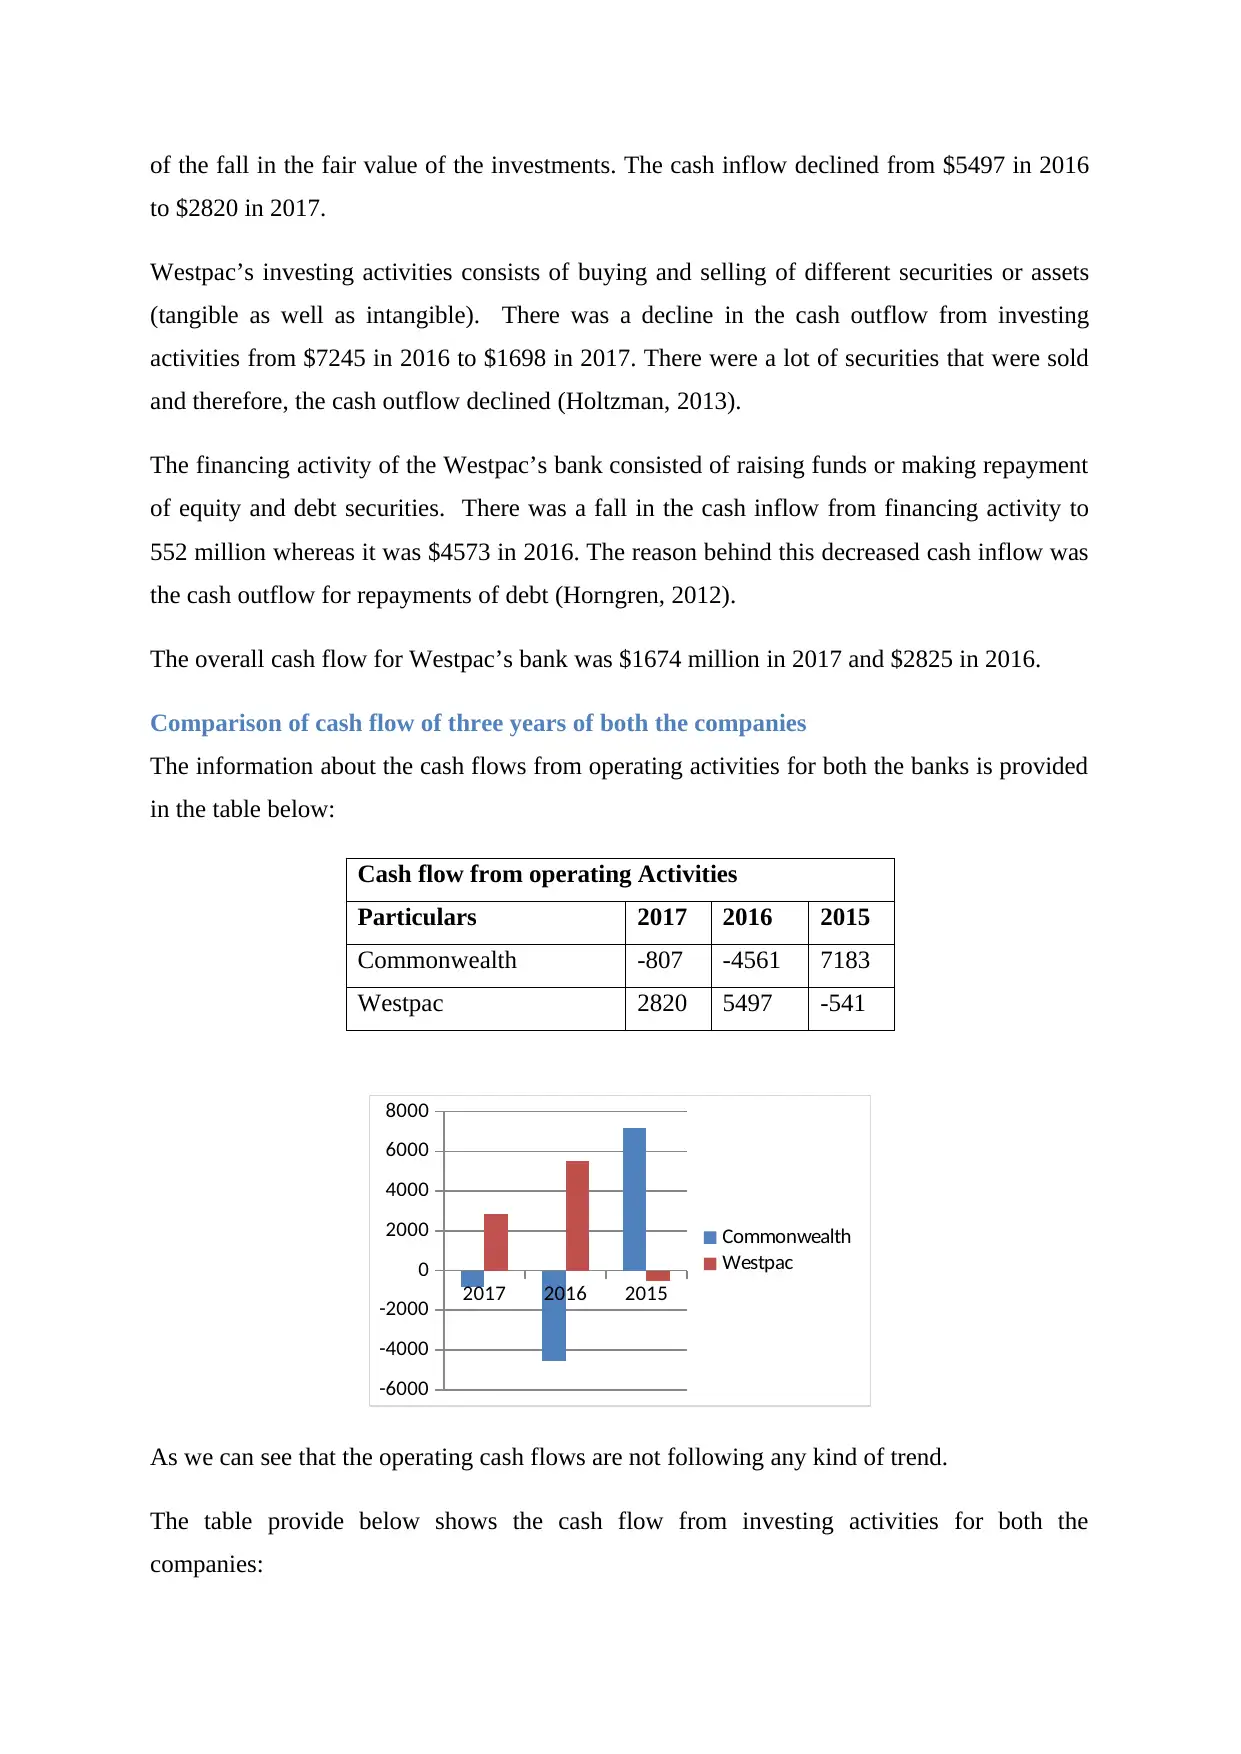
Comparison of cash flow of three years of both the companies
The information about the cash flows from operating activities for both the banks is provided
in the table below:
Cash flow from operating Activities
Particulars 2017 2016 2015
Commonwealth -807 -4561 7183
Westpac 2820 5497 -541
2017 2016 2015
-6000
-4000
-2000
0
2000
4000
6000
8000
Commonwealth
Westpac
As we can see that the operating cash flows are not following any kind of trend.
The table provide below shows the cash flow from investing activities for both the
companies:
to $2820 in 2017.
Westpac’s investing activities consists of buying and selling of different securities or assets
(tangible as well as intangible). There was a decline in the cash outflow from investing
activities from $7245 in 2016 to $1698 in 2017. There were a lot of securities that were sold
and therefore, the cash outflow declined (Holtzman, 2013).
The financing activity of the Westpac’s bank consisted of raising funds or making repayment
of equity and debt securities. There was a fall in the cash inflow from financing activity to
552 million whereas it was $4573 in 2016. The reason behind this decreased cash inflow was
the cash outflow for repayments of debt (Horngren, 2012).
The overall cash flow for Westpac’s bank was $1674 million in 2017 and $2825 in 2016.
Comparison of cash flow of three years of both the companies
The information about the cash flows from operating activities for both the banks is provided
in the table below:
Cash flow from operating Activities
Particulars 2017 2016 2015
Commonwealth -807 -4561 7183
Westpac 2820 5497 -541
2017 2016 2015
-6000
-4000
-2000
0
2000
4000
6000
8000
Commonwealth
Westpac
As we can see that the operating cash flows are not following any kind of trend.
The table provide below shows the cash flow from investing activities for both the
companies:
Paraphrase This Document
Need a fresh take? Get an instant paraphrase of this document with our AI Paraphraser
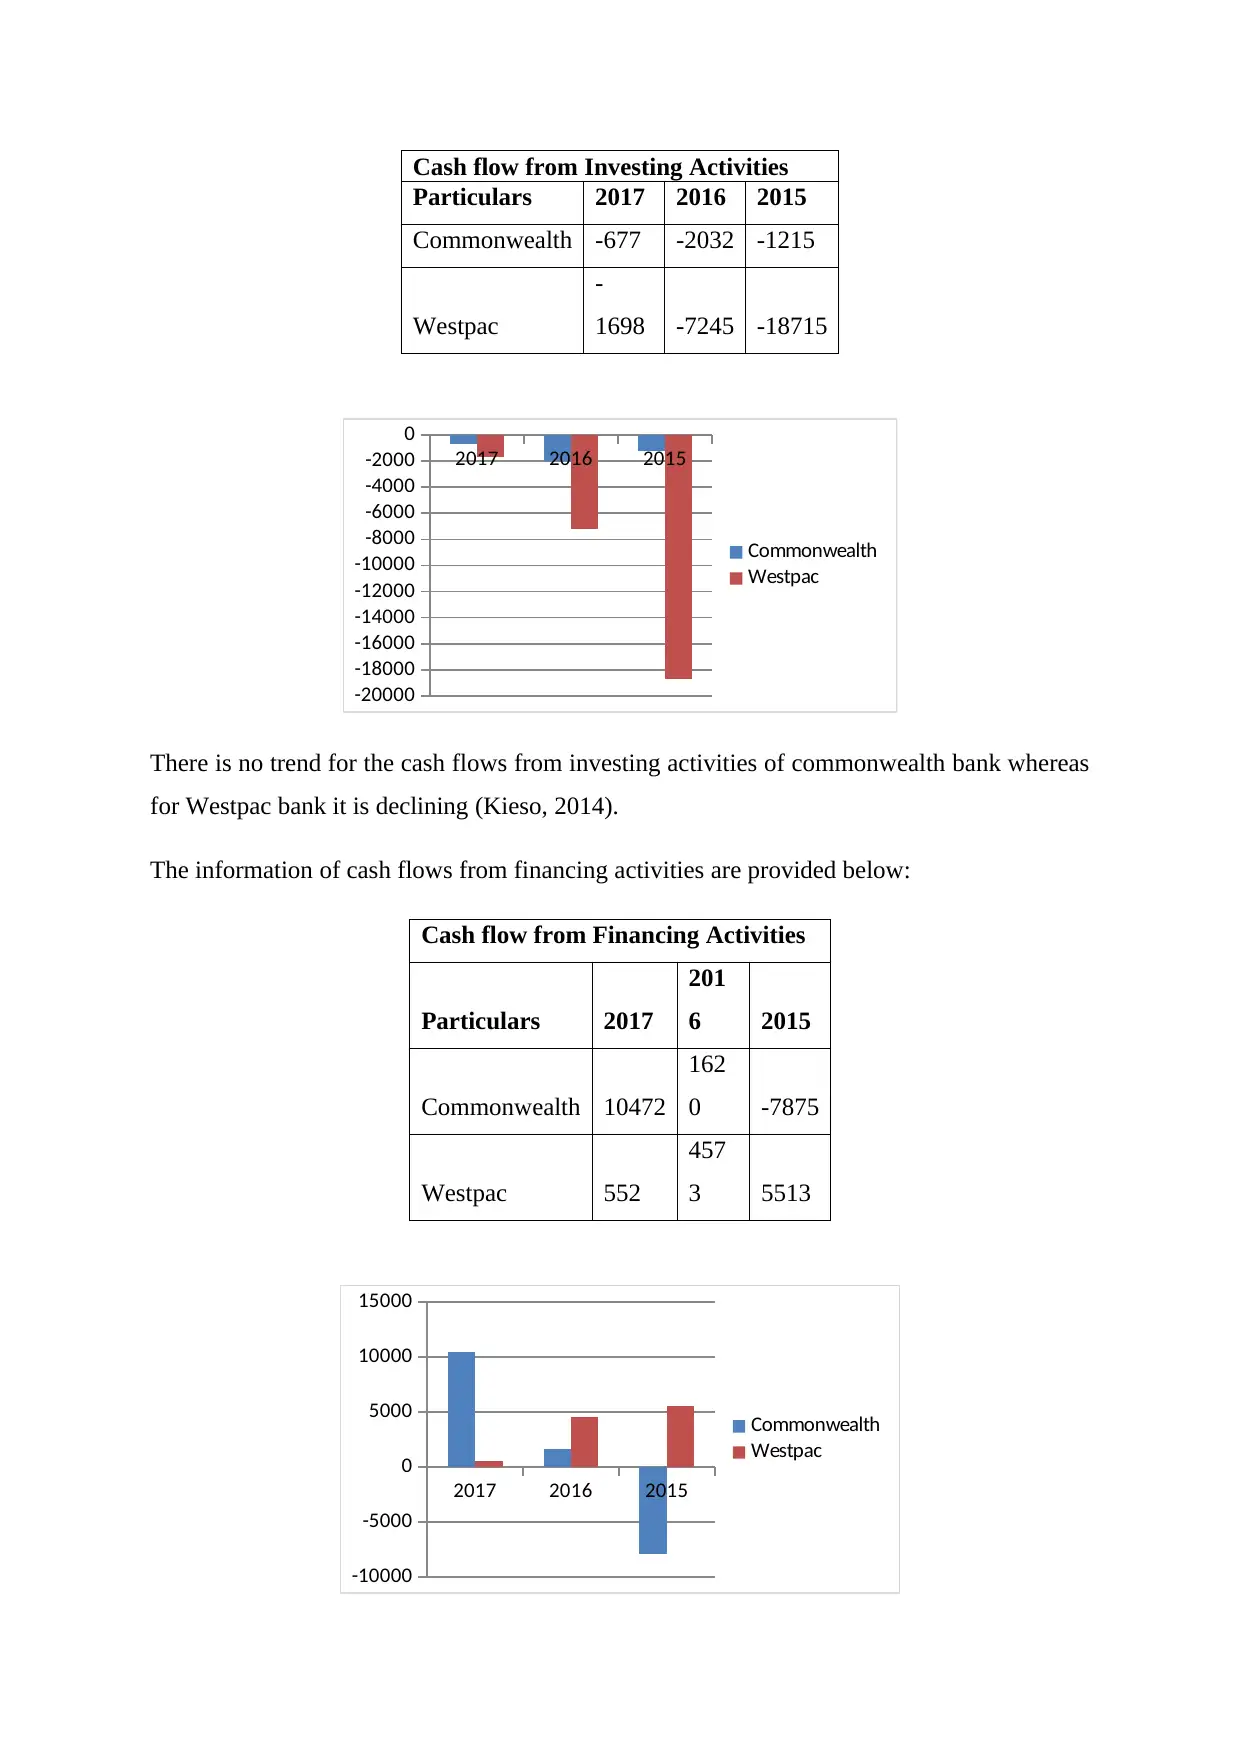
Cash flow from Investing Activities
Particulars 2017 2016 2015
Commonwealth -677 -2032 -1215
Westpac
-
1698 -7245 -18715
2017 2016 2015
-20000
-18000
-16000
-14000
-12000
-10000
-8000
-6000
-4000
-2000
0
Commonwealth
Westpac
There is no trend for the cash flows from investing activities of commonwealth bank whereas
for Westpac bank it is declining (Kieso, 2014).
The information of cash flows from financing activities are provided below:
Cash flow from Financing Activities
Particulars 2017
201
6 2015
Commonwealth 10472
162
0 -7875
Westpac 552
457
3 5513
2017 2016 2015
-10000
-5000
0
5000
10000
15000
Commonwealth
Westpac
The trend of cash flow from financing activities is in opposite direction. The cash flow of
Commonwealth group is increasing whereas it is declining in case of Westpac’s bank (Hubig,
2013).
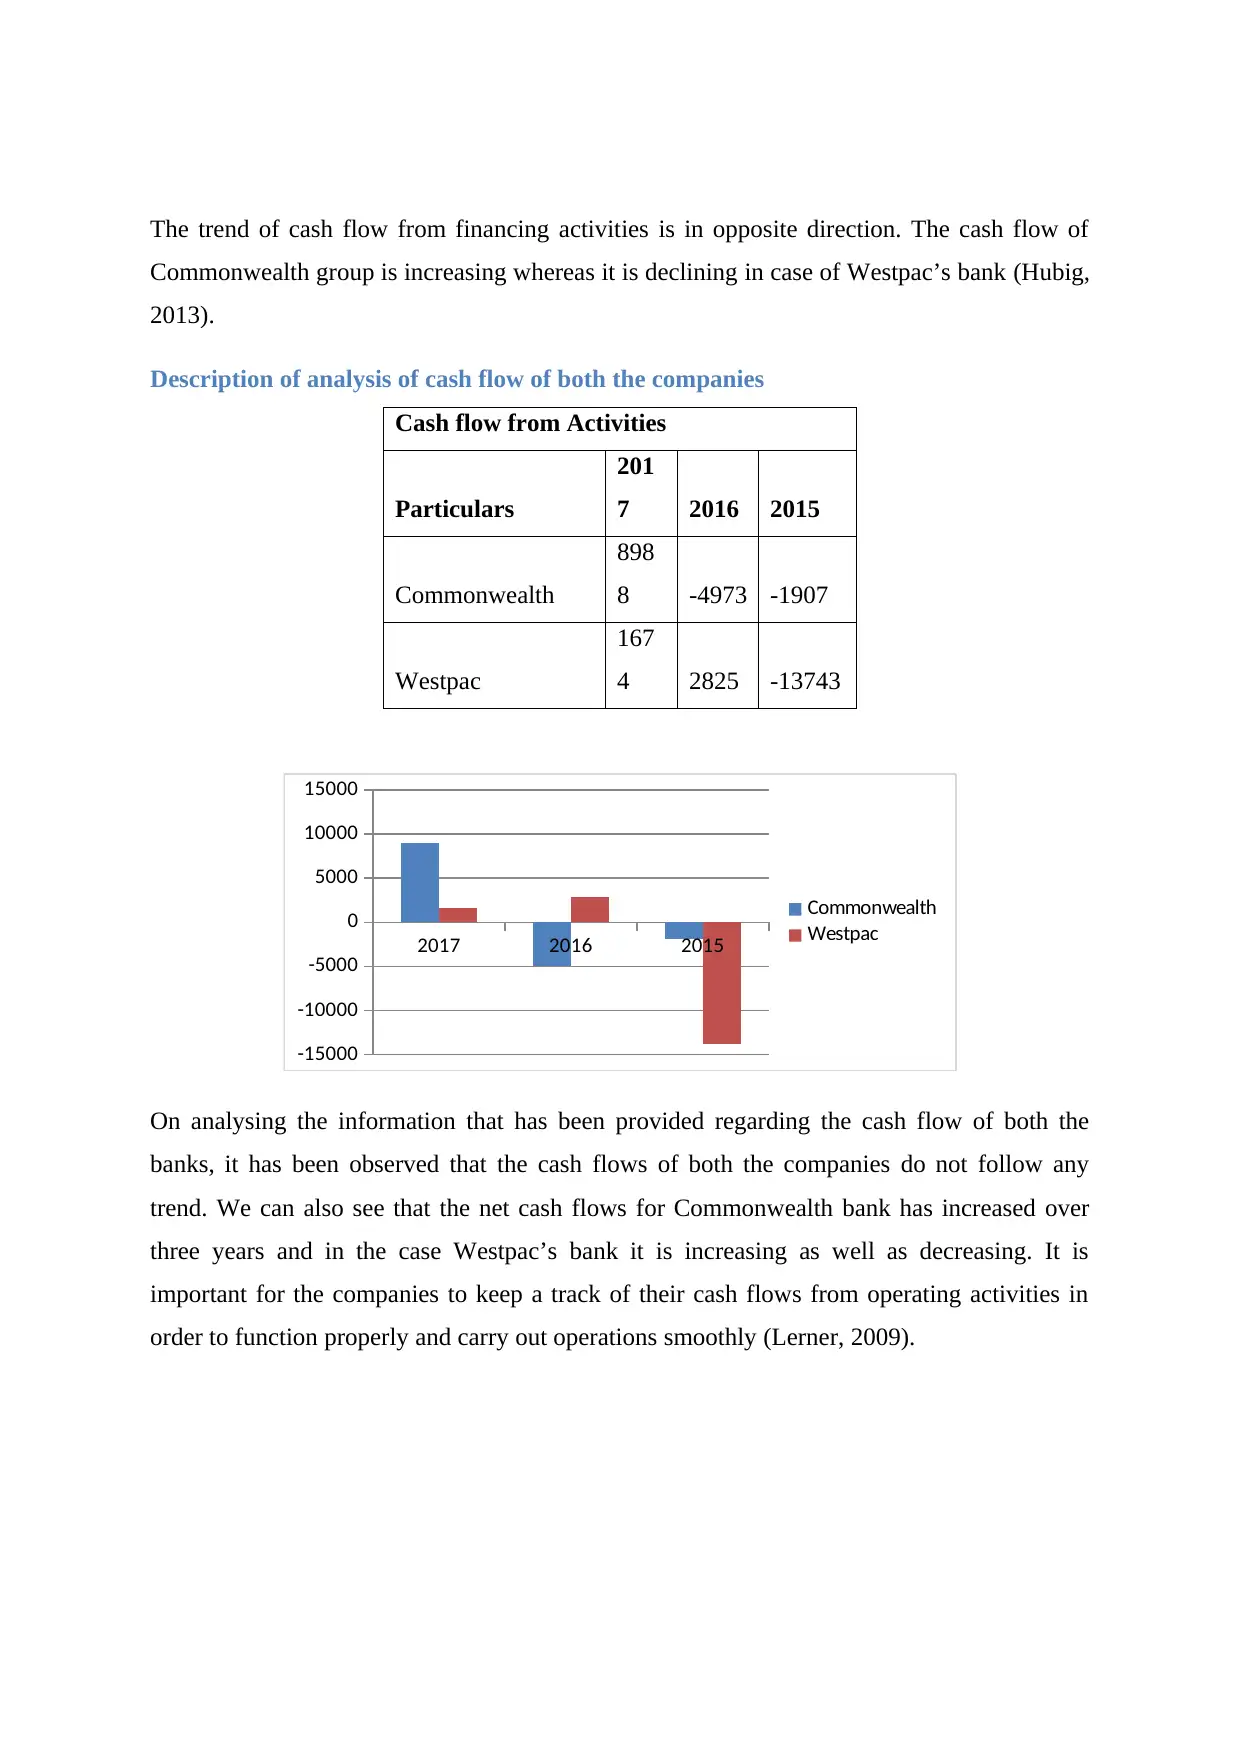
Description of analysis of cash flow of both the companies
Cash flow from Activities
Particulars
201
7 2016 2015
Commonwealth
898
8 -4973 -1907
Westpac
167
4 2825 -13743
2017 2016 2015
-15000
-10000
-5000
0
5000
10000
15000
Commonwealth
Westpac
On analysing the information that has been provided regarding the cash flow of both the
banks, it has been observed that the cash flows of both the companies do not follow any
trend. We can also see that the net cash flows for Commonwealth bank has increased over
three years and in the case Westpac’s bank it is increasing as well as decreasing. It is
important for the companies to keep a track of their cash flows from operating activities in
order to function properly and carry out operations smoothly (Lerner, 2009).
Commonwealth group is increasing whereas it is declining in case of Westpac’s bank (Hubig,
2013).
Description of analysis of cash flow of both the companies
Cash flow from Activities
Particulars
201
7 2016 2015
Commonwealth
898
8 -4973 -1907
Westpac
167
4 2825 -13743
2017 2016 2015
-15000
-10000
-5000
0
5000
10000
15000
Commonwealth
Westpac
On analysing the information that has been provided regarding the cash flow of both the
banks, it has been observed that the cash flows of both the companies do not follow any
trend. We can also see that the net cash flows for Commonwealth bank has increased over
three years and in the case Westpac’s bank it is increasing as well as decreasing. It is
important for the companies to keep a track of their cash flows from operating activities in
order to function properly and carry out operations smoothly (Lerner, 2009).
⊘ This is a preview!⊘
Do you want full access?
Subscribe today to unlock all pages.
Trusted by 1+ million students worldwide
1 out of 22
Related Documents


Your All-in-One AI-Powered Toolkit for Academic Success.
+13062052269
info@desklib.com
Available 24*7 on WhatsApp / Email
![[object Object]](/_next/static/media/star-bottom.7253800d.svg)
Unlock your academic potential
Copyright © 2020–2026 A2Z Services. All Rights Reserved. Developed and managed by ZUCOL.