ACC3015: Financial Statement Analysis and Investment Appraisal
VerifiedAdded on 2023/06/12
|29
|6102
|177
Case Study
AI Summary
This case study provides a comprehensive financial analysis of GlaxoSmithKline (GSK), AstraZeneca (AZN), and Shire (SHP) using a range of financial ratios (profitability, liquidity, gearing, investing, and share performance) and non-financial ratios. It identifies the best and worst performing companies based on these analyses, offering investment recommendations and strategies for improving financial performance. The study also explores key stages in capital investment decision-making and investment appraisal methods, supported by numerical examples. The analysis covers the years 2015-2017, providing insights into the financial health and strategic direction of each company.

ACCOUNTING FOR MANAGERS
TABLE OF CONTENT
TABLE OF CONTENT
Paraphrase This Document
Need a fresh take? Get an instant paraphrase of this document with our AI Paraphraser
S
Section A....................................................................................................................................1
Question 1...............................................................................................................................1
a) Select and justify 10 financial ratios and 2 non-financial ratios in analyzing the financial
performance of the three companies.......................................................................................1
b) Identify the best performing company and state the reasons if the company would be
consider as a positive investment opportunity......................................................................17
c) Identify worst performing company and discuss the recommendations of how the
financial performance of the firm can be improved.............................................................18
Section B..................................................................................................................................18
Question 2................................................................................................................................18
a) Identify and explain the key stages in the capital investment decision-making process
and the role of investment appraisal in the process..............................................................18
b) Identify and explain the main methods of investment appraisal used in practice with the
help of numerical examples..................................................................................................21
REFERENCES.........................................................................................................................26
SECTION A
Question 1
a) Select and justify 10 financial ratios and 2 non-financial ratios in analyzing the financial
performance of the three companies.
GlaxoSmithKline Plc
Particulars Formula 2015 2016 2017
Profitability
Sales
2392
3
2788
9 30186
GP
1507
0
1859
9 19844
Gross Profit Ratio GP/Sales*100 63% 67% 66%
Operating profit 2628 6026 6061
Operating profit
ratio Operating Profit/Sales*100 11% 22% 20%
Net profit 8422 912 1532
Net profit Ratio Net profit/sales*100 35% 3% 5%
Total assets
5344
6
5908
1 56381
Return on assets 0.158 0.015 0.027
Stockholder’s equity 5114 1124 -68
Return on Equity Net profit/Stockholder's equity 0.16 0.02 0.03
Liquidity ratios
Current assets
1658
7
1671
1 15907
Current liabilities
1341
7
1900
1 26569
Current ratio Current assets/current liability 1.24 0.88 0.60
Inventory 4716 5102 5557
Quick ratio
(current assets-inventory)/current
liabilities 0.88 0.61 0.39
Gearing ratios
Long term debt
1527
7
1462
0 14221
Equity capital 5114 1124 -68
Gearing ratio Long term debt/equity capital 2.99 13.01
-
209.13
Investing Ratios
Sales
2392
3
2788
9 30186
Total assets
5344
6
5908
1 56381
Asset turnover ratio Sales/total assets 0.45 0.47 0.54
Share performance ratios
Net income 8422 912 1532
No. of outstanding shares 1340 1342 1343
1
⊘ This is a preview!⊘
Do you want full access?
Subscribe today to unlock all pages.
Trusted by 1+ million students worldwide
Earnings per share Net income/no. of outstanding shares 6.29 0.68 1.14
Source: GSK, 2017
2015 2016 2017
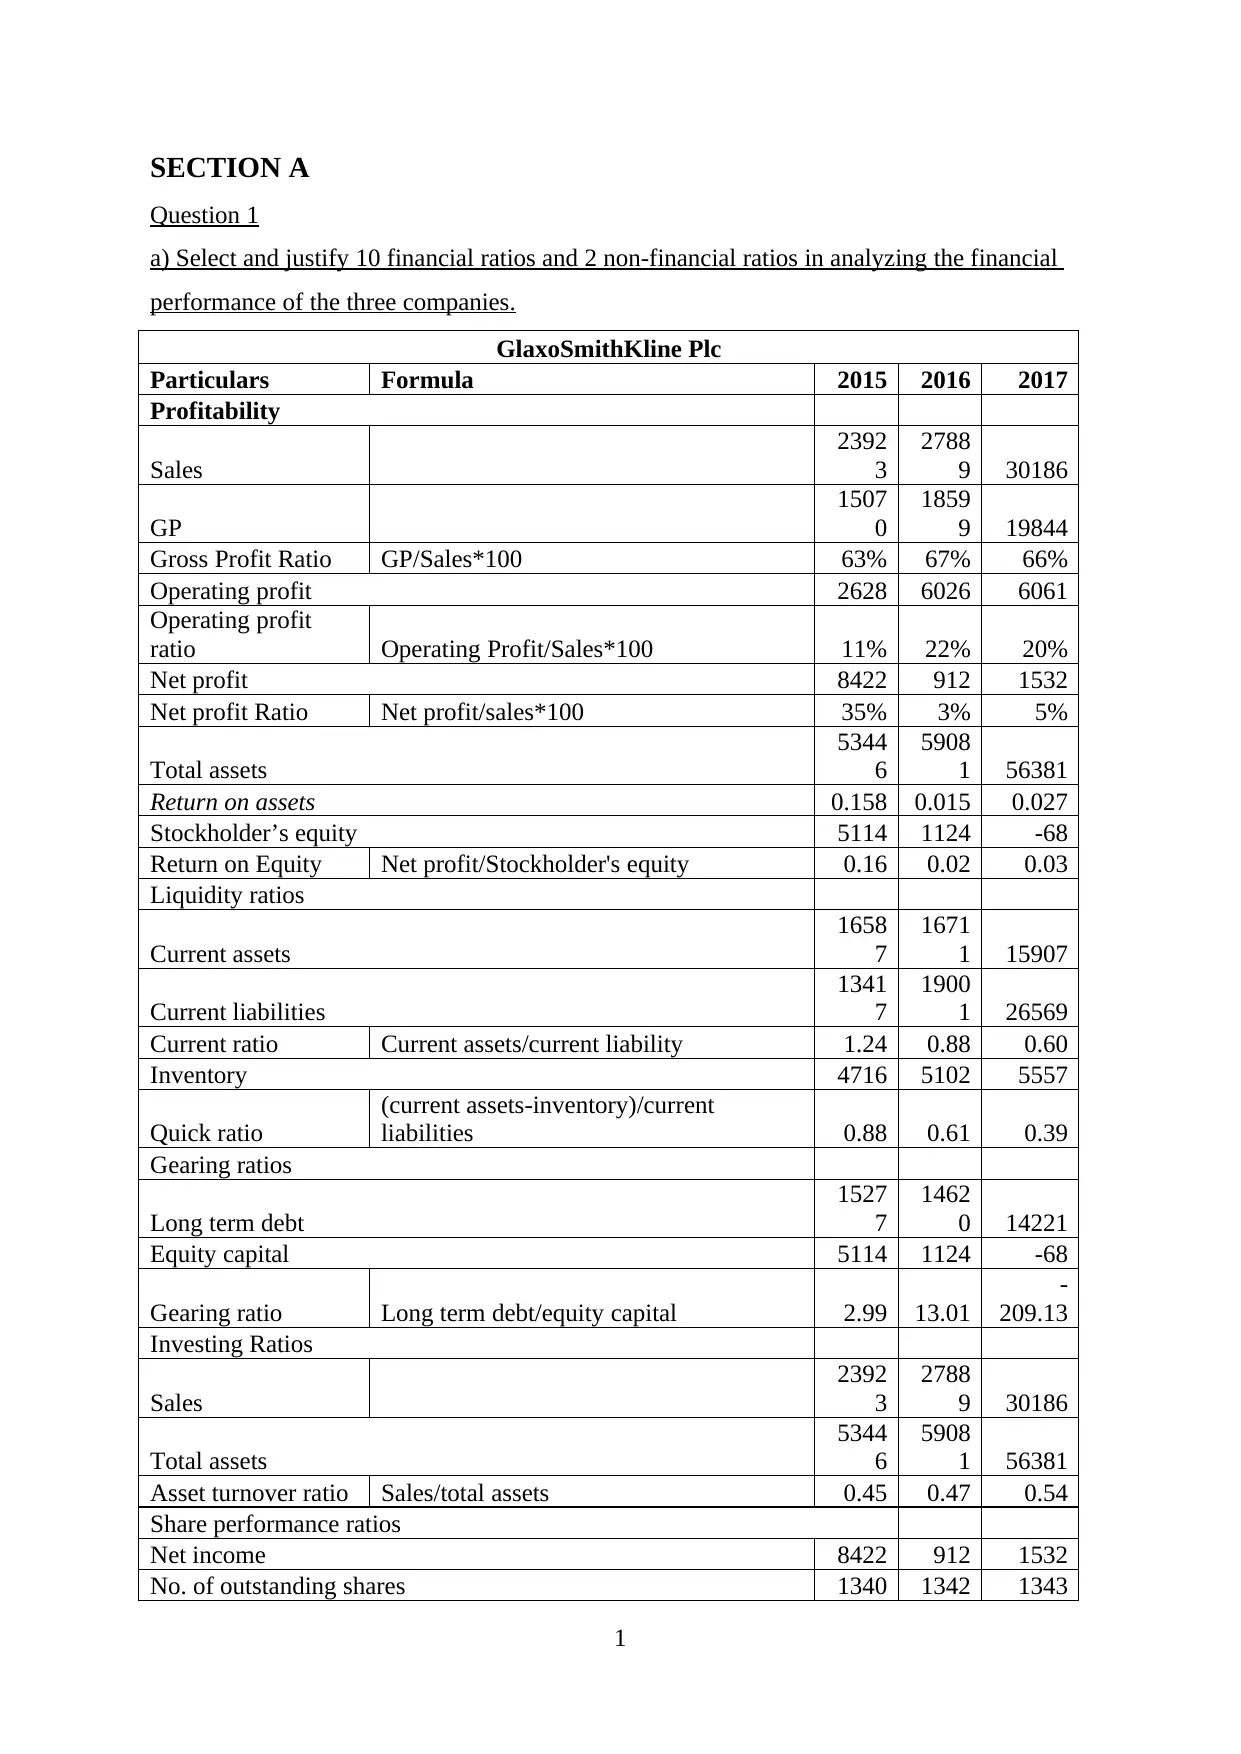
GP 63% 67% 66%
Operating Profit 11% 22% 20%
NP 35% 3% 5%
2015 2016 2017
0%
10%
20%
30%
40%
50%
60%
70%
GLAXOSMITHSKLINE
GP
Operating Profit
NP
Higher gross profit is due to lower cost of goods sold and higher sales earned by the
firm in all the three years due to good marketing of the company’s products. Operating
expenses of this enterprise are higher which decreases the operating profit and so as for the
net profit.
2015 2016 2017
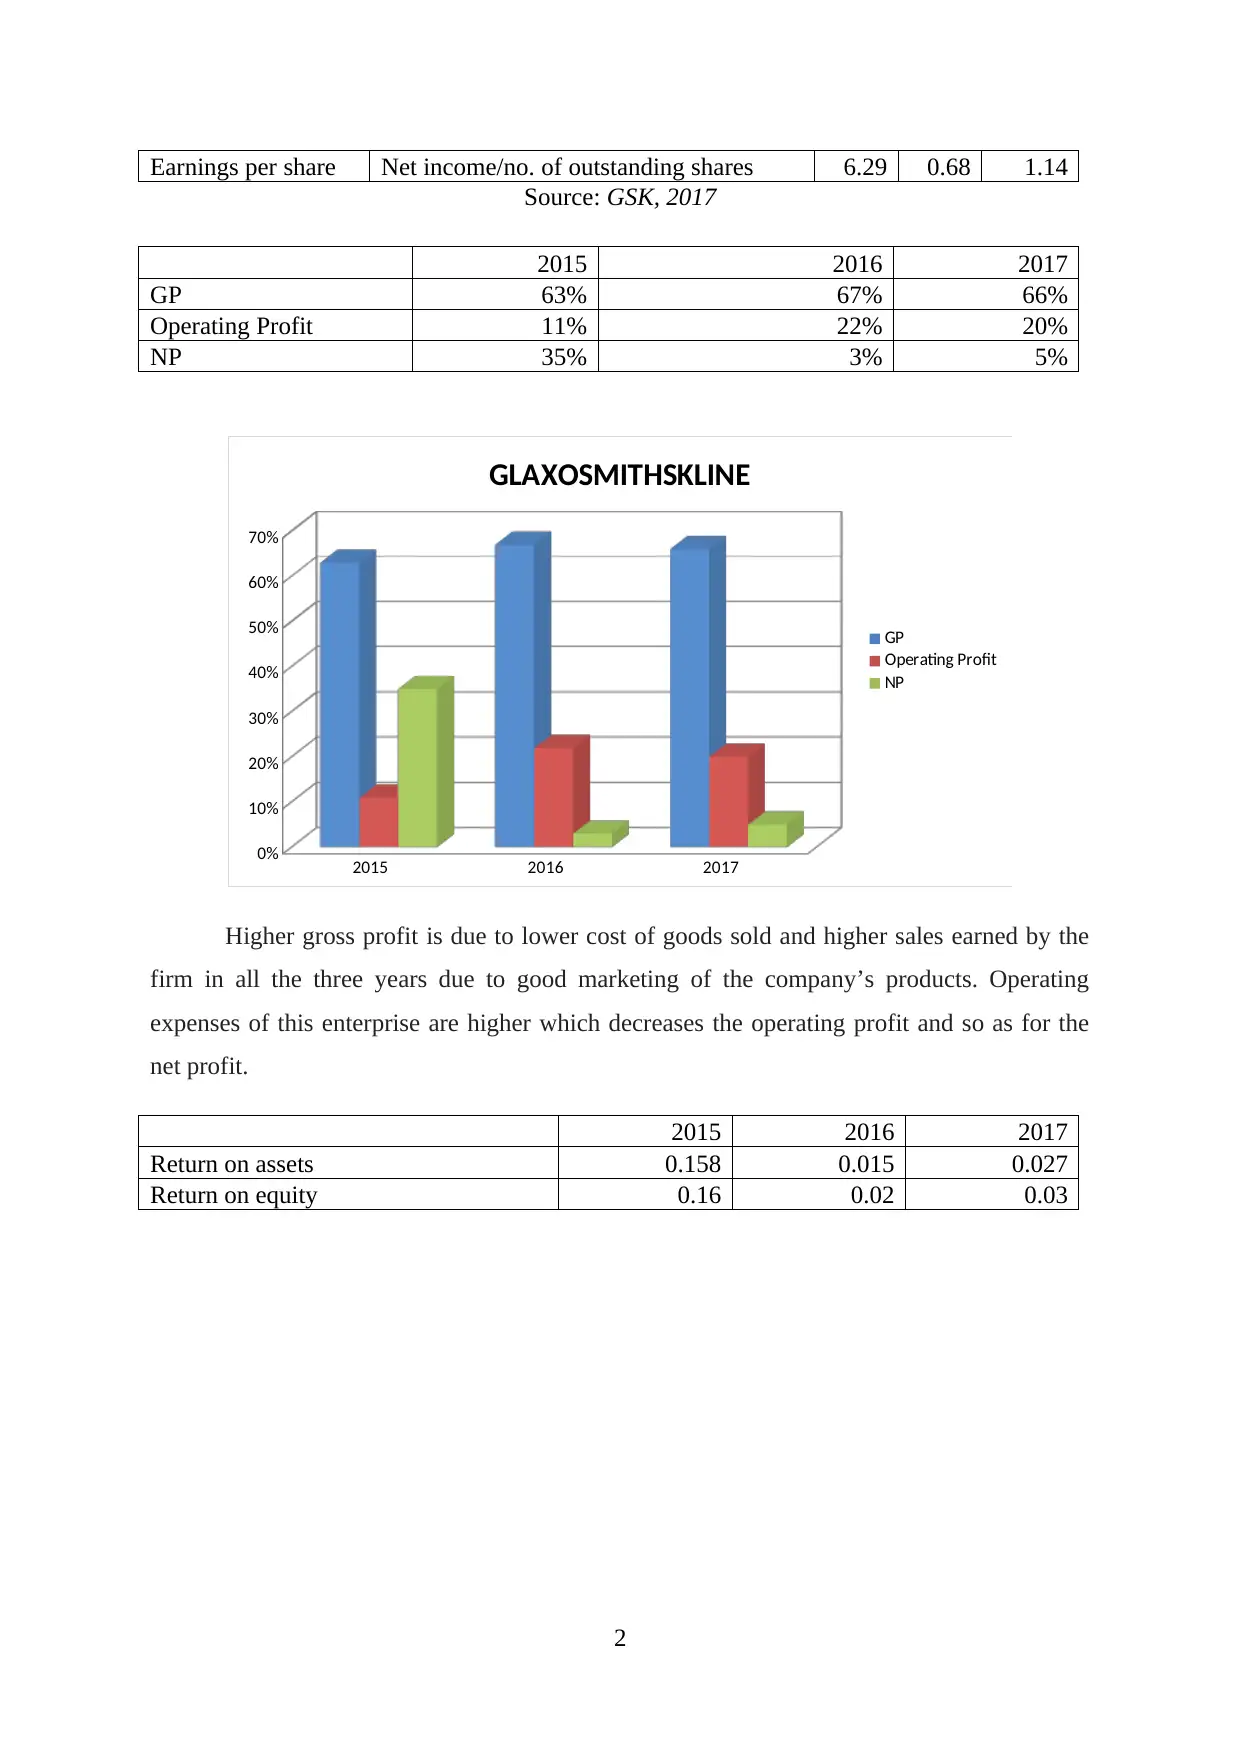
Return on assets 0.158 0.015 0.027
Return on equity 0.16 0.02 0.03
2
Source: GSK, 2017
2015 2016 2017
GP 63% 67% 66%
Operating Profit 11% 22% 20%
NP 35% 3% 5%
2015 2016 2017
0%
10%
20%
30%
40%
50%
60%
70%
GLAXOSMITHSKLINE
GP
Operating Profit
NP
Higher gross profit is due to lower cost of goods sold and higher sales earned by the
firm in all the three years due to good marketing of the company’s products. Operating
expenses of this enterprise are higher which decreases the operating profit and so as for the
net profit.
2015 2016 2017
Return on assets 0.158 0.015 0.027
Return on equity 0.16 0.02 0.03
2
Paraphrase This Document
Need a fresh take? Get an instant paraphrase of this document with our AI Paraphraser
2015
2016
2017
0 0.02 0.04 0.06 0.08 0.1 0.12 0.14 0.16
Return on equity
Return on assets
In 2015, return on equity is higher than the return on assets which further decreased
till 2017 due to decreasing earnings of an entity.
2015 2016 2017
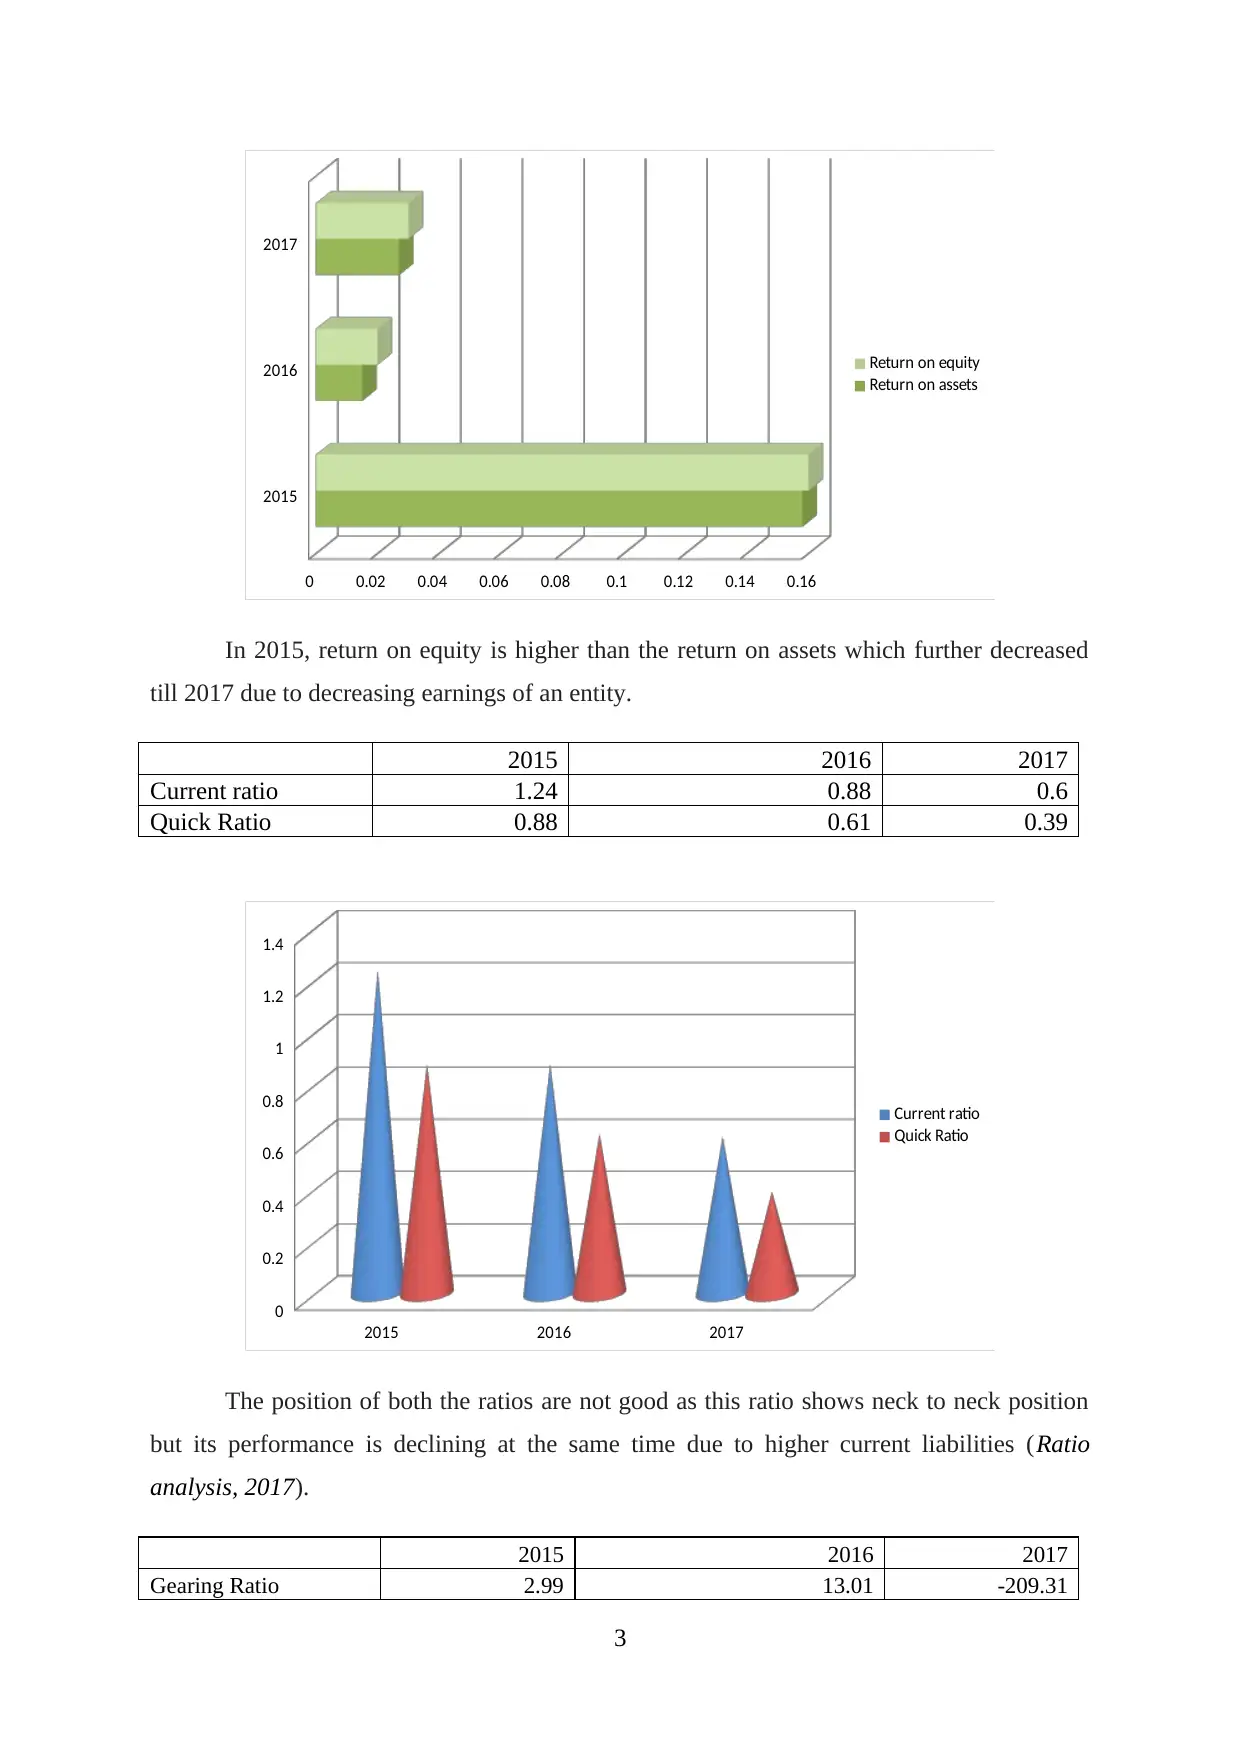
Current ratio 1.24 0.88 0.6
Quick Ratio 0.88 0.61 0.39
2015 2016 2017
0
0.2
0.4
0.6
0.8
1
1.2
1.4
Current ratio
Quick Ratio
The position of both the ratios are not good as this ratio shows neck to neck position
but its performance is declining at the same time due to higher current liabilities (Ratio
analysis, 2017).
2015 2016 2017
Gearing Ratio 2.99 13.01 -209.31
3
2016
2017
0 0.02 0.04 0.06 0.08 0.1 0.12 0.14 0.16
Return on equity
Return on assets
In 2015, return on equity is higher than the return on assets which further decreased
till 2017 due to decreasing earnings of an entity.
2015 2016 2017
Current ratio 1.24 0.88 0.6
Quick Ratio 0.88 0.61 0.39
2015 2016 2017
0
0.2
0.4
0.6
0.8
1
1.2
1.4
Current ratio
Quick Ratio
The position of both the ratios are not good as this ratio shows neck to neck position
but its performance is declining at the same time due to higher current liabilities (Ratio
analysis, 2017).
2015 2016 2017
Gearing Ratio 2.99 13.01 -209.31
3
2015 2016 2017
-250
-200
-150
-100
-50
0
50
Gearing Ratio
Gearing Ratio
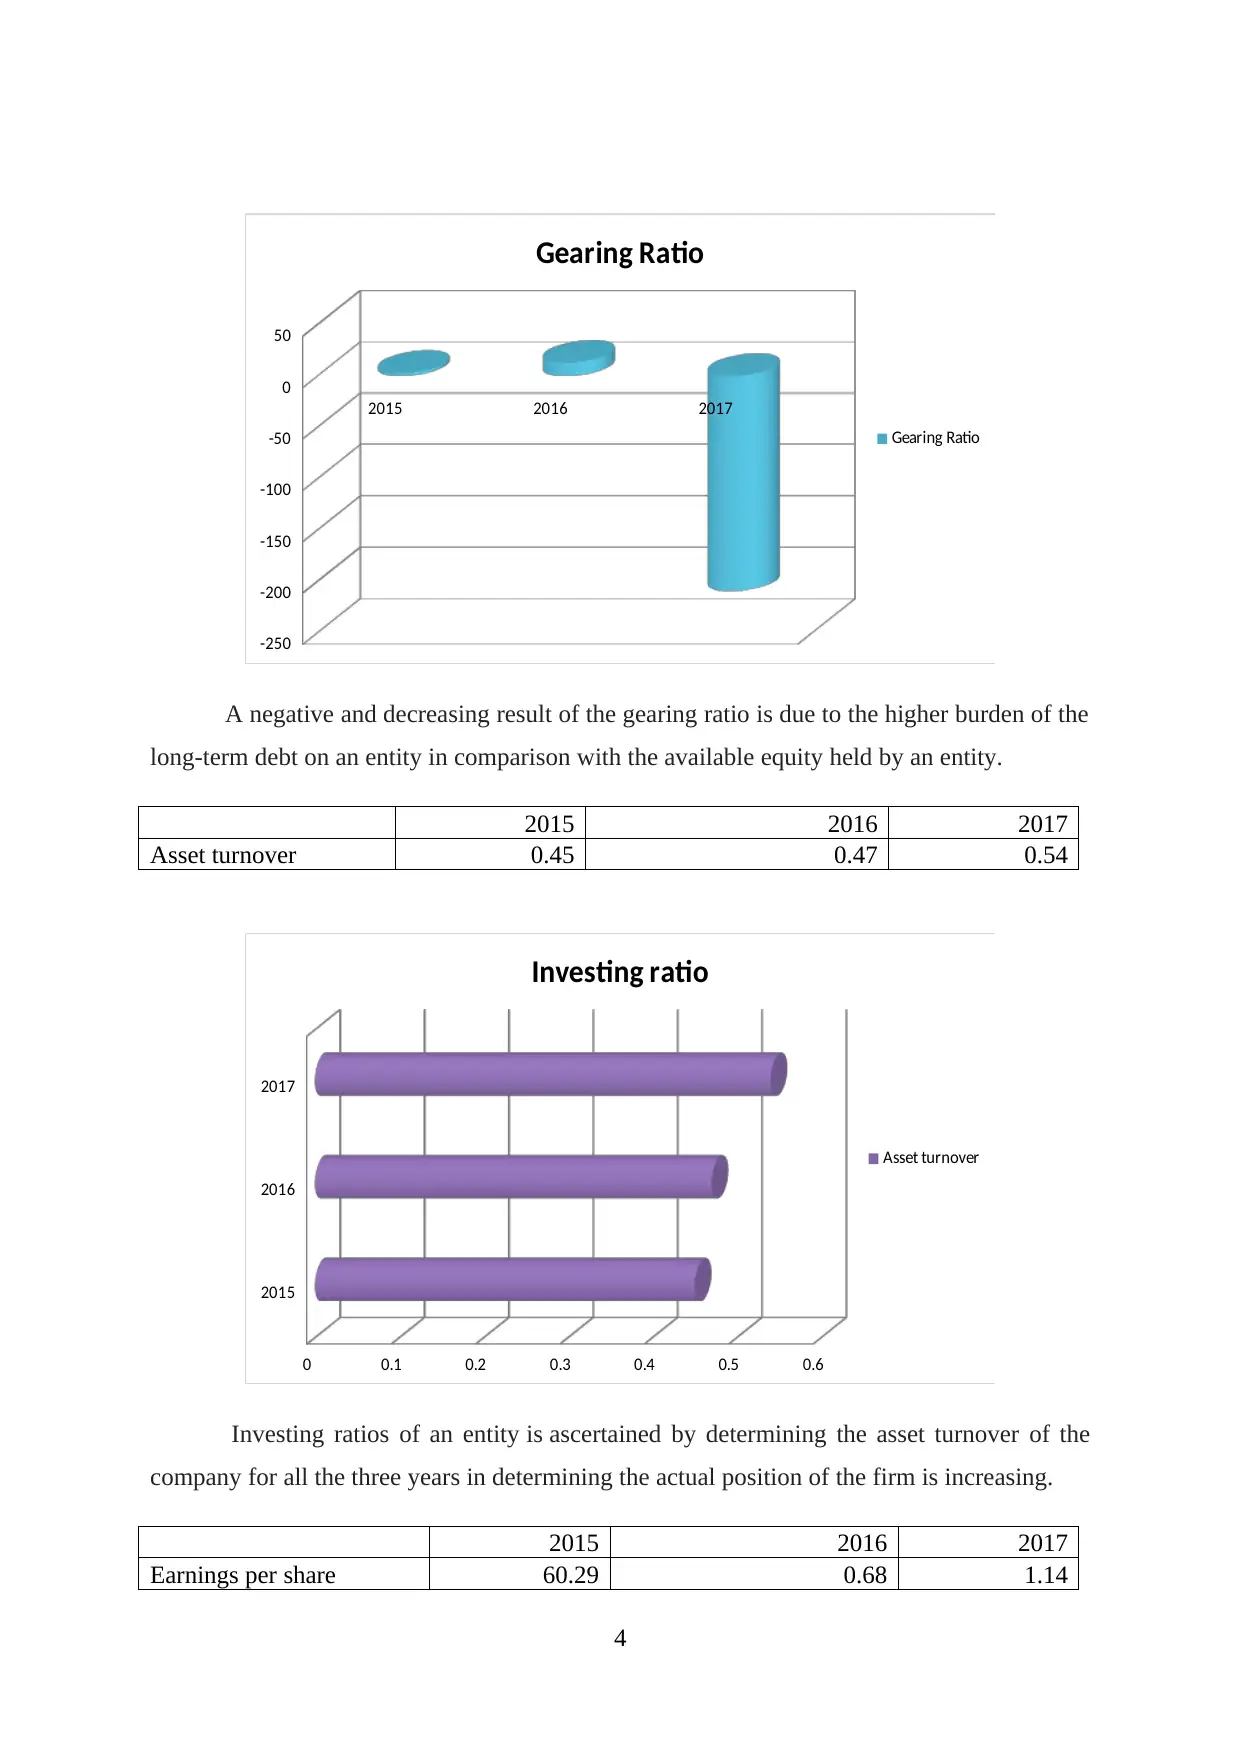
A negative and decreasing result of the gearing ratio is due to the higher burden of the
long-term debt on an entity in comparison with the available equity held by an entity.
2015 2016 2017
Asset turnover 0.45 0.47 0.54
2015
2016
2017
0 0.1 0.2 0.3 0.4 0.5 0.6
Investing ratio
Asset turnover
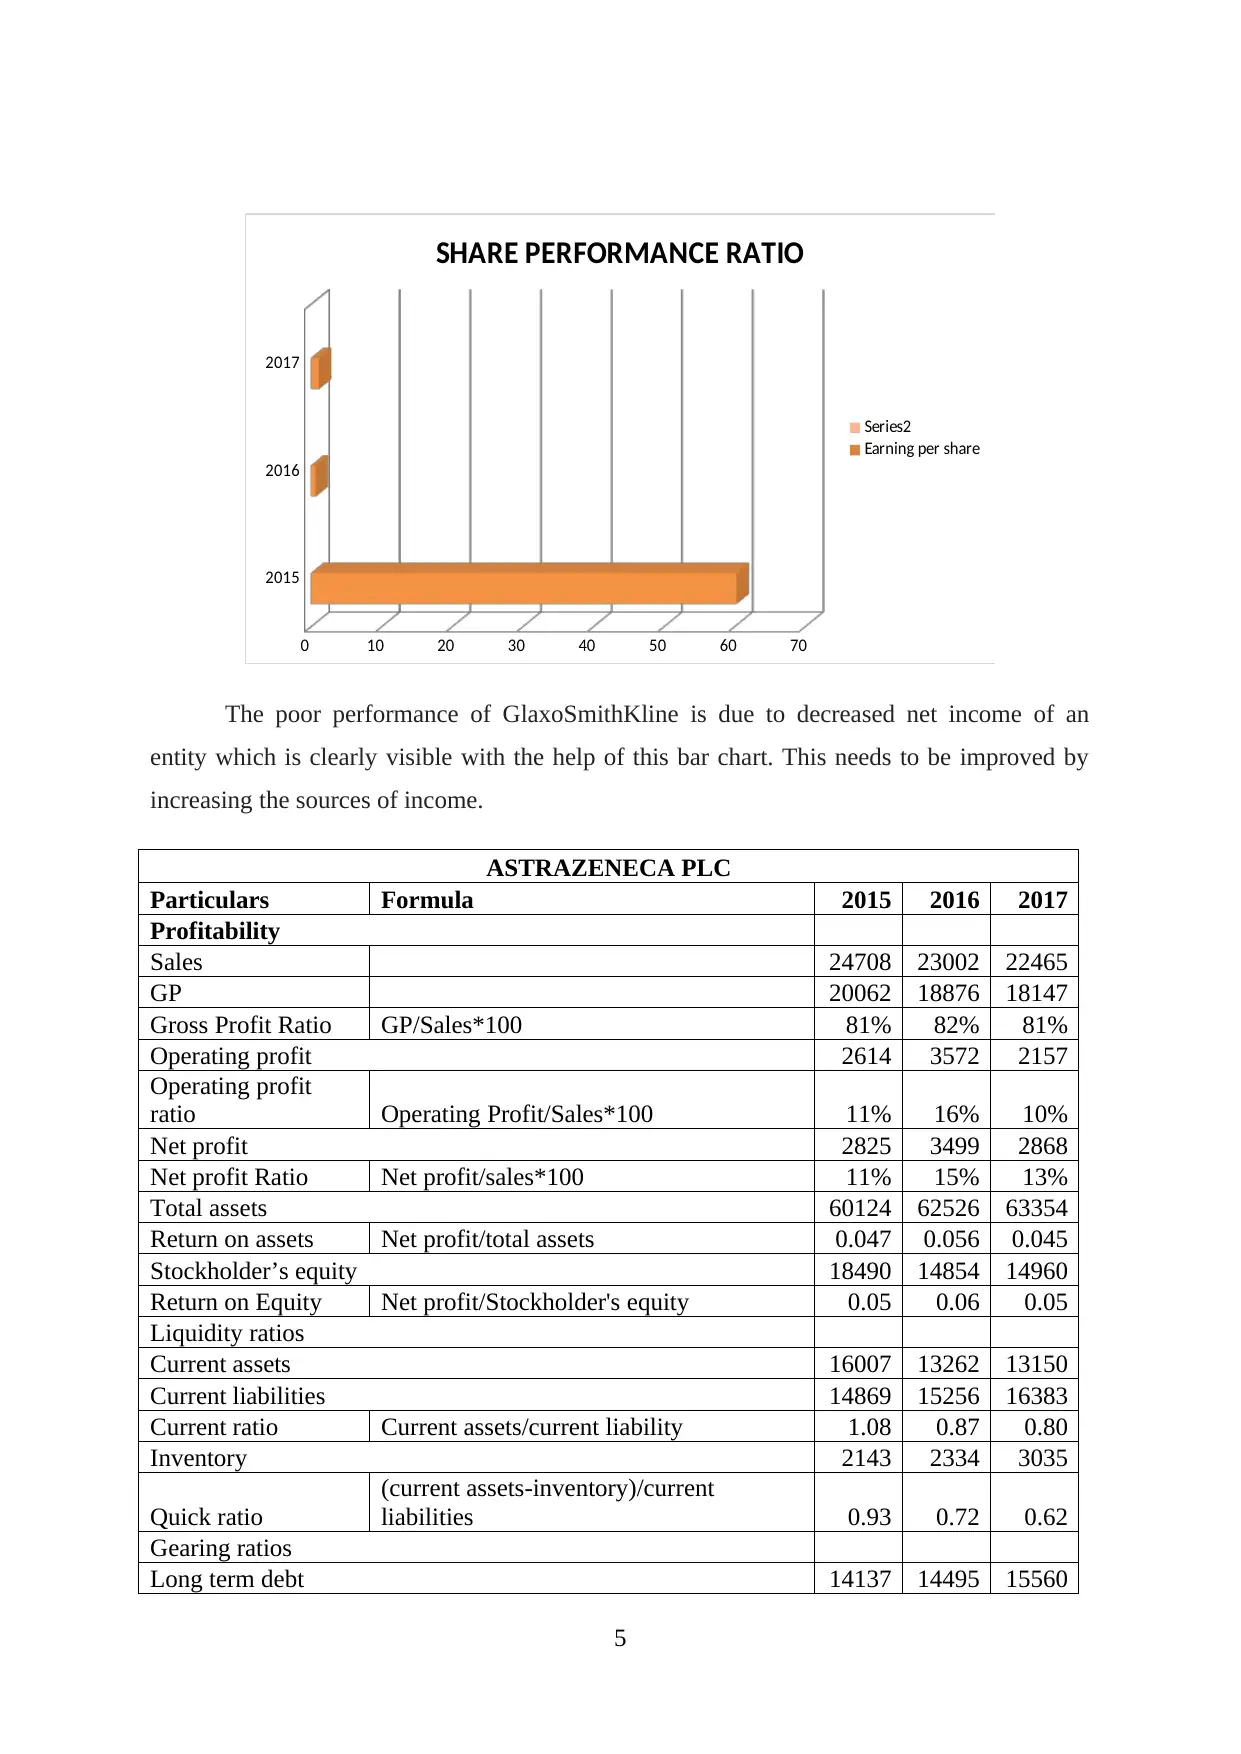
Investing ratios of an entity is ascertained by determining the asset turnover of the
company for all the three years in determining the actual position of the firm is increasing.
2015 2016 2017
Earnings per share 60.29 0.68 1.14
4
-250
-200
-150
-100
-50
0
50
Gearing Ratio
Gearing Ratio
A negative and decreasing result of the gearing ratio is due to the higher burden of the
long-term debt on an entity in comparison with the available equity held by an entity.
2015 2016 2017
Asset turnover 0.45 0.47 0.54
2015
2016
2017
0 0.1 0.2 0.3 0.4 0.5 0.6
Investing ratio
Asset turnover
Investing ratios of an entity is ascertained by determining the asset turnover of the
company for all the three years in determining the actual position of the firm is increasing.
2015 2016 2017
Earnings per share 60.29 0.68 1.14
4
⊘ This is a preview!⊘
Do you want full access?
Subscribe today to unlock all pages.
Trusted by 1+ million students worldwide
2015
2016
2017
0 10 20 30 40 50 60 70
SHARE PERFORMANCE RATIO
Series2
Earning per share
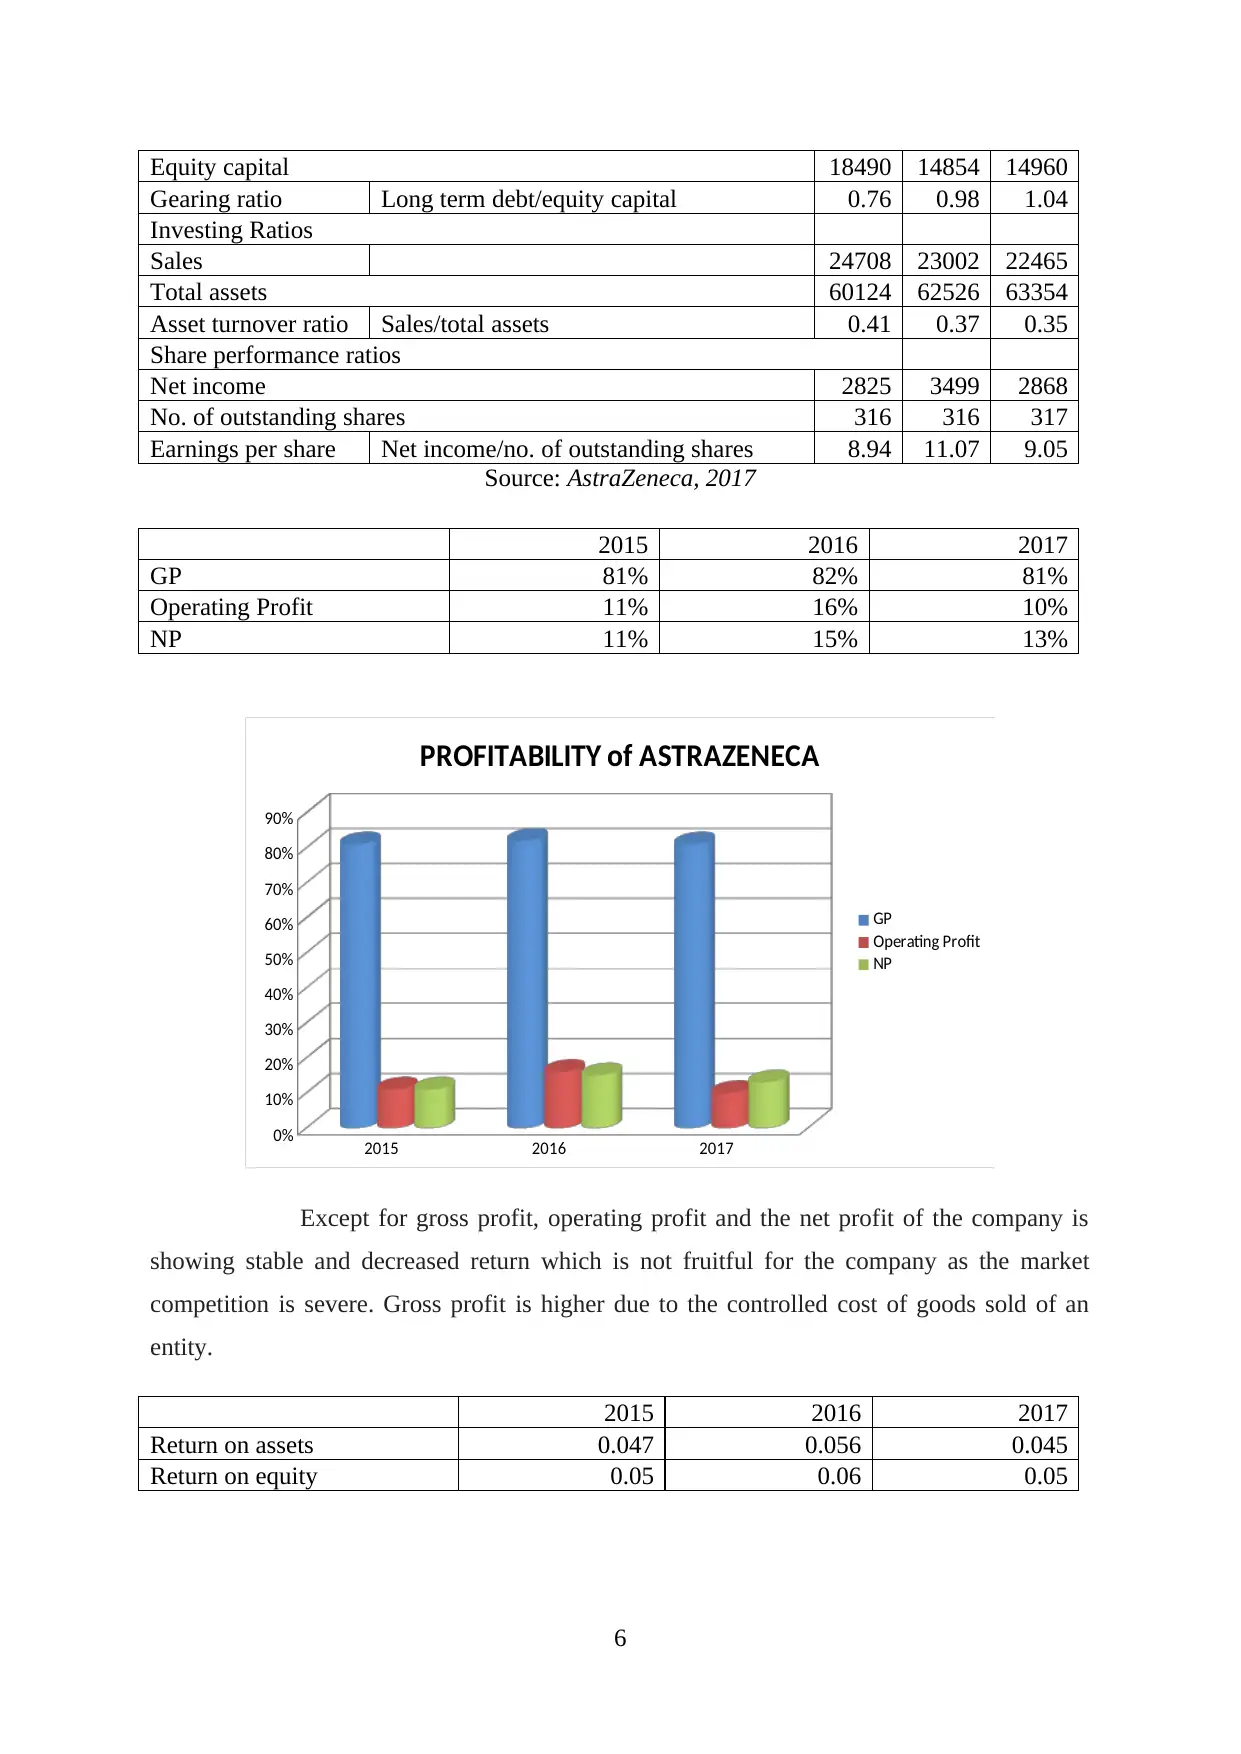
The poor performance of GlaxoSmithKline is due to decreased net income of an
entity which is clearly visible with the help of this bar chart. This needs to be improved by
increasing the sources of income.
ASTRAZENECA PLC
Particulars Formula 2015 2016 2017
Profitability
Sales 24708 23002 22465
GP 20062 18876 18147
Gross Profit Ratio GP/Sales*100 81% 82% 81%
Operating profit 2614 3572 2157
Operating profit
ratio Operating Profit/Sales*100 11% 16% 10%
Net profit 2825 3499 2868
Net profit Ratio Net profit/sales*100 11% 15% 13%
Total assets 60124 62526 63354
Return on assets Net profit/total assets 0.047 0.056 0.045
Stockholder’s equity 18490 14854 14960
Return on Equity Net profit/Stockholder's equity 0.05 0.06 0.05
Liquidity ratios
Current assets 16007 13262 13150
Current liabilities 14869 15256 16383
Current ratio Current assets/current liability 1.08 0.87 0.80
Inventory 2143 2334 3035
Quick ratio
(current assets-inventory)/current
liabilities 0.93 0.72 0.62
Gearing ratios
Long term debt 14137 14495 15560
5
2016
2017
0 10 20 30 40 50 60 70
SHARE PERFORMANCE RATIO
Series2
Earning per share
The poor performance of GlaxoSmithKline is due to decreased net income of an
entity which is clearly visible with the help of this bar chart. This needs to be improved by
increasing the sources of income.
ASTRAZENECA PLC
Particulars Formula 2015 2016 2017
Profitability
Sales 24708 23002 22465
GP 20062 18876 18147
Gross Profit Ratio GP/Sales*100 81% 82% 81%
Operating profit 2614 3572 2157
Operating profit
ratio Operating Profit/Sales*100 11% 16% 10%
Net profit 2825 3499 2868
Net profit Ratio Net profit/sales*100 11% 15% 13%
Total assets 60124 62526 63354
Return on assets Net profit/total assets 0.047 0.056 0.045
Stockholder’s equity 18490 14854 14960
Return on Equity Net profit/Stockholder's equity 0.05 0.06 0.05
Liquidity ratios
Current assets 16007 13262 13150
Current liabilities 14869 15256 16383
Current ratio Current assets/current liability 1.08 0.87 0.80
Inventory 2143 2334 3035
Quick ratio
(current assets-inventory)/current
liabilities 0.93 0.72 0.62
Gearing ratios
Long term debt 14137 14495 15560
5
Paraphrase This Document
Need a fresh take? Get an instant paraphrase of this document with our AI Paraphraser
Equity capital 18490 14854 14960
Gearing ratio Long term debt/equity capital 0.76 0.98 1.04
Investing Ratios
Sales 24708 23002 22465
Total assets 60124 62526 63354
Asset turnover ratio Sales/total assets 0.41 0.37 0.35
Share performance ratios
Net income 2825 3499 2868
No. of outstanding shares 316 316 317
Earnings per share Net income/no. of outstanding shares 8.94 11.07 9.05
Source: AstraZeneca, 2017
2015 2016 2017
GP 81% 82% 81%
Operating Profit 11% 16% 10%
NP 11% 15% 13%
2015 2016 2017
0%
10%
20%
30%
40%
50%
60%
70%
80%
90%
PROFITABILITY of ASTRAZENECA
GP
Operating Profit
NP
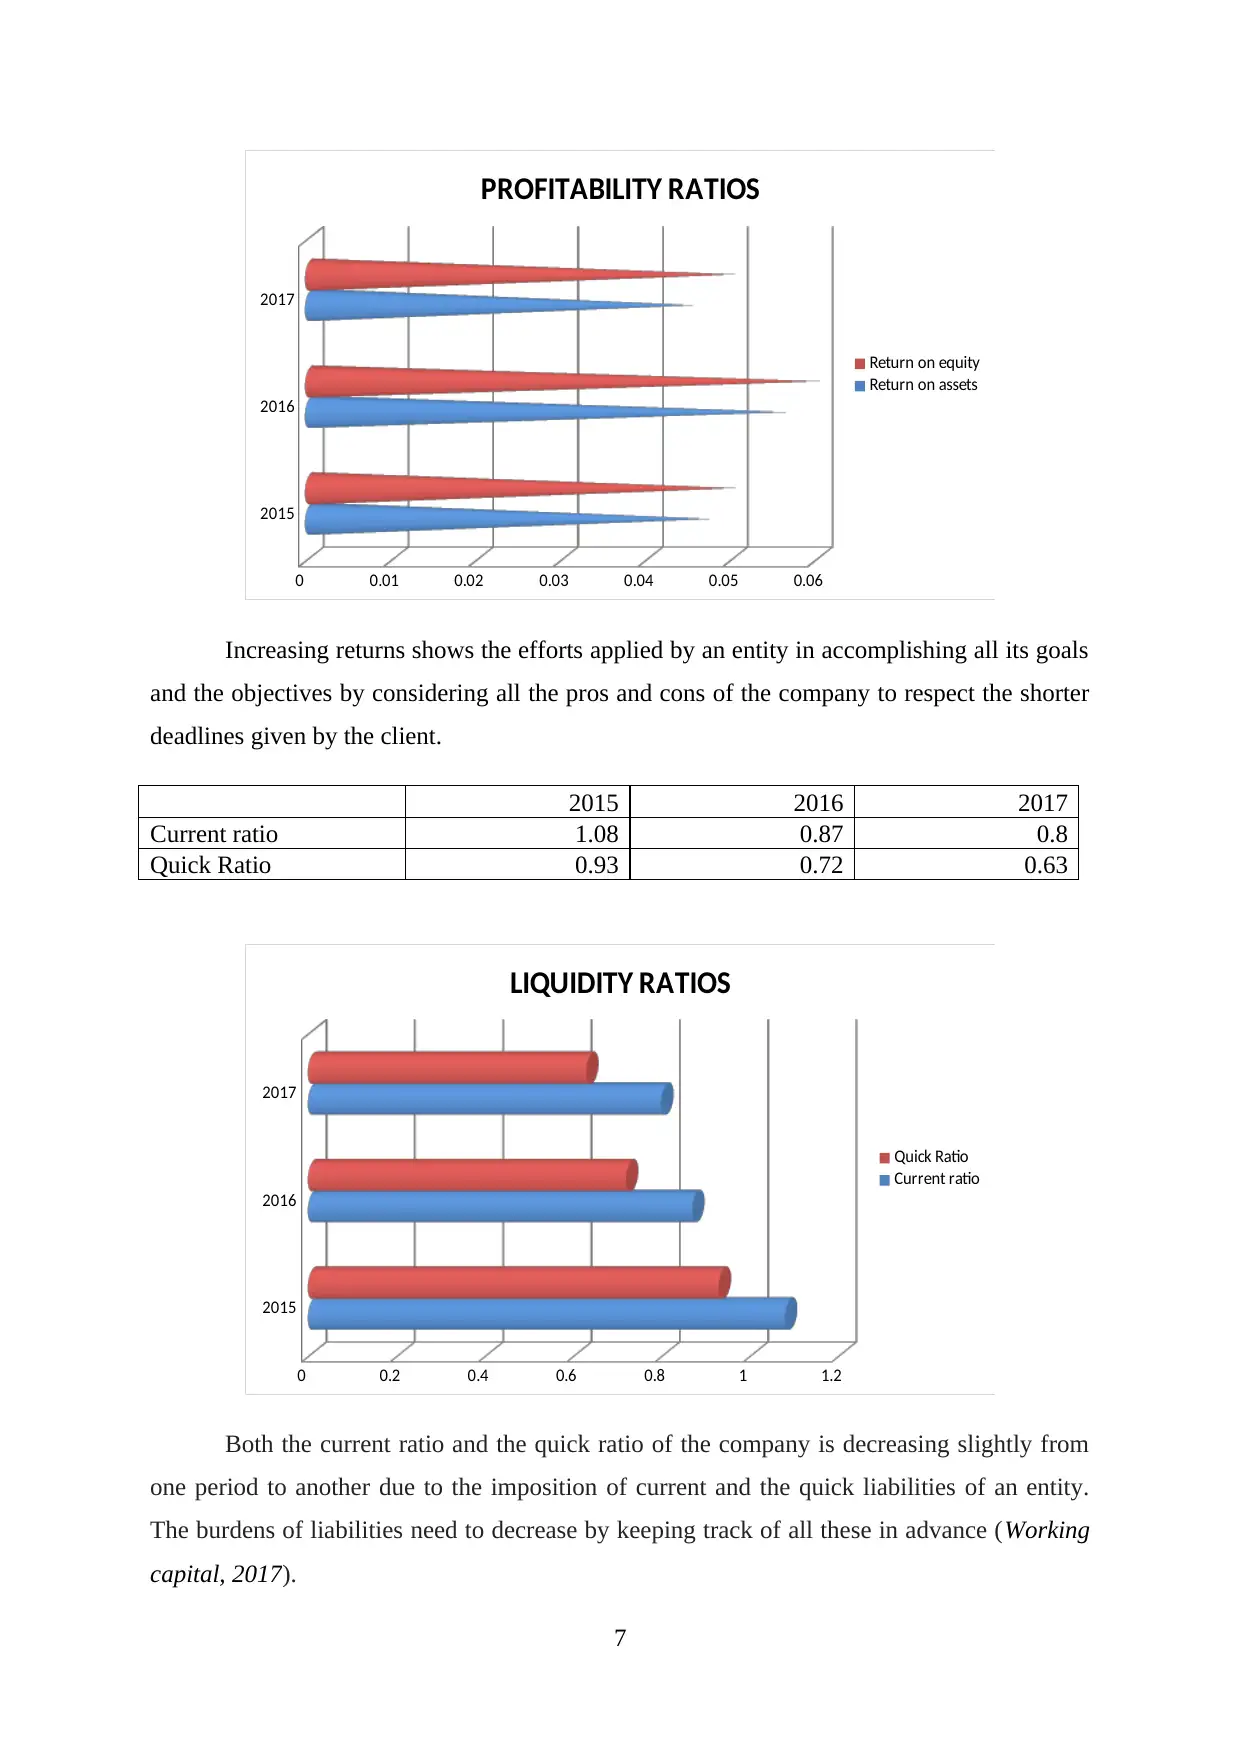
Except for gross profit, operating profit and the net profit of the company is
showing stable and decreased return which is not fruitful for the company as the market
competition is severe. Gross profit is higher due to the controlled cost of goods sold of an
entity.
2015 2016 2017
Return on assets 0.047 0.056 0.045
Return on equity 0.05 0.06 0.05
6
Gearing ratio Long term debt/equity capital 0.76 0.98 1.04
Investing Ratios
Sales 24708 23002 22465
Total assets 60124 62526 63354
Asset turnover ratio Sales/total assets 0.41 0.37 0.35
Share performance ratios
Net income 2825 3499 2868
No. of outstanding shares 316 316 317
Earnings per share Net income/no. of outstanding shares 8.94 11.07 9.05
Source: AstraZeneca, 2017
2015 2016 2017
GP 81% 82% 81%
Operating Profit 11% 16% 10%
NP 11% 15% 13%
2015 2016 2017
0%
10%
20%
30%
40%
50%
60%
70%
80%
90%
PROFITABILITY of ASTRAZENECA
GP
Operating Profit
NP
Except for gross profit, operating profit and the net profit of the company is
showing stable and decreased return which is not fruitful for the company as the market
competition is severe. Gross profit is higher due to the controlled cost of goods sold of an
entity.
2015 2016 2017
Return on assets 0.047 0.056 0.045
Return on equity 0.05 0.06 0.05
6
2015
2016
2017
0 0.01 0.02 0.03 0.04 0.05 0.06
PROFITABILITY RATIOS
Return on equity
Return on assets
Increasing returns shows the efforts applied by an entity in accomplishing all its goals
and the objectives by considering all the pros and cons of the company to respect the shorter
deadlines given by the client.
2015 2016 2017
Current ratio 1.08 0.87 0.8
Quick Ratio 0.93 0.72 0.63
2015
2016
2017
0 0.2 0.4 0.6 0.8 1 1.2
LIQUIDITY RATIOS
Quick Ratio
Current ratio
Both the current ratio and the quick ratio of the company is decreasing slightly from
one period to another due to the imposition of current and the quick liabilities of an entity.
The burdens of liabilities need to decrease by keeping track of all these in advance (Working
capital, 2017).
7
2016
2017
0 0.01 0.02 0.03 0.04 0.05 0.06
PROFITABILITY RATIOS
Return on equity
Return on assets
Increasing returns shows the efforts applied by an entity in accomplishing all its goals
and the objectives by considering all the pros and cons of the company to respect the shorter
deadlines given by the client.
2015 2016 2017
Current ratio 1.08 0.87 0.8
Quick Ratio 0.93 0.72 0.63
2015
2016
2017
0 0.2 0.4 0.6 0.8 1 1.2
LIQUIDITY RATIOS
Quick Ratio
Current ratio
Both the current ratio and the quick ratio of the company is decreasing slightly from
one period to another due to the imposition of current and the quick liabilities of an entity.
The burdens of liabilities need to decrease by keeping track of all these in advance (Working
capital, 2017).
7
⊘ This is a preview!⊘
Do you want full access?
Subscribe today to unlock all pages.
Trusted by 1+ million students worldwide
2015 2016 2017
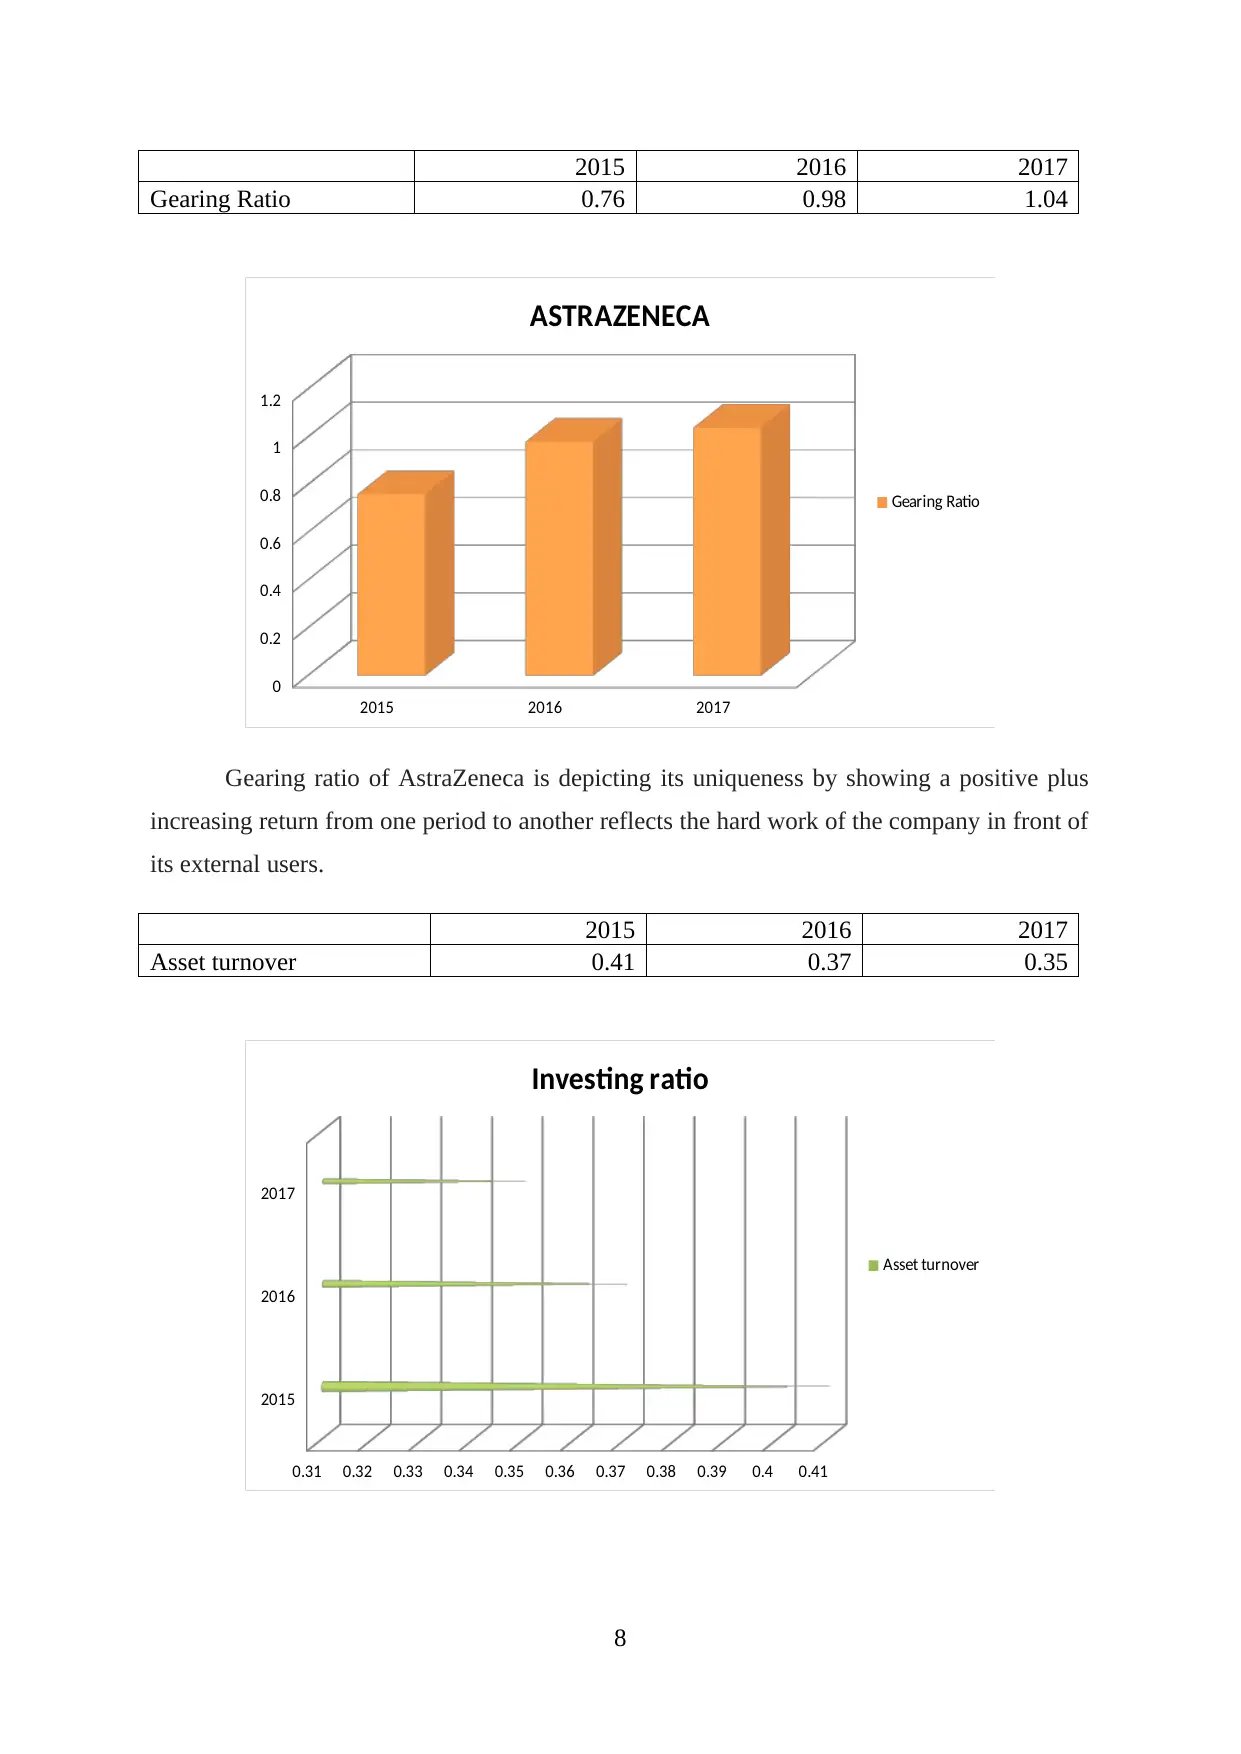
Gearing Ratio 0.76 0.98 1.04
2015 2016 2017
0
0.2
0.4
0.6
0.8
1
1.2
ASTRAZENECA
Gearing Ratio
Gearing ratio of AstraZeneca is depicting its uniqueness by showing a positive plus
increasing return from one period to another reflects the hard work of the company in front of
its external users.
2015 2016 2017
Asset turnover 0.41 0.37 0.35
2015
2016
2017
0.31 0.32 0.33 0.34 0.35 0.36 0.37 0.38 0.39 0.4 0.41
Investing ratio
Asset turnover
8
Paraphrase This Document
Need a fresh take? Get an instant paraphrase of this document with our AI Paraphraser
The investing ratio trend is like a staircase which is reducing from top to the bottom
position depicts the deficiency of the firm in achieving its returns within a stipulated
deadline. This is due to higher assets and lower net income of an entity.
2015 2016 2017
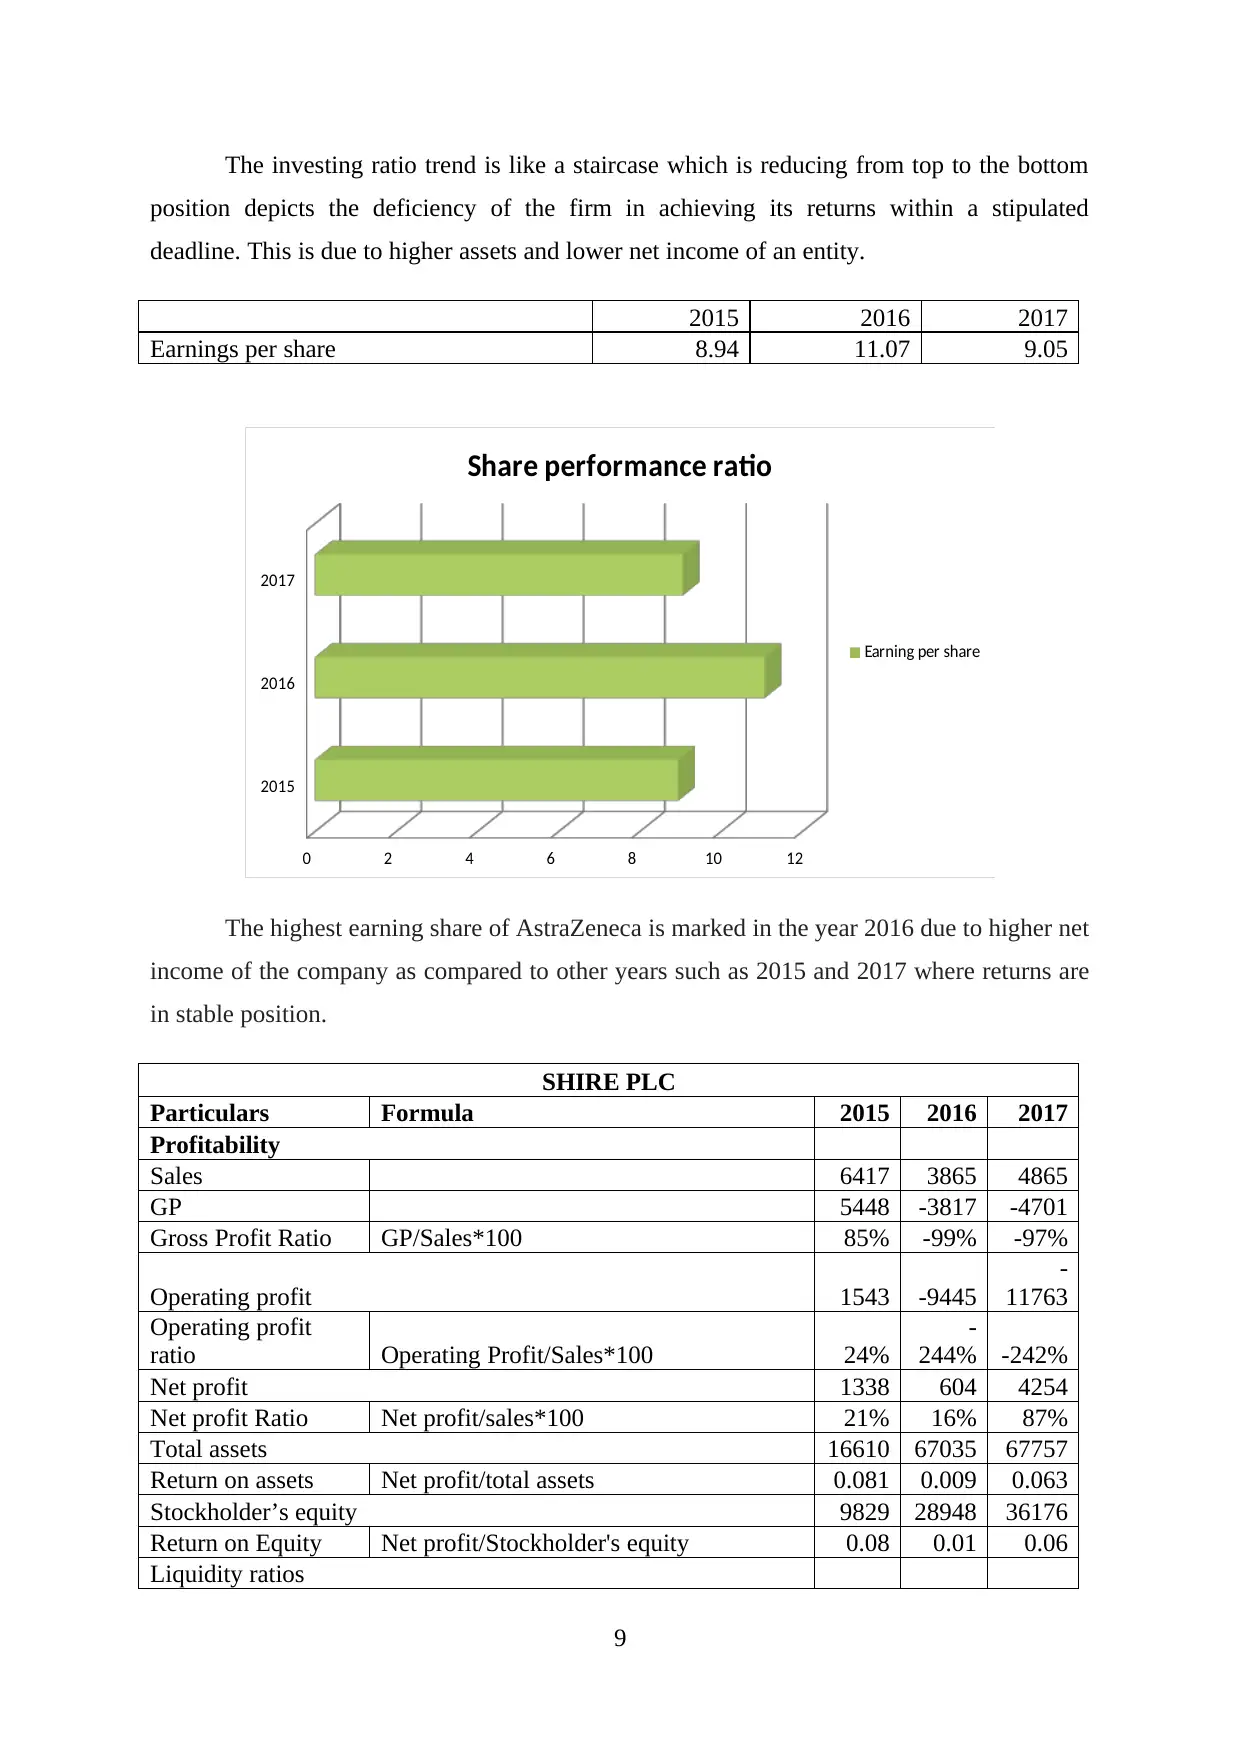
Earnings per share 8.94 11.07 9.05
2015
2016
2017
0 2 4 6 8 10 12
Share performance ratio
Earning per share
The highest earning share of AstraZeneca is marked in the year 2016 due to higher net
income of the company as compared to other years such as 2015 and 2017 where returns are
in stable position.
SHIRE PLC
Particulars Formula 2015 2016 2017
Profitability
Sales 6417 3865 4865
GP 5448 -3817 -4701
Gross Profit Ratio GP/Sales*100 85% -99% -97%
Operating profit 1543 -9445
-
11763
Operating profit
ratio Operating Profit/Sales*100 24%
-
244% -242%
Net profit 1338 604 4254
Net profit Ratio Net profit/sales*100 21% 16% 87%
Total assets 16610 67035 67757
Return on assets Net profit/total assets 0.081 0.009 0.063
Stockholder’s equity 9829 28948 36176
Return on Equity Net profit/Stockholder's equity 0.08 0.01 0.06
Liquidity ratios
9
position depicts the deficiency of the firm in achieving its returns within a stipulated
deadline. This is due to higher assets and lower net income of an entity.
2015 2016 2017
Earnings per share 8.94 11.07 9.05
2015
2016
2017
0 2 4 6 8 10 12
Share performance ratio
Earning per share
The highest earning share of AstraZeneca is marked in the year 2016 due to higher net
income of the company as compared to other years such as 2015 and 2017 where returns are
in stable position.
SHIRE PLC
Particulars Formula 2015 2016 2017
Profitability
Sales 6417 3865 4865
GP 5448 -3817 -4701
Gross Profit Ratio GP/Sales*100 85% -99% -97%
Operating profit 1543 -9445
-
11763
Operating profit
ratio Operating Profit/Sales*100 24%
-
244% -242%
Net profit 1338 604 4254
Net profit Ratio Net profit/sales*100 21% 16% 87%
Total assets 16610 67035 67757
Return on assets Net profit/total assets 0.081 0.009 0.063
Stockholder’s equity 9829 28948 36176
Return on Equity Net profit/Stockholder's equity 0.08 0.01 0.06
Liquidity ratios
9
Current assets 2256 7540 7608
Current liabilities 3706 7743 7882
Current ratio Current assets/current liability 0.61 0.97 0.97
Inventory 635 3562 3292
Quick ratio
(current assets-inventory)/current
liabilities 0.44 0.51 0.55
Gearing ratios
Long term debt 70 19553 16411
Equity capital 9829 28948 36176
Gearing ratio Long term debt/equity capital 0.01 0.68 0.45
Investing Ratios
Sales 6417 3865 4865
Total assets 16610 67035 67757
Asset turnover ratio Sales/total assets 0.39 0.06 0.07
Share performance ratios
Net income 1338 604 4254
No. of outstanding shares 59 59 81
Earnings per share Net income/no. of outstanding shares 22.68 10.24 52.52
Source: Shire, 2017
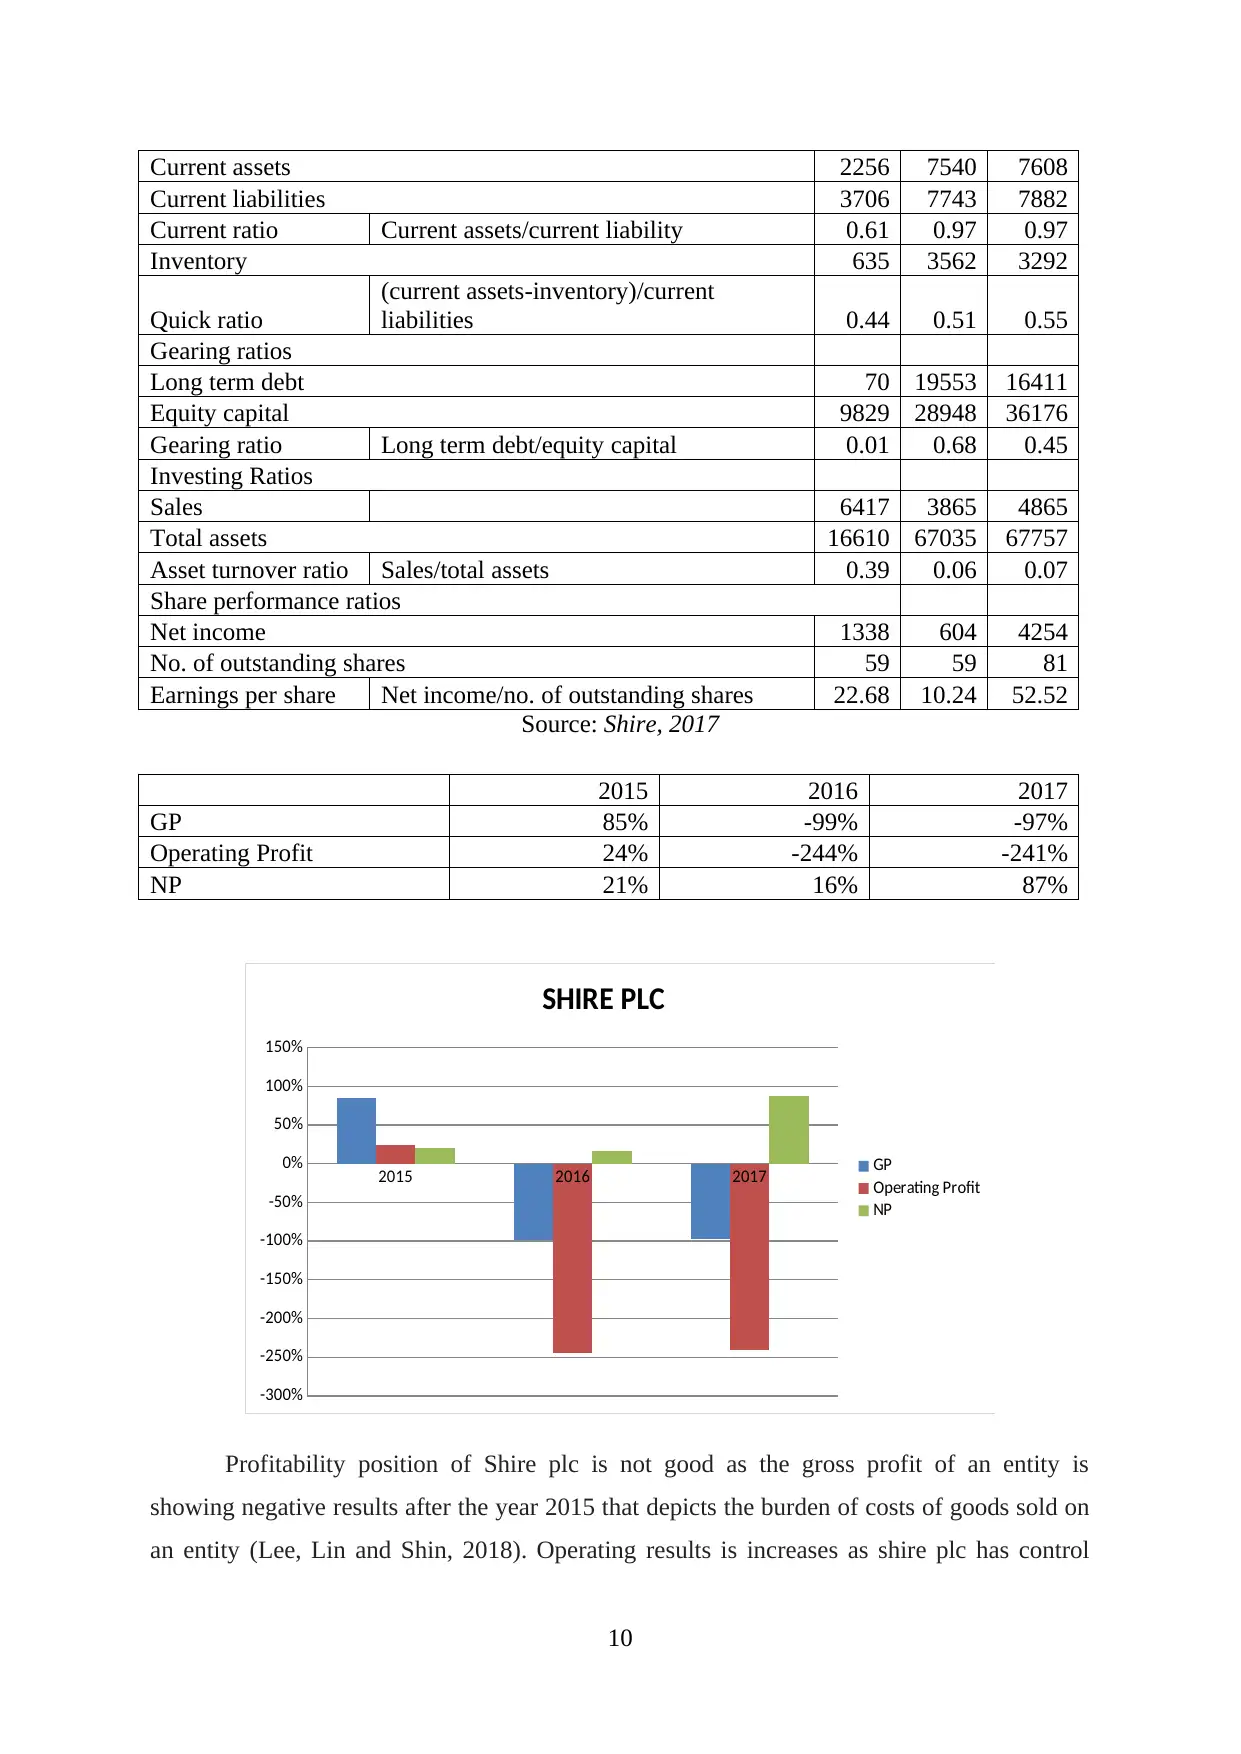
2015 2016 2017
GP 85% -99% -97%
Operating Profit 24% -244% -241%
NP 21% 16% 87%
2015 2016 2017
-300%
-250%
-200%
-150%
-100%
-50%
0%
50%
100%
150%
SHIRE PLC
GP
Operating Profit
NP
Profitability position of Shire plc is not good as the gross profit of an entity is
showing negative results after the year 2015 that depicts the burden of costs of goods sold on
an entity (Lee, Lin and Shin, 2018). Operating results is increases as shire plc has control
10
Current liabilities 3706 7743 7882
Current ratio Current assets/current liability 0.61 0.97 0.97
Inventory 635 3562 3292
Quick ratio
(current assets-inventory)/current
liabilities 0.44 0.51 0.55
Gearing ratios
Long term debt 70 19553 16411
Equity capital 9829 28948 36176
Gearing ratio Long term debt/equity capital 0.01 0.68 0.45
Investing Ratios
Sales 6417 3865 4865
Total assets 16610 67035 67757
Asset turnover ratio Sales/total assets 0.39 0.06 0.07
Share performance ratios
Net income 1338 604 4254
No. of outstanding shares 59 59 81
Earnings per share Net income/no. of outstanding shares 22.68 10.24 52.52
Source: Shire, 2017
2015 2016 2017
GP 85% -99% -97%
Operating Profit 24% -244% -241%
NP 21% 16% 87%
2015 2016 2017
-300%
-250%
-200%
-150%
-100%
-50%
0%
50%
100%
150%
SHIRE PLC
GP
Operating Profit
NP
Profitability position of Shire plc is not good as the gross profit of an entity is
showing negative results after the year 2015 that depicts the burden of costs of goods sold on
an entity (Lee, Lin and Shin, 2018). Operating results is increases as shire plc has control
10
⊘ This is a preview!⊘
Do you want full access?
Subscribe today to unlock all pages.
Trusted by 1+ million students worldwide
1 out of 29


Your All-in-One AI-Powered Toolkit for Academic Success.
+13062052269
info@desklib.com
Available 24*7 on WhatsApp / Email
![[object Object]](/_next/static/media/star-bottom.7253800d.svg)
Unlock your academic potential
Copyright © 2020–2026 A2Z Services. All Rights Reserved. Developed and managed by ZUCOL.