Origin Energy Financial Performance Analysis - HI5002 Report
VerifiedAdded on 2023/03/17
|24
|5882
|93
Report
AI Summary
This report provides a comprehensive financial analysis of Origin Energy, an ASX-listed energy company, examining its performance over three financial years. The analysis includes an overview of Origin Energy's operations and competitive advantages, followed by an evaluation of its financial performance using profitability and operational efficiency ratios. A sensitivity analysis is conducted to assess market sensitivity, alongside the calculation of the dividend payout ratio. The report also identifies marketable securities and assesses both systematic and unsystematic risks associated with the business. The findings indicate that the company's current profitability is not strong, and the report does not recommend investment based on its dividend payout and earnings per share ratio.
Company Performance Analysis: Origin Energy
1
1
Paraphrase This Document
Need a fresh take? Get an instant paraphrase of this document with our AI Paraphraser
Abstract
This report has been prepare din the context of examining the annual reports of a selected
ASX listed entity over the past three financial years. As such, it has initially discussed the
operation and comparative advantage of the selected company. It has them undertaken the
examination of its financial performance over the period by calculation and interpretation of the
profitability and operational efficiency ratios. The sensitivity analysis has also been done to
evaluate the market sensitivity of the company. This is followed by calculation of dividend
payout ratio, identification of marketable securities and examination of the systematic and
unsystematic risks related with the business operations. It has been indicated that the company is
not in a good state of profitability in the present and is not recommended to the investors to
invest within the company on the basis of its dividend payout and earnings per share ratio.
2
Contents
Part I: Introduction...........................................................................................................................4
Part II: Financial Analysis of selected company (All these parts will provide in detail in complete
file)...................................................................................................................................................4
2.1: Description of the company..................................................................................................4
2.2: Use of Ratio Analysis to evaluate the financial performance of Origin Energy..................5
Profitability Ratios of Origin Energy.......................................................................................5
Operating Efficiency Ratios.....................................................................................................8
2.3: Management of cash through of marketable securities by Origin Energy..........................10
2.4: Sensitivity Analysis of the given data.................................................................................11
2.5: Risk Analysis (Systematic and Unsystematic Risk)...........................................................16
Systematic risks......................................................................................................................17
Unsystematic risk...................................................................................................................18
2.6: Dividend Payout Ratio and dividend policy adopted by Origin Energy............................19
Part III: Recommendation Letter...................................................................................................19
Part IV: Conclusion.......................................................................................................................20
References......................................................................................................................................21
Appendix........................................................................................................................................22
3
⊘ This is a preview!⊘
Do you want full access?
Subscribe today to unlock all pages.
Trusted by 1+ million students worldwide
Part I: Introduction
Potential investor’s require detailed examination of the company financial performance
before making the valuable decision of investing the funds and becoming the shareholder. In
order to analyse the company financial performance there is need to evaluate lot of financial data
present in the annual reports of the company. It is the responsibility of company’s management
to prepare and publish their annual reports so that investors can use them for analyzing the
financial performance of the company. Investment decision requires investing of current funds
into the long term project to earn the best holding period returns and it is the reason why
evaluation of financial information becomes very important for success of such investment
opportunities. The conception of financial information implies all such information that have
been presented in the audited financial statements of an organization that can be used to ascertain
the financial performance and financial position of such company which investors seeks to make
investment. So it is highly important that appropriate financial tool must be used to evaluate the
financial performance of the company.
The purpose of this report is to analyse the financial performance of one of company
listed on ASX. The aim is to provide the investment advice to potential the investor who seeks to
make investment in the selected company. The company selected for the purpose of analysis is
Origin Energy. Origin Energy deals electricity, natural gas, solar, and LPG and this company is
listed on ASX. Comprehensive examination of the firm’s financial performance has been
performed based on the latest financial statements of Origin Energy. Annual reports of last three
years has been extracted from the investor’s relation section of the company and based on that
financial analyse has been performed. Financial tools used to evaluate the financial statements of
Origin Energy include ratio analysis, cash management analysis, risk analysis and dividend
performance.
Part II: Financial Analysis of selected company (All these parts will provide in detail in
complete file)
2.1: Description of the company
Origin Energy is a publicly listed energy company of Australia that has been
headquartered within Sydney and is traded on Australian Stock Exchange (ASX). It is an
4
Paraphrase This Document
Need a fresh take? Get an instant paraphrase of this document with our AI Paraphraser
integrated energy company that is involved in large-scale exploration, production, generation and
sale of energy product and services to domestic and commercial use within Australia. The core
business activities of the company include retailing of energy products and supplying the
customers electricity, natural gas, LPG and solar. It is also involved in creating renewable energy
and as such is continually seeking investment within wind, solar and storage technologies. It is
also emphasizing towards exploring the reserves of natural gas for developing it as a future
source of energy (Who we are: Origin Energy, 2017).
The company has attained a leading position within the energy sector of Australia
involved in providing electricity to about 4.2 million customers. It aspires to attain number one
position within the renewable energy sector of Australia by continuously focusing on reducing
its carbon footprint through investing in exploration and creation of renewable energy products.
It has launched its carbon reduction scheme within the year 2007 to achieve reduction in its
carbon emission and ensuring the environment protection. In this context, it has also acquired
Eraring Energy, the largest power station of Australia and its cogeneration business provides
low-carbon energy products to the customers within Victoria. The geographic foot print of the
company extends to Australia and New Zealand. The company is a recognized member of the
‘We Mean Business’ coalition that emphasizes on taking adequate action on climate change. IT
has also become the first energy company within Australia in the financial year 2015 to sign up
seven commitments in regards to climatic changes. The progress made by the company in the
key areas for monitoring the climatic changes has been provided within the public disclosures.
The progress made by the company in reducing its carbon footprint and developing energy
products through renewable sources have enabled it to gain competitiveness within the energy
sector of Australia. The natural gas portfolio of the company also enables it to achieve a core
competency within the energy sector of Australia (Who we are: Origin Energy, 2017).
2.2: Use of Ratio Analysis to evaluate the financial performance of Origin Energy
Profitability Ratios of Origin Energy
Financial Data used to calculate profitability ratio
Financial Items 2015 2016 2017 2018
Amount in $ Million
Net profit after tax $ $ $
5
(576.00) (2,223.00) 221.00
Net Sales
$
11,923.00
$
13,646.00
$
14,604.00
Shareholder's equity
$
14,159.00
$
14,530.00
$
11,418.00
$
11,828.00
Average shareholder's
equity
$
14,344.50
$
12,974.00
$
11,623.00
Total Assets
$
33,367.00
$
28,898.00
$
25,199.00
$
24,257.00
Average total assets
$
31,132.50
$
27,048.50
$
24,728.00
Profitability Ratio
Ratios Formula 2016 2017 2018
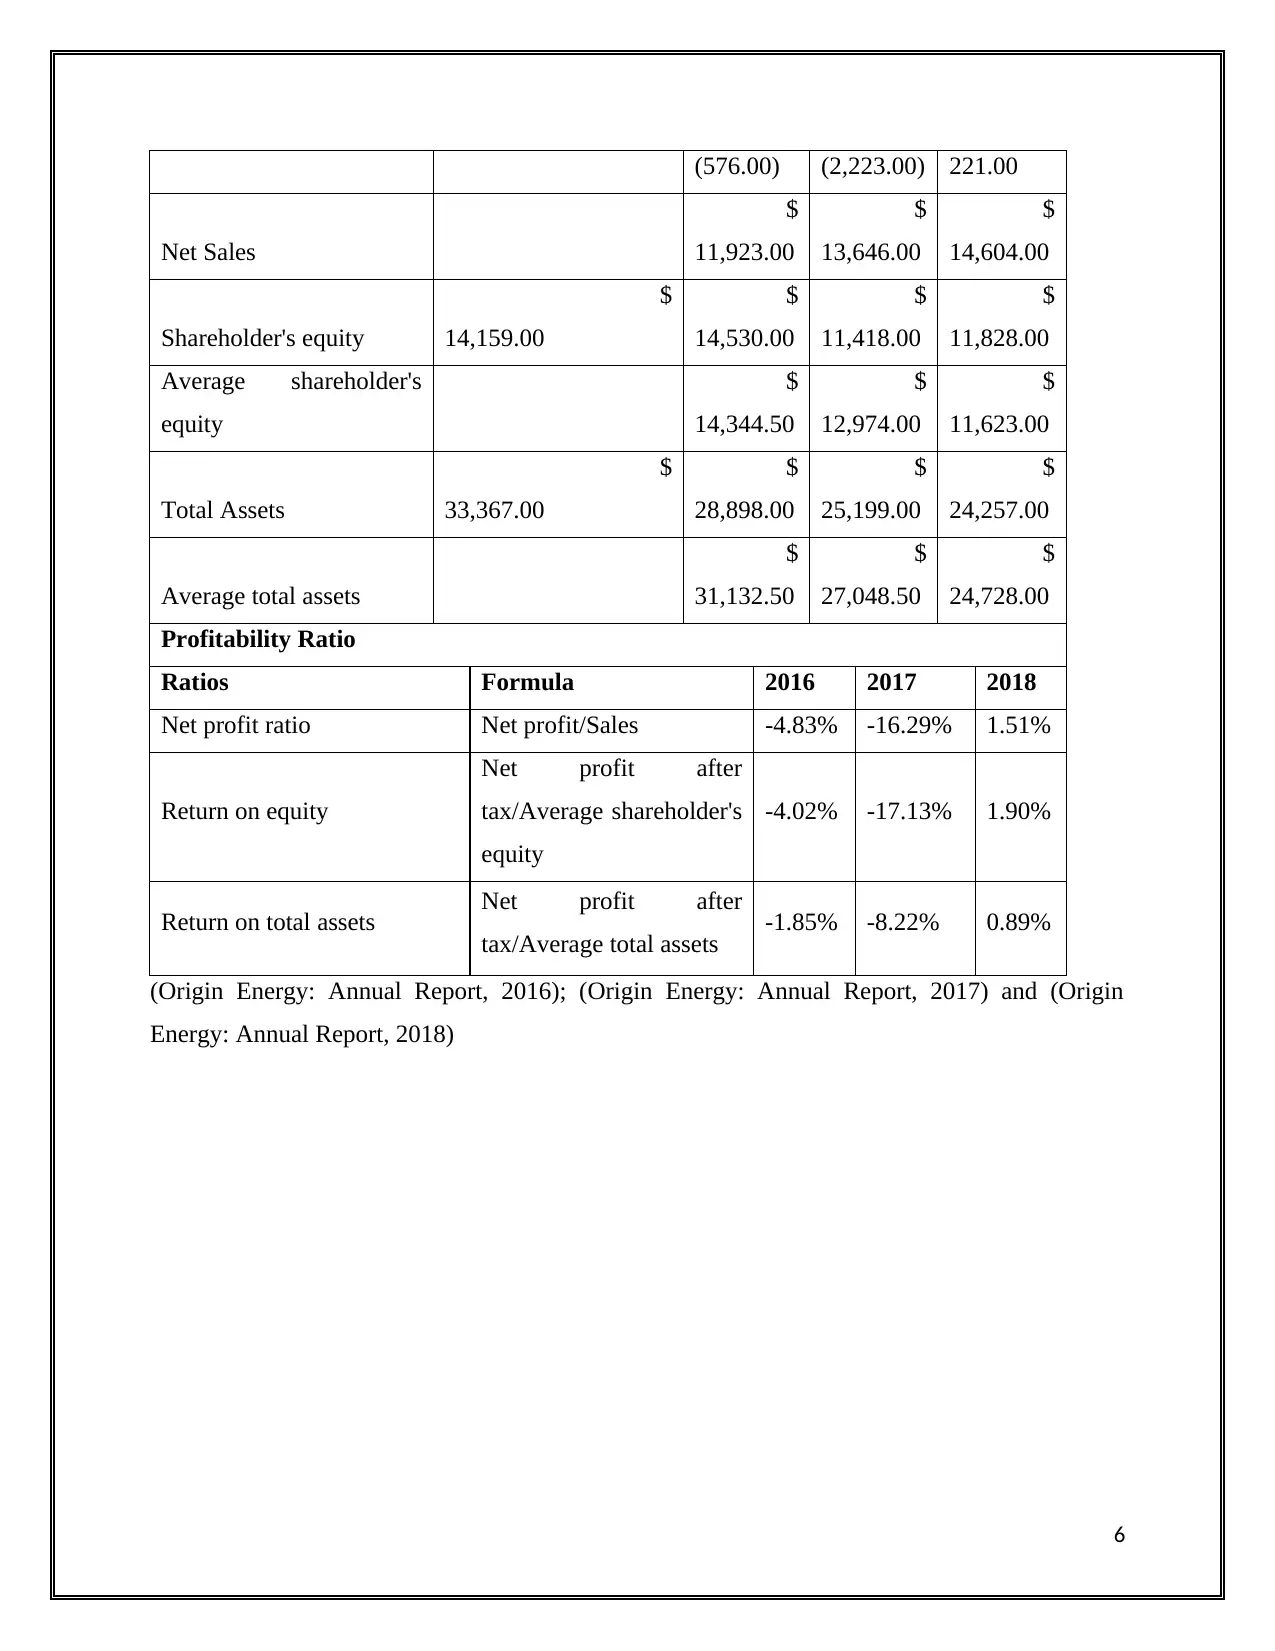
Net profit ratio Net profit/Sales -4.83% -16.29% 1.51%
Return on equity
Net profit after
tax/Average shareholder's
equity
-4.02% -17.13% 1.90%
Return on total assets Net profit after
tax/Average total assets -1.85% -8.22% 0.89%
(Origin Energy: Annual Report, 2016); (Origin Energy: Annual Report, 2017) and (Origin
Energy: Annual Report, 2018)
6
Net Sales
$
11,923.00
$
13,646.00
$
14,604.00
Shareholder's equity
$
14,159.00
$
14,530.00
$
11,418.00
$
11,828.00
Average shareholder's
equity
$
14,344.50
$
12,974.00
$
11,623.00
Total Assets
$
33,367.00
$
28,898.00
$
25,199.00
$
24,257.00
Average total assets
$
31,132.50
$
27,048.50
$
24,728.00
Profitability Ratio
Ratios Formula 2016 2017 2018
Net profit ratio Net profit/Sales -4.83% -16.29% 1.51%
Return on equity
Net profit after
tax/Average shareholder's
equity
-4.02% -17.13% 1.90%
Return on total assets Net profit after
tax/Average total assets -1.85% -8.22% 0.89%
(Origin Energy: Annual Report, 2016); (Origin Energy: Annual Report, 2017) and (Origin
Energy: Annual Report, 2018)
6
⊘ This is a preview!⊘
Do you want full access?
Subscribe today to unlock all pages.
Trusted by 1+ million students worldwide
2016 2017 2018
-20.00%
-15.00%
-10.00%
-5.00%
0.00%
5.00%
-4.83%
-16.29%
1.51%
-4.02%
-17.13%
1.90%
-1.85%
-8.22%
0.89%
Profitability Ratio of Origin Energy
Percentage
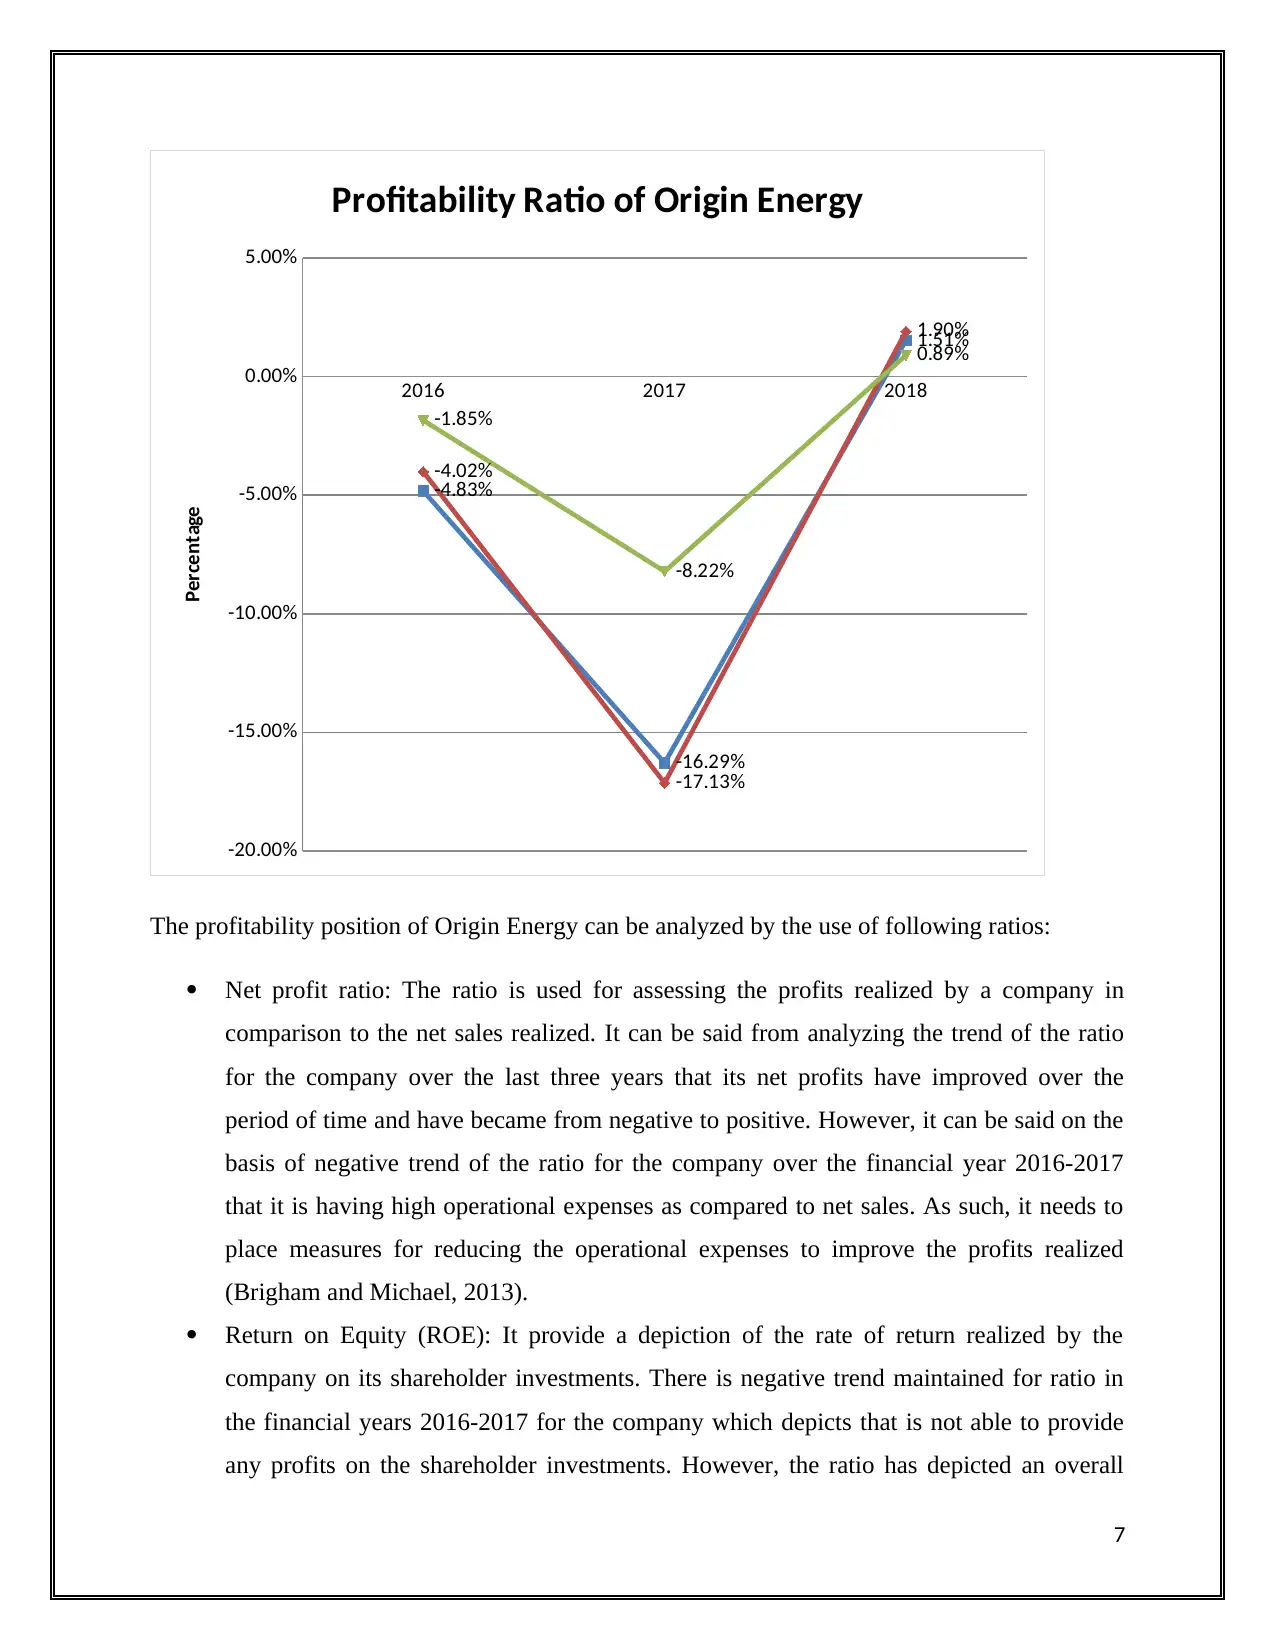
The profitability position of Origin Energy can be analyzed by the use of following ratios:
Net profit ratio: The ratio is used for assessing the profits realized by a company in
comparison to the net sales realized. It can be said from analyzing the trend of the ratio
for the company over the last three years that its net profits have improved over the
period of time and have became from negative to positive. However, it can be said on the
basis of negative trend of the ratio for the company over the financial year 2016-2017
that it is having high operational expenses as compared to net sales. As such, it needs to
place measures for reducing the operational expenses to improve the profits realized
(Brigham and Michael, 2013).
Return on Equity (ROE): It provide a depiction of the rate of return realized by the
company on its shareholder investments. There is negative trend maintained for ratio in
the financial years 2016-2017 for the company which depicts that is not able to provide
any profits on the shareholder investments. However, the ratio has depicted an overall
7
-20.00%
-15.00%
-10.00%
-5.00%
0.00%
5.00%
-4.83%
-16.29%
1.51%
-4.02%
-17.13%
1.90%
-1.85%
-8.22%
0.89%
Profitability Ratio of Origin Energy
Percentage
The profitability position of Origin Energy can be analyzed by the use of following ratios:
Net profit ratio: The ratio is used for assessing the profits realized by a company in
comparison to the net sales realized. It can be said from analyzing the trend of the ratio
for the company over the last three years that its net profits have improved over the
period of time and have became from negative to positive. However, it can be said on the
basis of negative trend of the ratio for the company over the financial year 2016-2017
that it is having high operational expenses as compared to net sales. As such, it needs to
place measures for reducing the operational expenses to improve the profits realized
(Brigham and Michael, 2013).
Return on Equity (ROE): It provide a depiction of the rate of return realized by the
company on its shareholder investments. There is negative trend maintained for ratio in
the financial years 2016-2017 for the company which depicts that is not able to provide
any profits on the shareholder investments. However, the ratio has depicted an overall
7
Paraphrase This Document
Need a fresh take? Get an instant paraphrase of this document with our AI Paraphraser
increase from -4.02 % to 1.90% for the company over the period which means that it is
able to provide positive return to the shareholders only in the year 2018. In this context,
the company is suggested to reduce the cost of debt for providing positive returns to the
shareholders (Bragg, 2010).
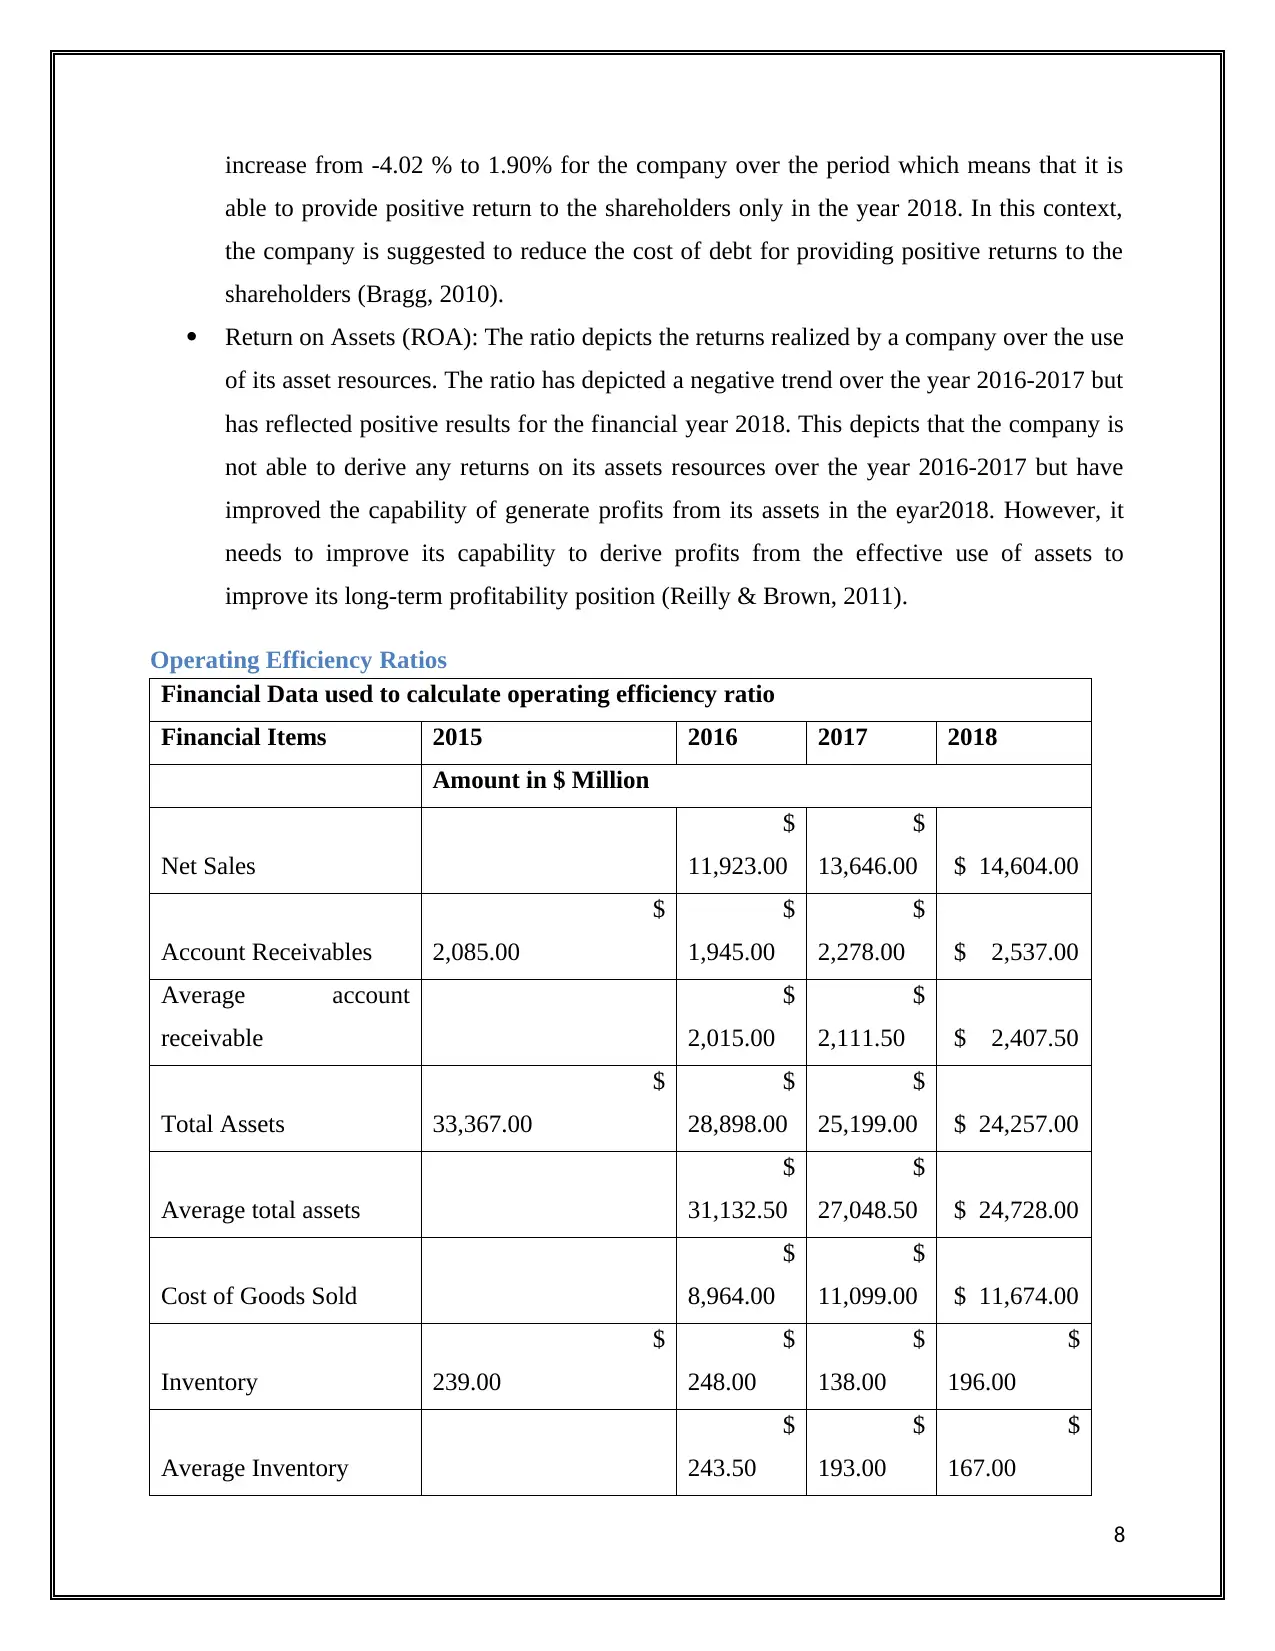
Return on Assets (ROA): The ratio depicts the returns realized by a company over the use
of its asset resources. The ratio has depicted a negative trend over the year 2016-2017 but
has reflected positive results for the financial year 2018. This depicts that the company is
not able to derive any returns on its assets resources over the year 2016-2017 but have
improved the capability of generate profits from its assets in the eyar2018. However, it
needs to improve its capability to derive profits from the effective use of assets to
improve its long-term profitability position (Reilly & Brown, 2011).
Operating Efficiency Ratios
Financial Data used to calculate operating efficiency ratio
Financial Items 2015 2016 2017 2018
Amount in $ Million
Net Sales
$
11,923.00
$
13,646.00 $ 14,604.00
Account Receivables
$
2,085.00
$
1,945.00
$
2,278.00 $ 2,537.00
Average account
receivable
$
2,015.00
$
2,111.50 $ 2,407.50
Total Assets
$
33,367.00
$
28,898.00
$
25,199.00 $ 24,257.00
Average total assets
$
31,132.50
$
27,048.50 $ 24,728.00
Cost of Goods Sold
$
8,964.00
$
11,099.00 $ 11,674.00
Inventory
$
239.00
$
248.00
$
138.00
$
196.00
Average Inventory
$
243.50
$
193.00
$
167.00
8
able to provide positive return to the shareholders only in the year 2018. In this context,
the company is suggested to reduce the cost of debt for providing positive returns to the
shareholders (Bragg, 2010).
Return on Assets (ROA): The ratio depicts the returns realized by a company over the use
of its asset resources. The ratio has depicted a negative trend over the year 2016-2017 but
has reflected positive results for the financial year 2018. This depicts that the company is
not able to derive any returns on its assets resources over the year 2016-2017 but have
improved the capability of generate profits from its assets in the eyar2018. However, it
needs to improve its capability to derive profits from the effective use of assets to
improve its long-term profitability position (Reilly & Brown, 2011).
Operating Efficiency Ratios
Financial Data used to calculate operating efficiency ratio
Financial Items 2015 2016 2017 2018
Amount in $ Million
Net Sales
$
11,923.00
$
13,646.00 $ 14,604.00
Account Receivables
$
2,085.00
$
1,945.00
$
2,278.00 $ 2,537.00
Average account
receivable
$
2,015.00
$
2,111.50 $ 2,407.50
Total Assets
$
33,367.00
$
28,898.00
$
25,199.00 $ 24,257.00
Average total assets
$
31,132.50
$
27,048.50 $ 24,728.00
Cost of Goods Sold
$
8,964.00
$
11,099.00 $ 11,674.00
Inventory
$
239.00
$
248.00
$
138.00
$
196.00
Average Inventory
$
243.50
$
193.00
$
167.00
8
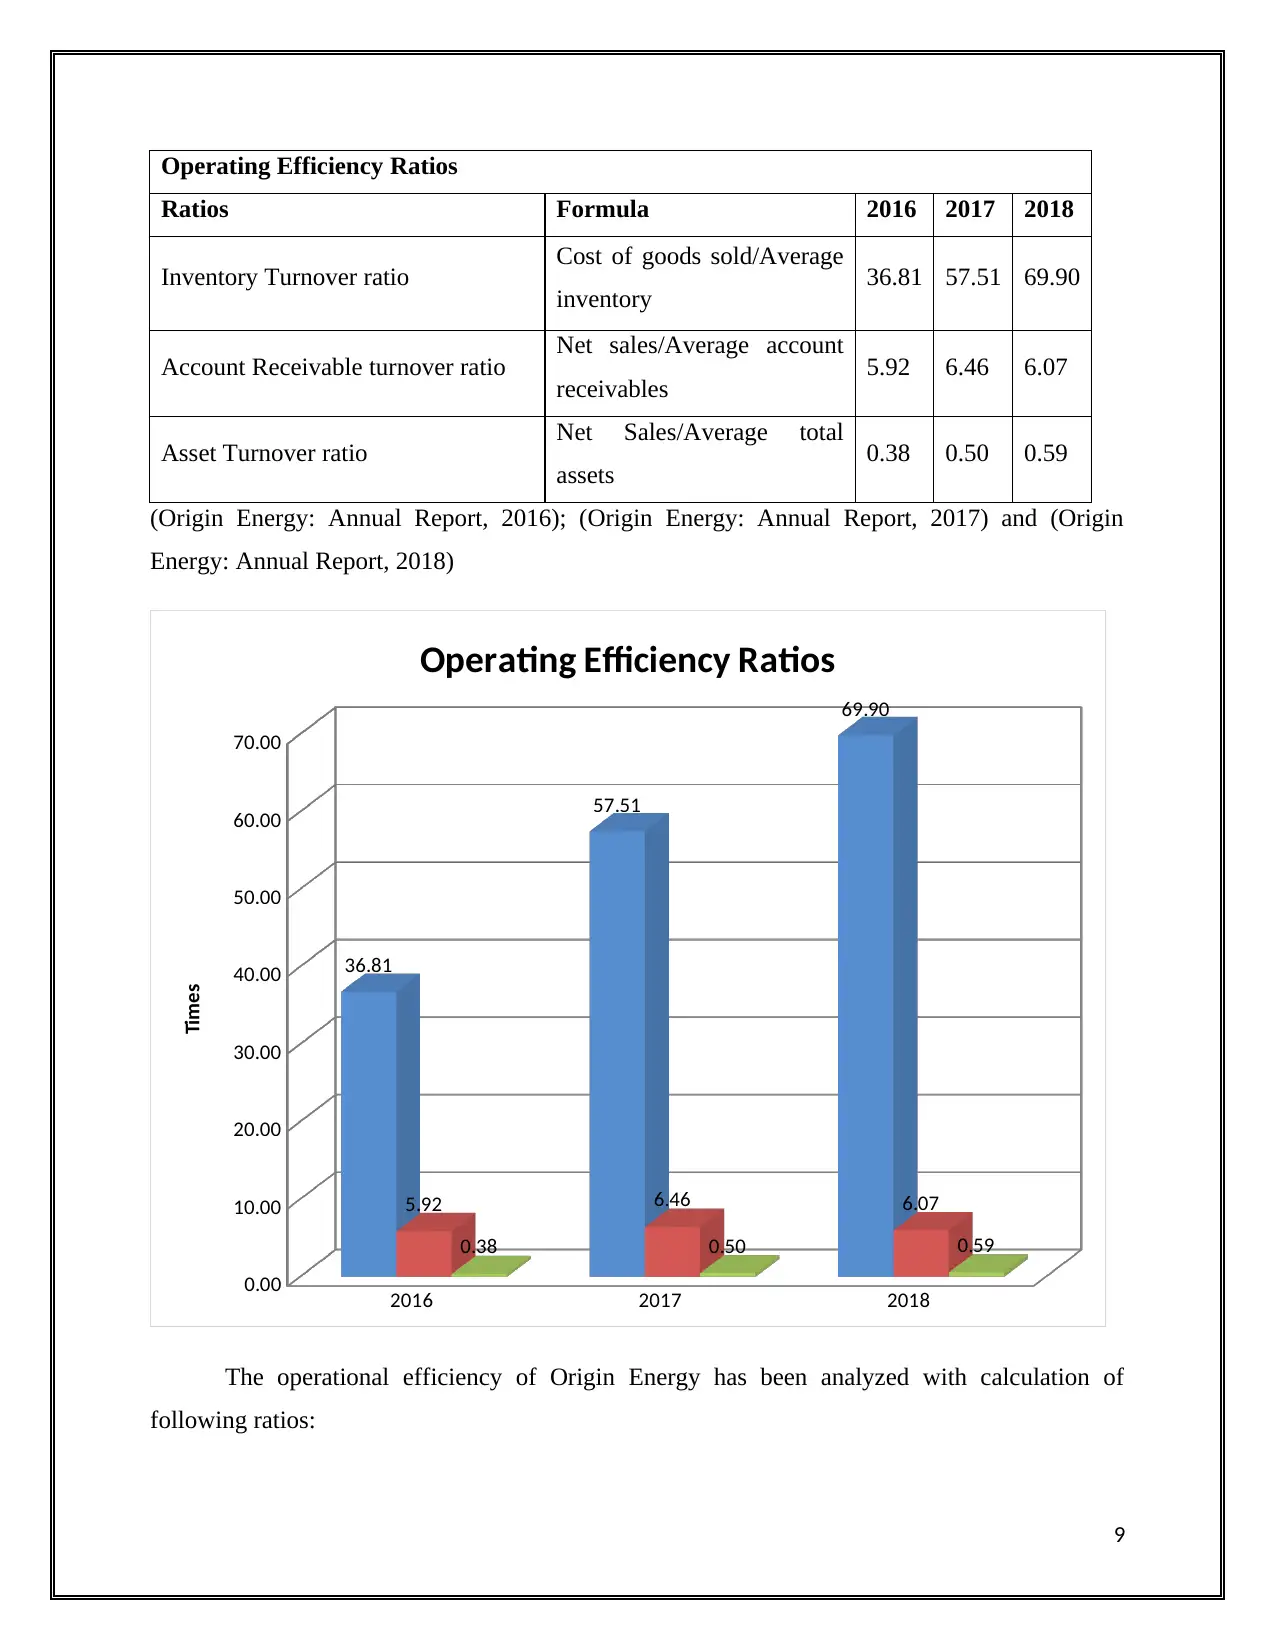
Operating Efficiency Ratios
Ratios Formula 2016 2017 2018
Inventory Turnover ratio Cost of goods sold/Average
inventory 36.81 57.51 69.90
Account Receivable turnover ratio Net sales/Average account
receivables 5.92 6.46 6.07
Asset Turnover ratio Net Sales/Average total
assets 0.38 0.50 0.59
(Origin Energy: Annual Report, 2016); (Origin Energy: Annual Report, 2017) and (Origin
Energy: Annual Report, 2018)
2016 2017 2018
0.00
10.00
20.00
30.00
40.00
50.00
60.00
70.00
36.81
57.51
69.90
5.92 6.46 6.07
0.38 0.50 0.59
Operating Efficiency Ratios
Times
The operational efficiency of Origin Energy has been analyzed with calculation of
following ratios:
9
⊘ This is a preview!⊘
Do you want full access?
Subscribe today to unlock all pages.
Trusted by 1+ million students worldwide
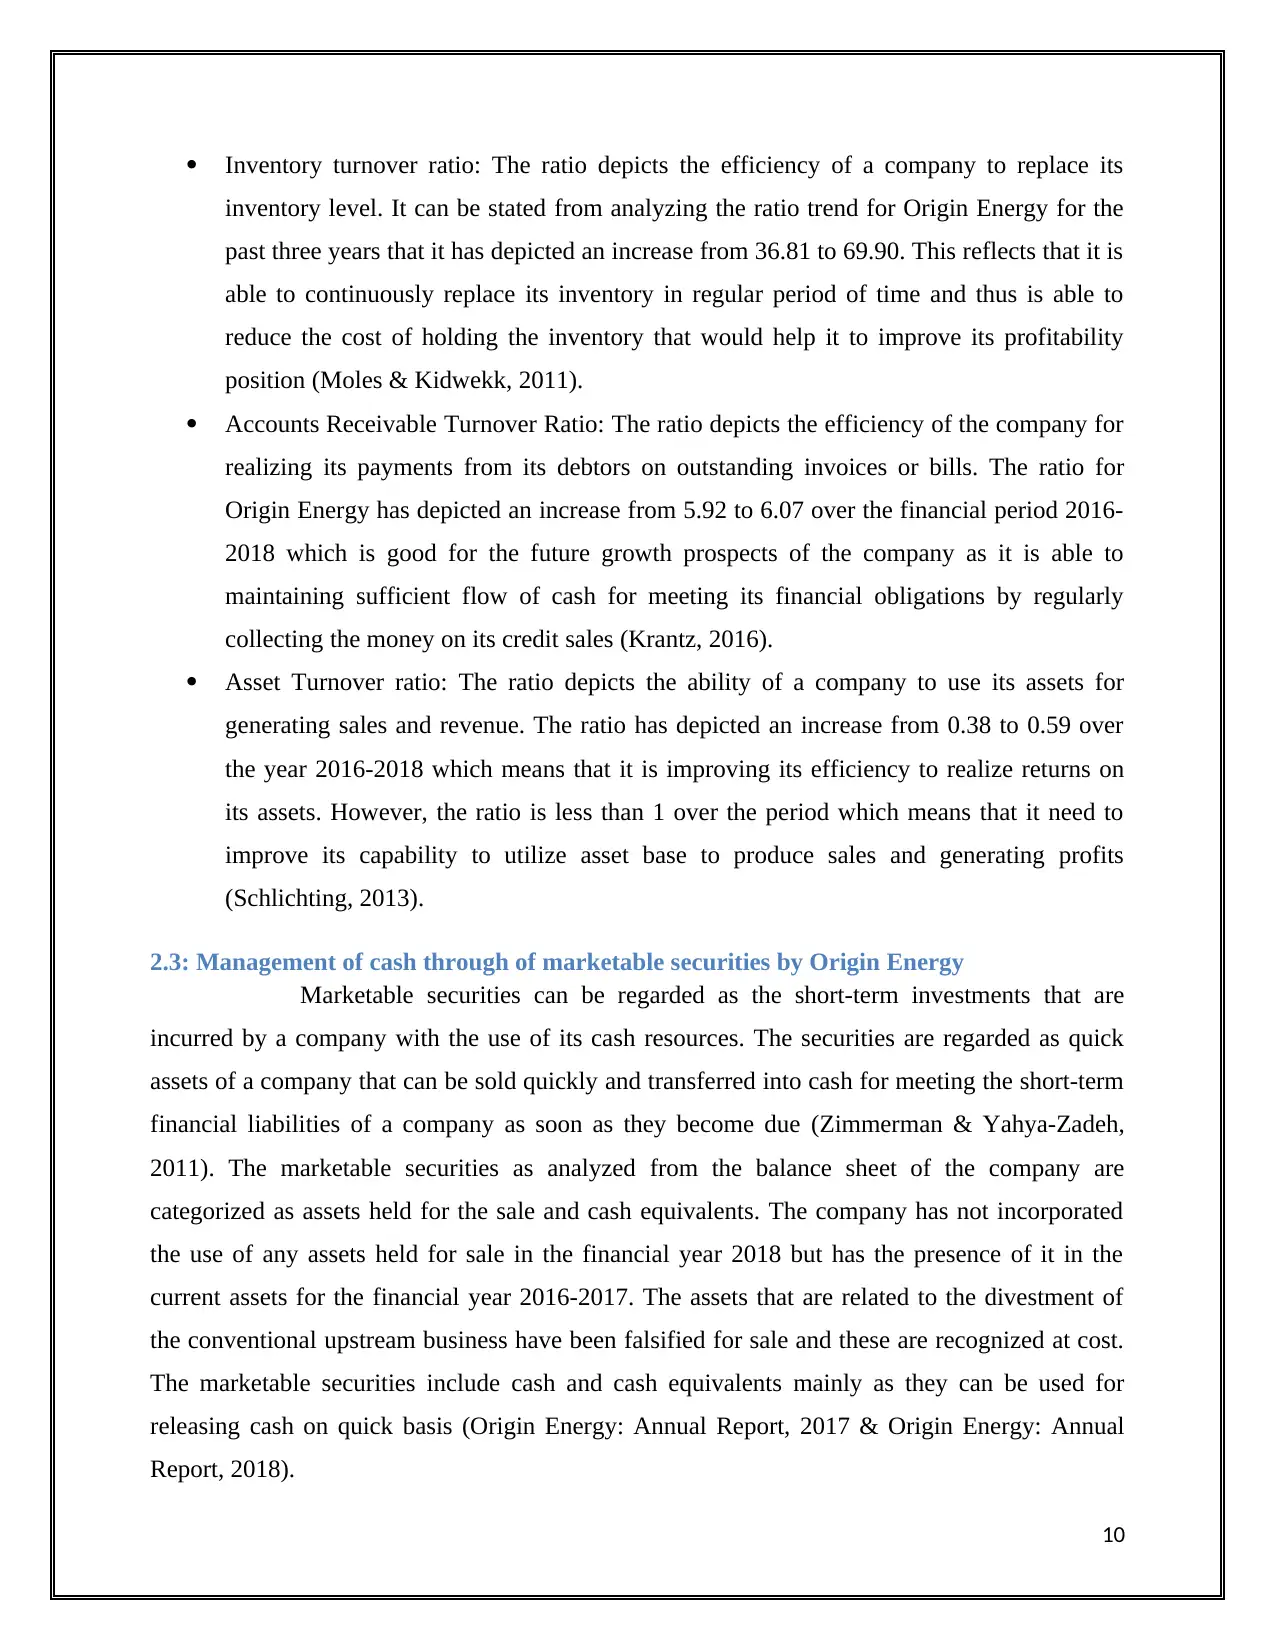
Inventory turnover ratio: The ratio depicts the efficiency of a company to replace its
inventory level. It can be stated from analyzing the ratio trend for Origin Energy for the
past three years that it has depicted an increase from 36.81 to 69.90. This reflects that it is
able to continuously replace its inventory in regular period of time and thus is able to
reduce the cost of holding the inventory that would help it to improve its profitability
position (Moles & Kidwekk, 2011).
Accounts Receivable Turnover Ratio: The ratio depicts the efficiency of the company for
realizing its payments from its debtors on outstanding invoices or bills. The ratio for
Origin Energy has depicted an increase from 5.92 to 6.07 over the financial period 2016-
2018 which is good for the future growth prospects of the company as it is able to
maintaining sufficient flow of cash for meeting its financial obligations by regularly
collecting the money on its credit sales (Krantz, 2016).
Asset Turnover ratio: The ratio depicts the ability of a company to use its assets for
generating sales and revenue. The ratio has depicted an increase from 0.38 to 0.59 over
the year 2016-2018 which means that it is improving its efficiency to realize returns on
its assets. However, the ratio is less than 1 over the period which means that it need to
improve its capability to utilize asset base to produce sales and generating profits
(Schlichting, 2013).
2.3: Management of cash through of marketable securities by Origin Energy
Marketable securities can be regarded as the short-term investments that are
incurred by a company with the use of its cash resources. The securities are regarded as quick
assets of a company that can be sold quickly and transferred into cash for meeting the short-term
financial liabilities of a company as soon as they become due (Zimmerman & Yahya-Zadeh,
2011). The marketable securities as analyzed from the balance sheet of the company are
categorized as assets held for the sale and cash equivalents. The company has not incorporated
the use of any assets held for sale in the financial year 2018 but has the presence of it in the
current assets for the financial year 2016-2017. The assets that are related to the divestment of
the conventional upstream business have been falsified for sale and these are recognized at cost.
The marketable securities include cash and cash equivalents mainly as they can be used for
releasing cash on quick basis (Origin Energy: Annual Report, 2017 & Origin Energy: Annual
Report, 2018).
10
Paraphrase This Document
Need a fresh take? Get an instant paraphrase of this document with our AI Paraphraser
.
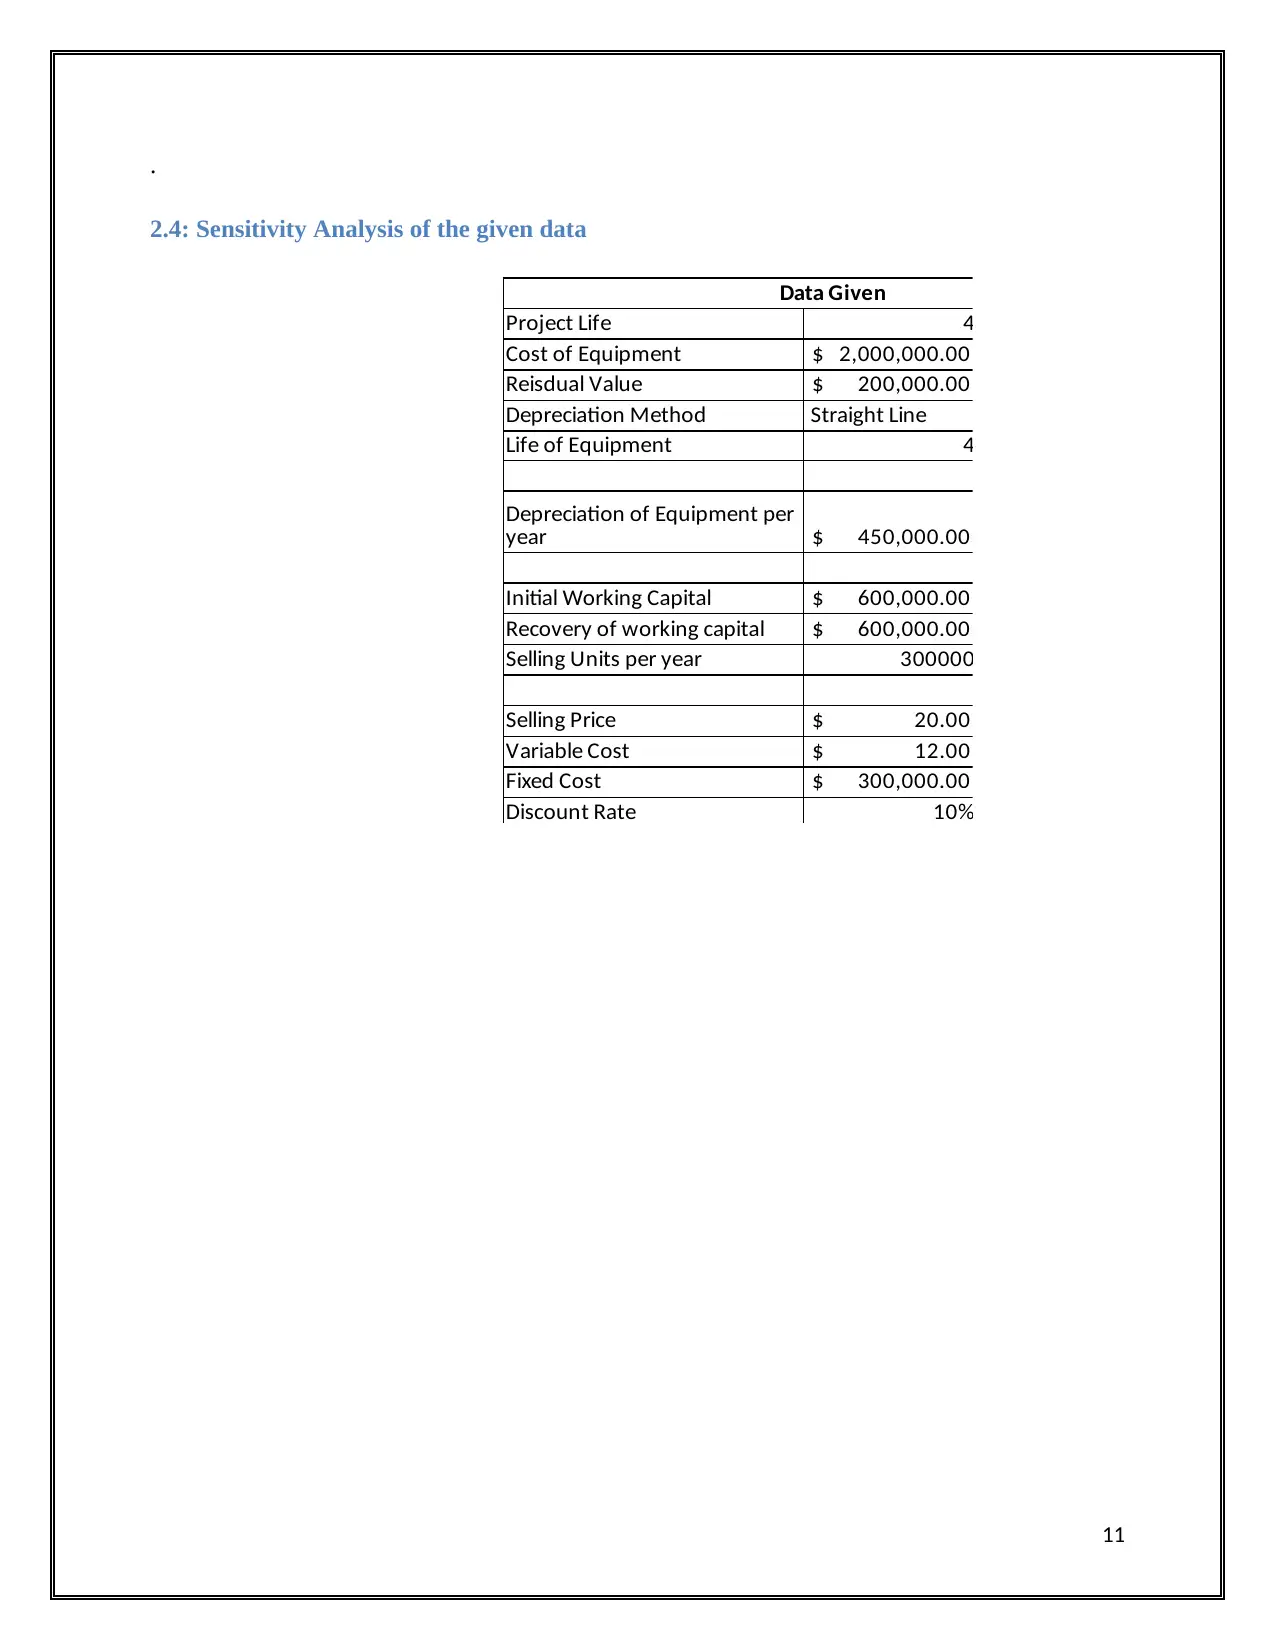
2.4: Sensitivity Analysis of the given data
Data Given
Project Life 4
Cost of Equipment $ 2,000,000.00
Reisdual Value $ 200,000.00
Depreciation Method Straight Line
Life of Equipment 4
$ 450,000.00
Initial Working Capital $ 600,000.00
Recovery of working capital $ 600,000.00
Selling Units per year 300000
Selling Price $ 20.00
Variable Cost $ 12.00
Fixed Cost $ 300,000.00
Discount Rate 10%
Depreciation of Equipment per
year
11
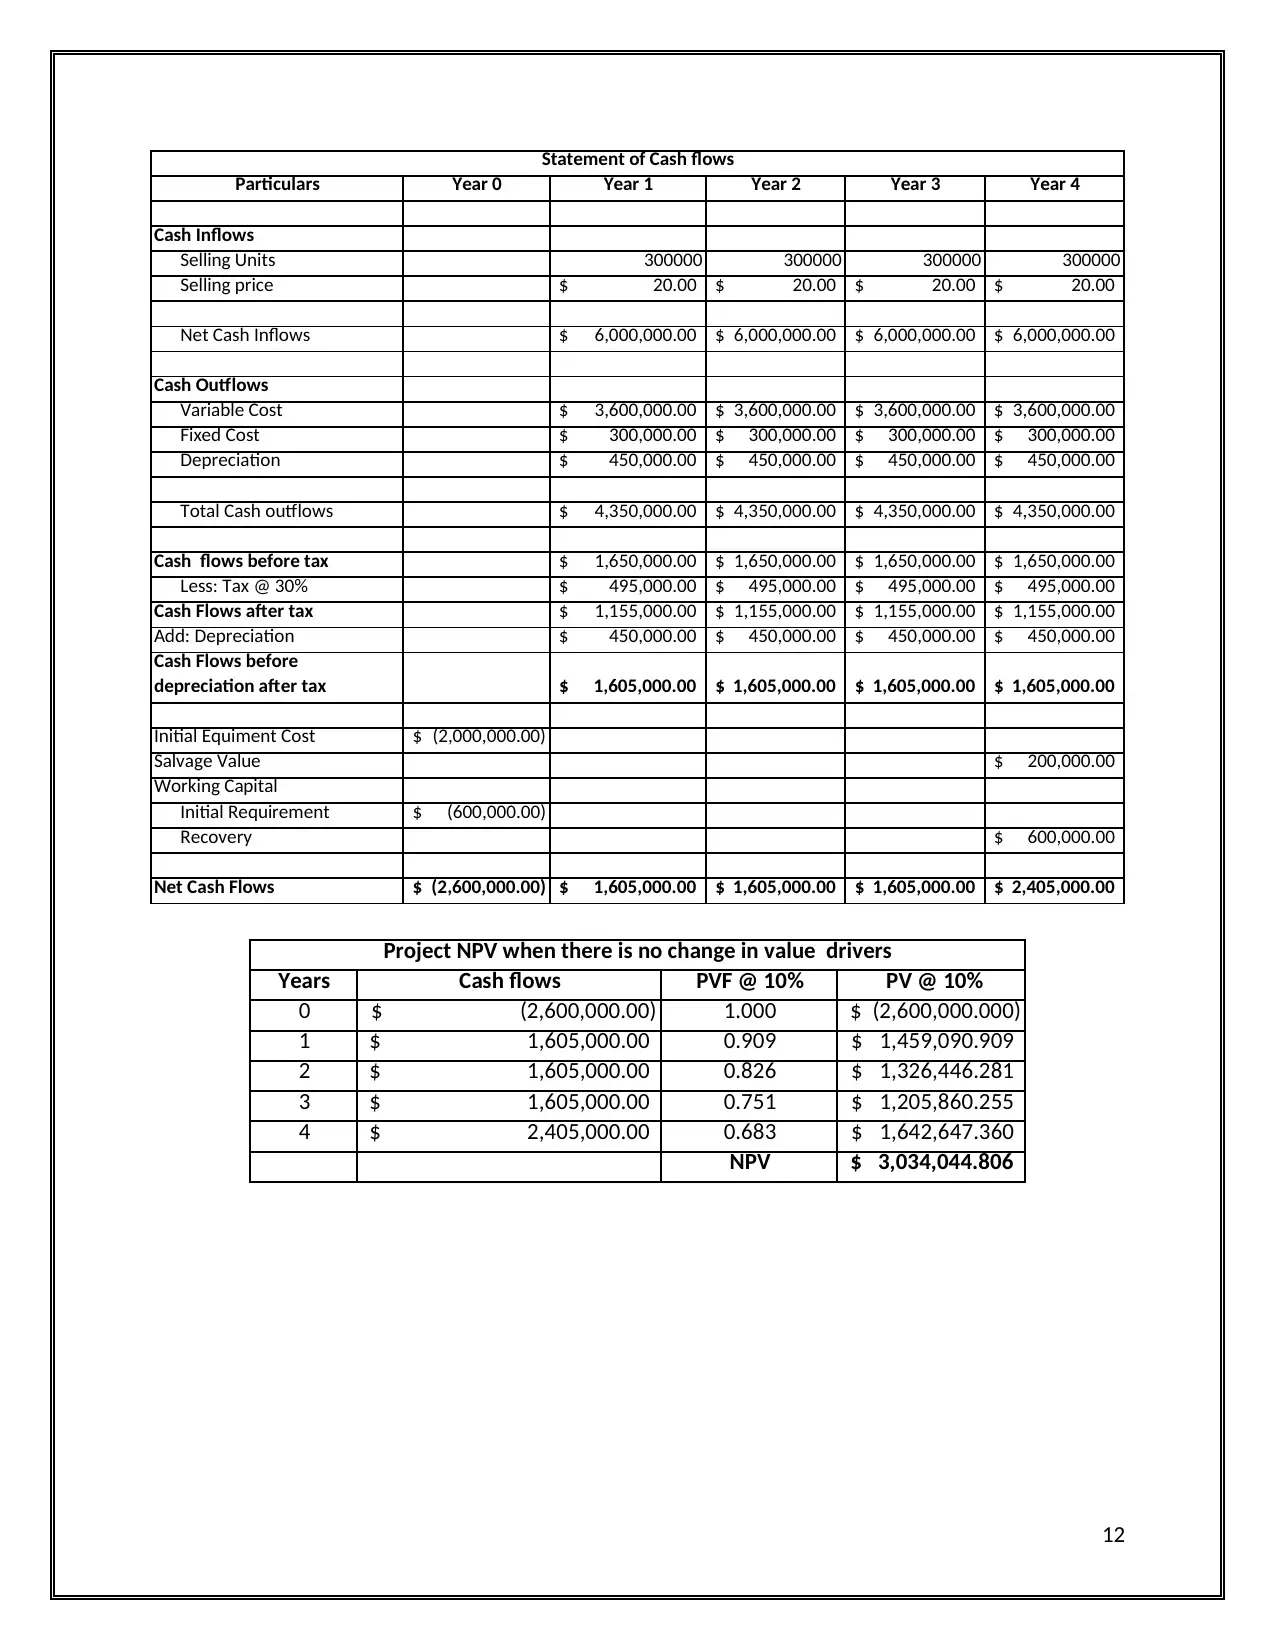
Particulars Year 0 Year 1 Year 2 Year 3 Year 4
Cash Inflows
Selling Units 300000 300000 300000 300000
Selling price 20.00$ 20.00$ 20.00$ 20.00$
Net Cash Inflows 6,000,000.00$ 6,000,000.00$ 6,000,000.00$ 6,000,000.00$
Cash Outflows
Variable Cost 3,600,000.00$ 3,600,000.00$ 3,600,000.00$ 3,600,000.00$
Fixed Cost 300,000.00$ 300,000.00$ 300,000.00$ 300,000.00$
Depreciation 450,000.00$ 450,000.00$ 450,000.00$ 450,000.00$
Total Cash outflows 4,350,000.00$ 4,350,000.00$ 4,350,000.00$ 4,350,000.00$
Cash flows before tax 1,650,000.00$ 1,650,000.00$ 1,650,000.00$ 1,650,000.00$
Less: Tax @ 30% 495,000.00$ 495,000.00$ 495,000.00$ 495,000.00$
Cash Flows after tax 1,155,000.00$ 1,155,000.00$ 1,155,000.00$ 1,155,000.00$
Add: Depreciation 450,000.00$ 450,000.00$ 450,000.00$ 450,000.00$
Cash Flows before
depreciation after tax 1,605,000.00$ 1,605,000.00$ 1,605,000.00$ 1,605,000.00$
Initial Equiment Cost (2,000,000.00)$
Salvage Value 200,000.00$
Working Capital
Initial Requirement (600,000.00)$
Recovery 600,000.00$
Net Cash Flows (2,600,000.00)$ 1,605,000.00$ 1,605,000.00$ 1,605,000.00$ 2,405,000.00$
Statement of Cash flows
Years Cash flows PVF @ 10% PV @ 10%
0 (2,600,000.00)$ 1.000 (2,600,000.000)$
1 1,605,000.00$ 0.909 1,459,090.909$
2 1,605,000.00$ 0.826 1,326,446.281$
3 1,605,000.00$ 0.751 1,205,860.255$
4 2,405,000.00$ 0.683 1,642,647.360$
NPV 3,034,044.806$
Project NPV when there is no change in value drivers
12
⊘ This is a preview!⊘
Do you want full access?
Subscribe today to unlock all pages.
Trusted by 1+ million students worldwide
1 out of 24
Related Documents


Your All-in-One AI-Powered Toolkit for Academic Success.
+13062052269
info@desklib.com
Available 24*7 on WhatsApp / Email
![[object Object]](/_next/static/media/star-bottom.7253800d.svg)
Unlock your academic potential
Copyright © 2020–2026 A2Z Services. All Rights Reserved. Developed and managed by ZUCOL.