Management Accounting Report: Financial Health of Two Companies
VerifiedAdded on 2021/04/16
|18
|3787
|32
Report
AI Summary
This report provides a comprehensive financial analysis of Alpine Construction Ltd and Maple Builders Ltd, subsidiaries of BC Ltd, evaluating their financial performance, solvency, and long-term profit potential. The analysis includes a comparison of financial ratios such as gross profit margin, net profit margin, current ratio, quick ratio, debt-to-equity ratio, and EPS/DPS to assess the financial health and stability of each company. The report identifies Maple Builders Ltd as the better-performing subsidiary, recommending that BC Ltd divest from Alpine Construction Ltd to improve its return on investment. It suggests improvements for Maple Builders Ltd in asset utilization, current ratio, and return on assets. The report also explains solvency tests in accordance with the Companies Act 1993 and determines whether dividend payments are feasible. Finally, it acknowledges limitations of the financial analysis and suggests variations that might exist within the report.
Running head: MANAGEMENT ACCOUNTING
Management Accounting
Name of the Student:
Name of the University:
Authors Note:
Management Accounting
Name of the Student:
Name of the University:
Authors Note:
Paraphrase This Document
Need a fresh take? Get an instant paraphrase of this document with our AI Paraphraser
MANAGEMENT ACCOUNTING
1
Executive Summary:
The overall assessment focuses in evaluating the overall financial performance of Alpine
Construction ltd and Maple Builder Ltd is mainly evaluated to identify the best performing
subsidiary. The financial ratios, solvency position and recommendation could be identified
for detecting financial performance of the company. The evaluation relevantly helps in
conducting solvency condition where relevant limitations and variations of financial analysis
could be identified. Therefore, BC Ltd should divest from Alpine construction for reducing
the looses and increase return from investment.
MANAGEMENT ACCOUNTING
2
Table of Contents
Introduction:...............................................................................................................................3
1. Comparing two companies in term of financial health/position:...........................................3
1.1 Depicting the best long-term profit potential of both the companies:.................................3
1.2 Depicting most financially stable position of both the companies:.....................................4
1.3 Depicting company who runs most efficiently:...................................................................6
1.4 Depicting which subsidiary is in the best market position:..................................................7
1.5 Depicting which subsidiary is the most solvent:..................................................................8
1.6 Depicting which subsidiary compares most favourably within the industry:......................9
2. Depicting the conclusion drawn from financial analysis, while depicting the company with
better financial health/position and why:.................................................................................10
3. Recommendations for BC Ltd:............................................................................................10
3.1 Recommendation for BC Ltd on which of the two companies it should divest from:.......10
3.2 Suggesting three ways in which improvements in business can be conducted in the
company that is not recommended for divesting:....................................................................11
4. Dividend payments:.............................................................................................................11
4.1 Explaining the Solvency Tests in accordance with the Companies Act 1993:..................11
4.2 Selecting and applying amounts in accordance with the solvency test and depicting
whether the dividend could be paid:........................................................................................12
5. Limitations & variations:.....................................................................................................12
5.1 Explaining the limitation of financial analysis:.................................................................12
5.2 Suggesting and explaining any variations that might exist within the report:...................13
Conclusion:..............................................................................................................................13
Reference and Bibliography:....................................................................................................14
Appendices:..............................................................................................................................16
⊘ This is a preview!⊘
Do you want full access?
Subscribe today to unlock all pages.
Trusted by 1+ million students worldwide
MANAGEMENT ACCOUNTING
3
Introduction:
The overall assessment mainly helps in identifying the overall financial viability of
Maple Builders Ltd and Alpine construction. In addition, relevant recommendation is mainly
conducted to BC Ltd for improv their financial performance and minimises the negative
impact from declining sales revenue. Relevant suggestion is mainly stated in the assessment
for improving the business conduction of BC Ltd. The solvency test is mainly conducted on
dividend payment, which helps in detecting the financial performance of the company.
Lastly, adequate recommendations are conducted for BC Ltd for improving the level of
returns from investment.
1. Comparing two companies in term of financial health/position:
1.1 Depicting the best long-term profit potential of both the companies:
Alpine
Construction
2015
Alpine
Construction
2016
Maple Builders
Ltd 2015
Maple Builders
Ltd 2016
0.00%
10.00%
20.00%
30.00%
40.00%
50.00%
60.00%
70.00%
80.00%
Profitability Ratios
1) Gross profit margin 2) Net Profit margin 3) Return on Asset
Name of Ratio 2015 2016 2015 2016
Profitability Ratios
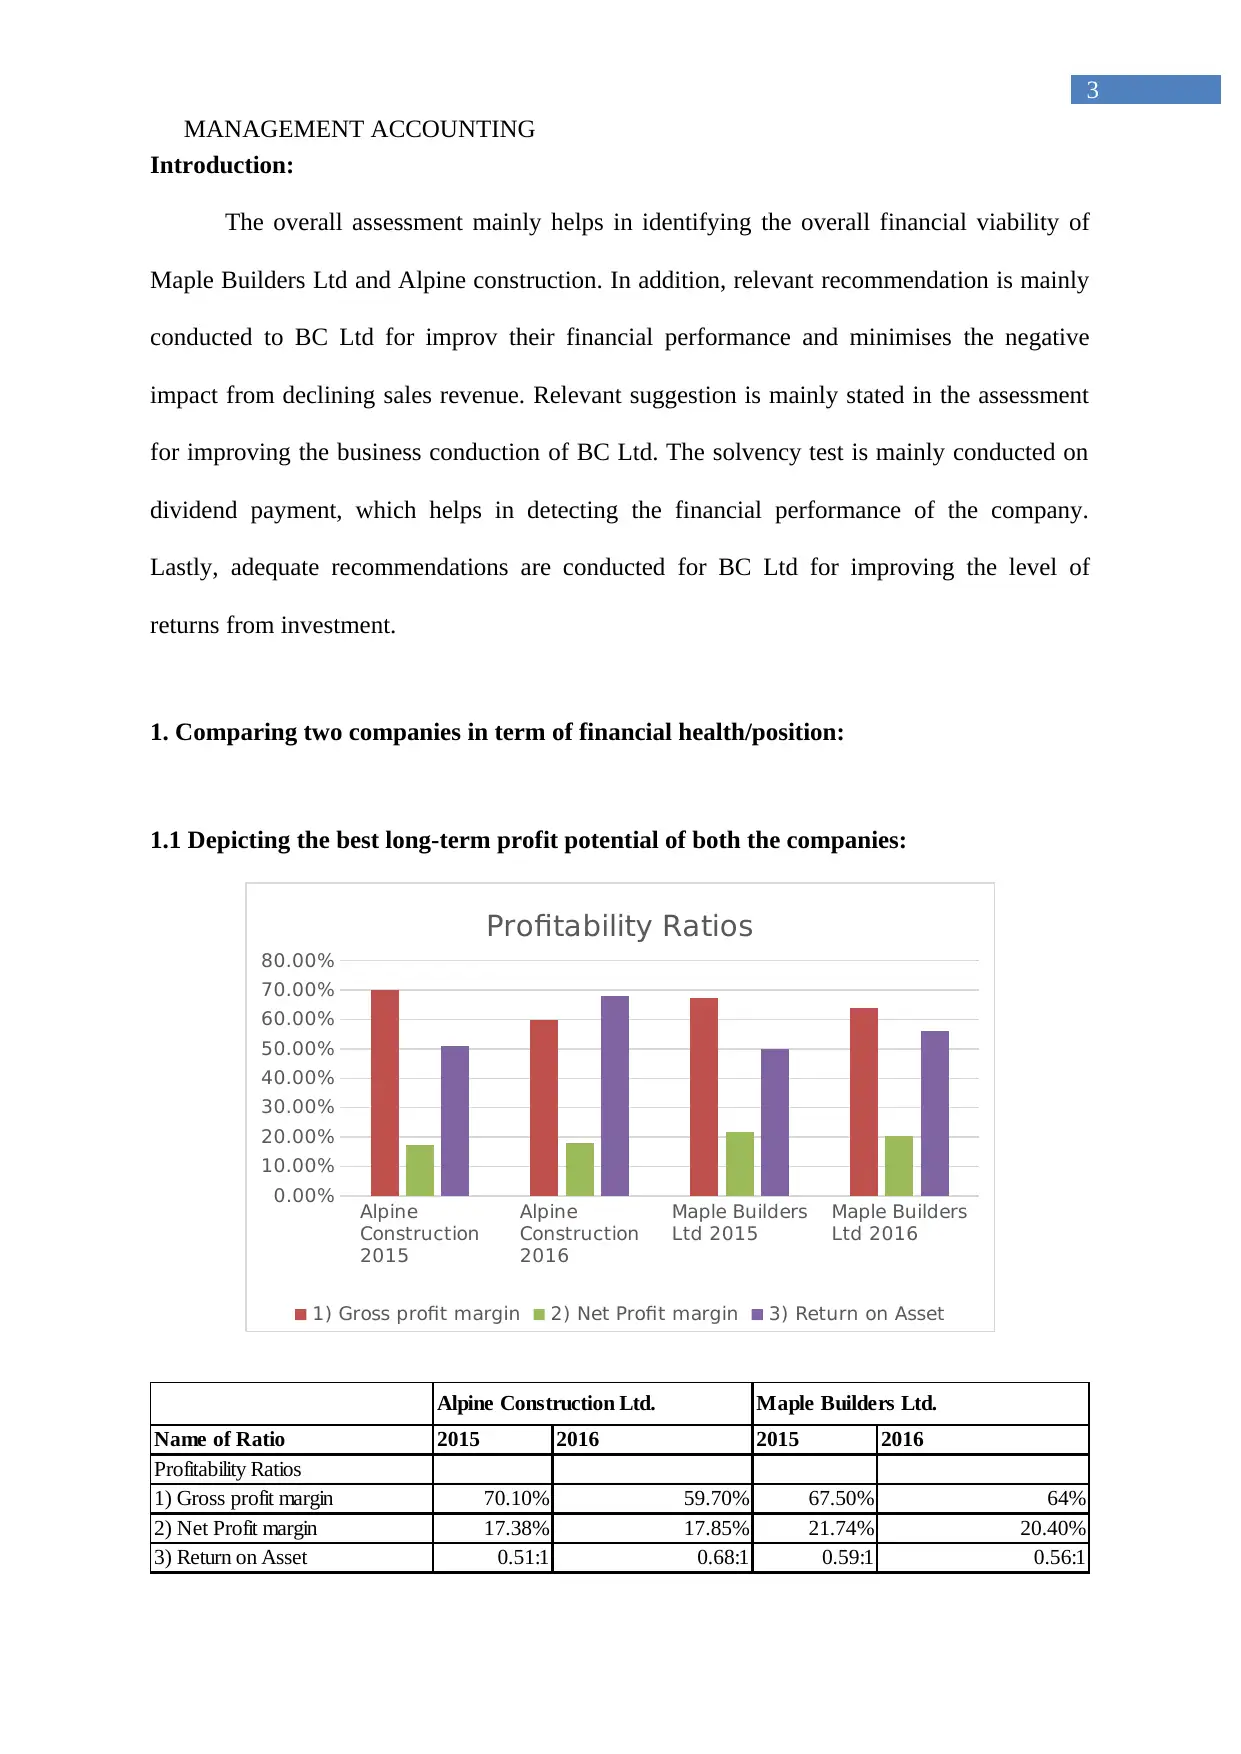
1) Gross profit margin 70.10% 59.70% 67.50% 64%
2) Net Profit margin 17.38% 17.85% 21.74% 20.40%
3) Return on Asset 0.51:1 0.68:1 0.59:1 0.56:1
Alpine Construction Ltd. Maple Builders Ltd.
3
Introduction:
The overall assessment mainly helps in identifying the overall financial viability of
Maple Builders Ltd and Alpine construction. In addition, relevant recommendation is mainly
conducted to BC Ltd for improv their financial performance and minimises the negative
impact from declining sales revenue. Relevant suggestion is mainly stated in the assessment
for improving the business conduction of BC Ltd. The solvency test is mainly conducted on
dividend payment, which helps in detecting the financial performance of the company.
Lastly, adequate recommendations are conducted for BC Ltd for improving the level of
returns from investment.
1. Comparing two companies in term of financial health/position:
1.1 Depicting the best long-term profit potential of both the companies:
Alpine
Construction
2015
Alpine
Construction
2016
Maple Builders
Ltd 2015
Maple Builders
Ltd 2016
0.00%
10.00%
20.00%
30.00%
40.00%
50.00%
60.00%
70.00%
80.00%
Profitability Ratios
1) Gross profit margin 2) Net Profit margin 3) Return on Asset
Name of Ratio 2015 2016 2015 2016
Profitability Ratios
1) Gross profit margin 70.10% 59.70% 67.50% 64%
2) Net Profit margin 17.38% 17.85% 21.74% 20.40%
3) Return on Asset 0.51:1 0.68:1 0.59:1 0.56:1
Alpine Construction Ltd. Maple Builders Ltd.
Paraphrase This Document
Need a fresh take? Get an instant paraphrase of this document with our AI Paraphraser
MANAGEMENT ACCOUNTING
4
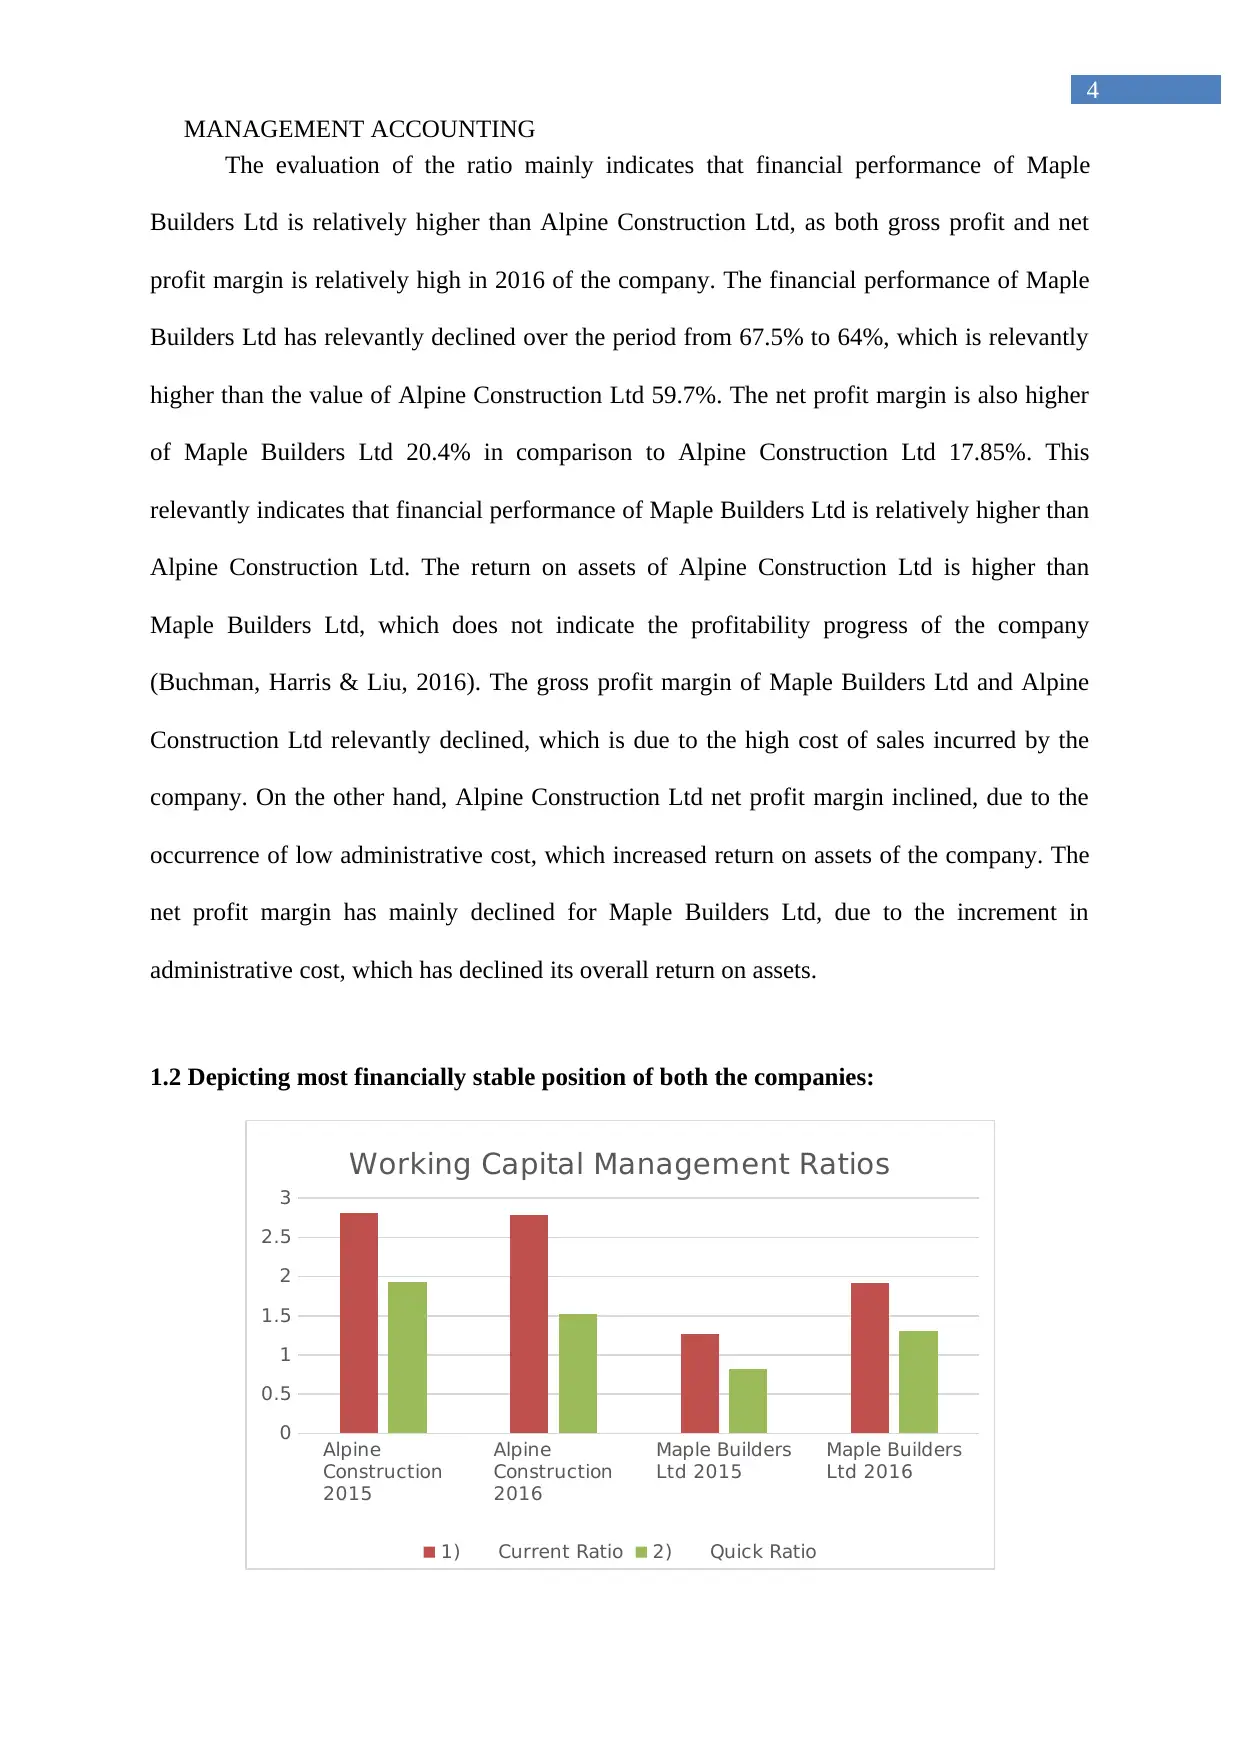
The evaluation of the ratio mainly indicates that financial performance of Maple
Builders Ltd is relatively higher than Alpine Construction Ltd, as both gross profit and net
profit margin is relatively high in 2016 of the company. The financial performance of Maple
Builders Ltd has relevantly declined over the period from 67.5% to 64%, which is relevantly
higher than the value of Alpine Construction Ltd 59.7%. The net profit margin is also higher
of Maple Builders Ltd 20.4% in comparison to Alpine Construction Ltd 17.85%. This
relevantly indicates that financial performance of Maple Builders Ltd is relatively higher than
Alpine Construction Ltd. The return on assets of Alpine Construction Ltd is higher than
Maple Builders Ltd, which does not indicate the profitability progress of the company
(Buchman, Harris & Liu, 2016). The gross profit margin of Maple Builders Ltd and Alpine
Construction Ltd relevantly declined, which is due to the high cost of sales incurred by the
company. On the other hand, Alpine Construction Ltd net profit margin inclined, due to the
occurrence of low administrative cost, which increased return on assets of the company. The
net profit margin has mainly declined for Maple Builders Ltd, due to the increment in
administrative cost, which has declined its overall return on assets.
1.2 Depicting most financially stable position of both the companies:
Alpine
Construction
2015
Alpine
Construction
2016
Maple Builders
Ltd 2015
Maple Builders
Ltd 2016
0
0.5
1
1.5
2
2.5
3
Working Capital Management Ratios
1) Current Ratio 2) Quick Ratio
4
The evaluation of the ratio mainly indicates that financial performance of Maple
Builders Ltd is relatively higher than Alpine Construction Ltd, as both gross profit and net
profit margin is relatively high in 2016 of the company. The financial performance of Maple
Builders Ltd has relevantly declined over the period from 67.5% to 64%, which is relevantly
higher than the value of Alpine Construction Ltd 59.7%. The net profit margin is also higher
of Maple Builders Ltd 20.4% in comparison to Alpine Construction Ltd 17.85%. This
relevantly indicates that financial performance of Maple Builders Ltd is relatively higher than
Alpine Construction Ltd. The return on assets of Alpine Construction Ltd is higher than
Maple Builders Ltd, which does not indicate the profitability progress of the company
(Buchman, Harris & Liu, 2016). The gross profit margin of Maple Builders Ltd and Alpine
Construction Ltd relevantly declined, which is due to the high cost of sales incurred by the
company. On the other hand, Alpine Construction Ltd net profit margin inclined, due to the
occurrence of low administrative cost, which increased return on assets of the company. The
net profit margin has mainly declined for Maple Builders Ltd, due to the increment in
administrative cost, which has declined its overall return on assets.
1.2 Depicting most financially stable position of both the companies:
Alpine
Construction
2015
Alpine
Construction
2016
Maple Builders
Ltd 2015
Maple Builders
Ltd 2016
0
0.5
1
1.5
2
2.5
3
Working Capital Management Ratios
1) Current Ratio 2) Quick Ratio
MANAGEMENT ACCOUNTING
5
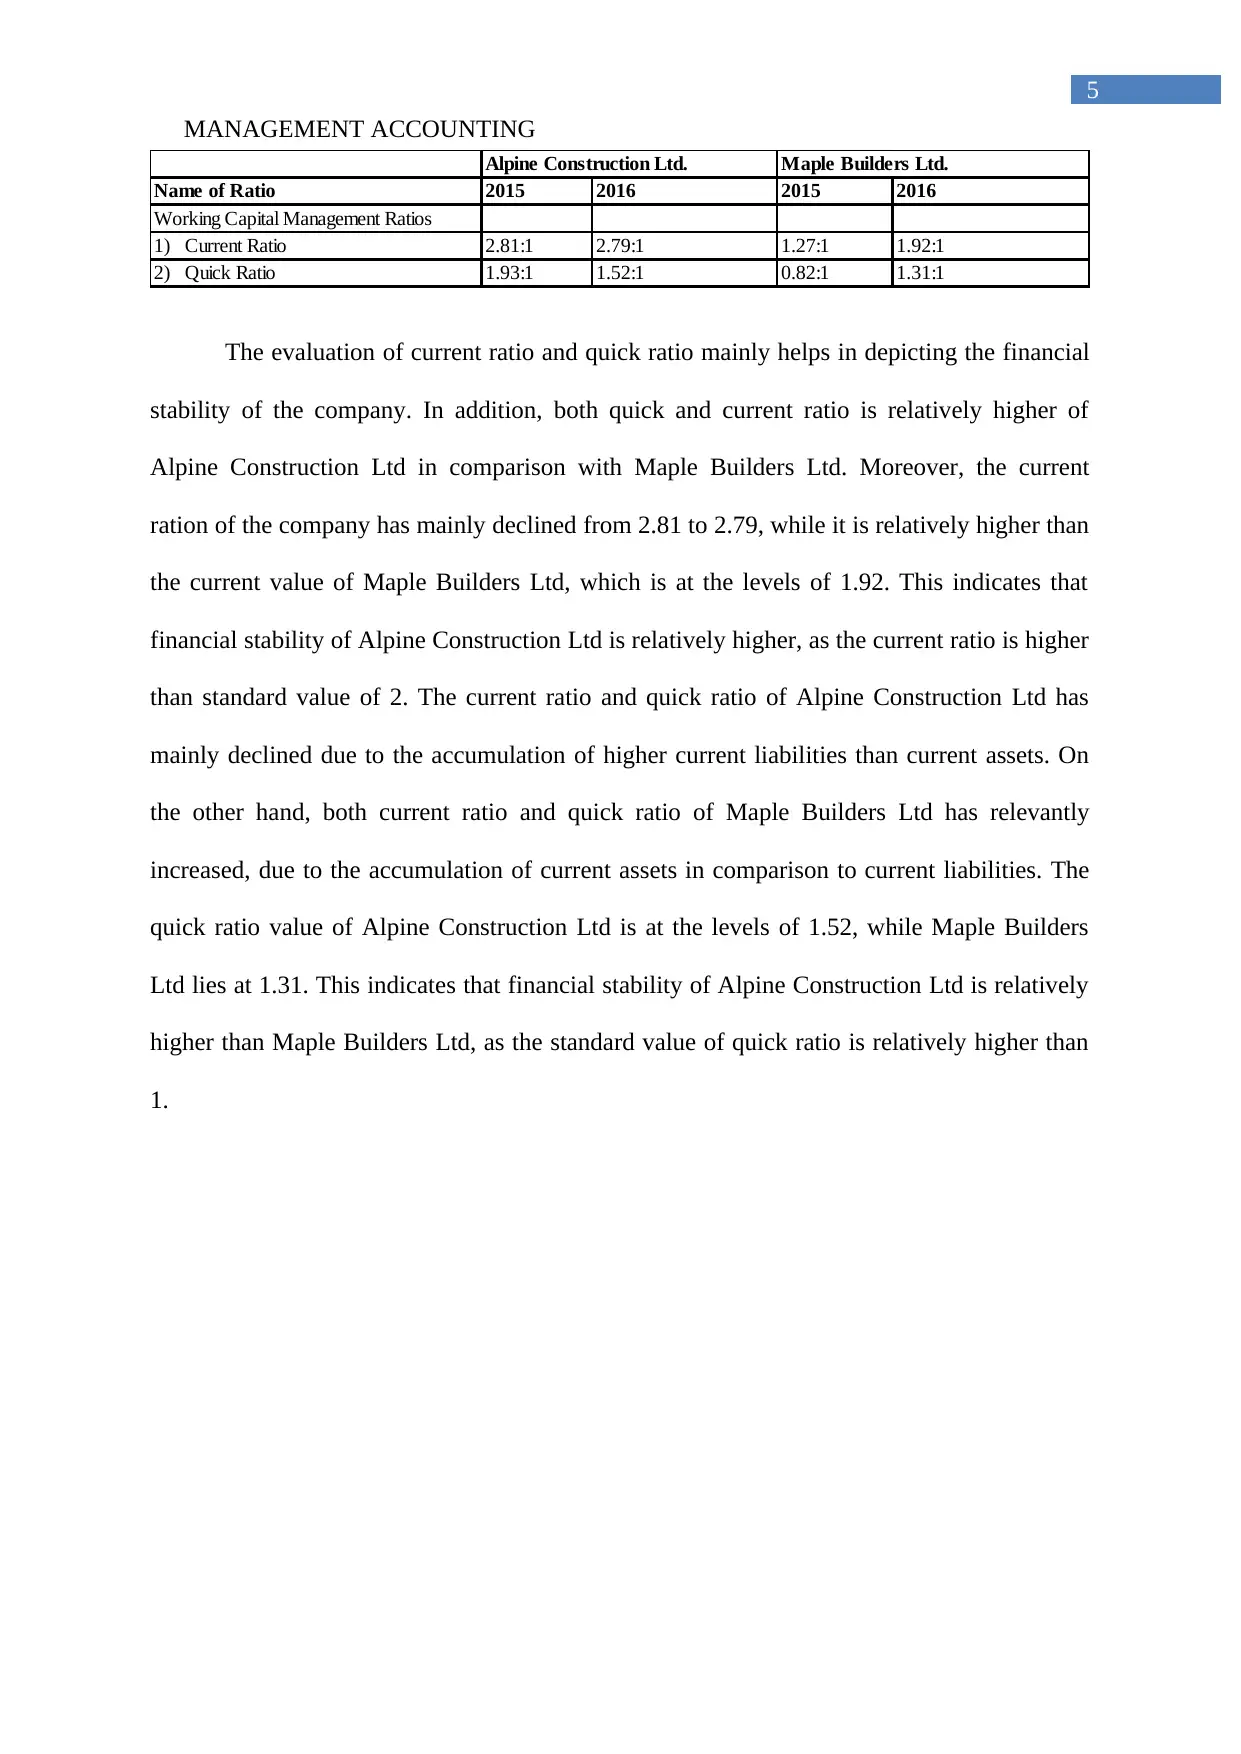
Name of Ratio 2015 2016 2015 2016
Working Capital Management Ratios
1) Current Ratio 2.81:1 2.79:1 1.27:1 1.92:1
2) Quick Ratio 1.93:1 1.52:1 0.82:1 1.31:1
Alpine Construction Ltd. Maple Builders Ltd.
The evaluation of current ratio and quick ratio mainly helps in depicting the financial
stability of the company. In addition, both quick and current ratio is relatively higher of
Alpine Construction Ltd in comparison with Maple Builders Ltd. Moreover, the current
ration of the company has mainly declined from 2.81 to 2.79, while it is relatively higher than
the current value of Maple Builders Ltd, which is at the levels of 1.92. This indicates that
financial stability of Alpine Construction Ltd is relatively higher, as the current ratio is higher
than standard value of 2. The current ratio and quick ratio of Alpine Construction Ltd has
mainly declined due to the accumulation of higher current liabilities than current assets. On
the other hand, both current ratio and quick ratio of Maple Builders Ltd has relevantly
increased, due to the accumulation of current assets in comparison to current liabilities. The
quick ratio value of Alpine Construction Ltd is at the levels of 1.52, while Maple Builders
Ltd lies at 1.31. This indicates that financial stability of Alpine Construction Ltd is relatively
higher than Maple Builders Ltd, as the standard value of quick ratio is relatively higher than
1.
5
Name of Ratio 2015 2016 2015 2016
Working Capital Management Ratios
1) Current Ratio 2.81:1 2.79:1 1.27:1 1.92:1
2) Quick Ratio 1.93:1 1.52:1 0.82:1 1.31:1
Alpine Construction Ltd. Maple Builders Ltd.
The evaluation of current ratio and quick ratio mainly helps in depicting the financial
stability of the company. In addition, both quick and current ratio is relatively higher of
Alpine Construction Ltd in comparison with Maple Builders Ltd. Moreover, the current
ration of the company has mainly declined from 2.81 to 2.79, while it is relatively higher than
the current value of Maple Builders Ltd, which is at the levels of 1.92. This indicates that
financial stability of Alpine Construction Ltd is relatively higher, as the current ratio is higher
than standard value of 2. The current ratio and quick ratio of Alpine Construction Ltd has
mainly declined due to the accumulation of higher current liabilities than current assets. On
the other hand, both current ratio and quick ratio of Maple Builders Ltd has relevantly
increased, due to the accumulation of current assets in comparison to current liabilities. The
quick ratio value of Alpine Construction Ltd is at the levels of 1.52, while Maple Builders
Ltd lies at 1.31. This indicates that financial stability of Alpine Construction Ltd is relatively
higher than Maple Builders Ltd, as the standard value of quick ratio is relatively higher than
1.
⊘ This is a preview!⊘
Do you want full access?
Subscribe today to unlock all pages.
Trusted by 1+ million students worldwide
MANAGEMENT ACCOUNTING
6
1.3 Depicting company who runs most efficiently:
Alpine
Construction
2015
Alpine
Construction
2016
Maple Builders
Ltd 2015
Maple Builders
Ltd 2016
0
10
20
30
40
50
60
70
80
Asset Utilization Ratios
1) Inventory days 2) A/C Receivable days
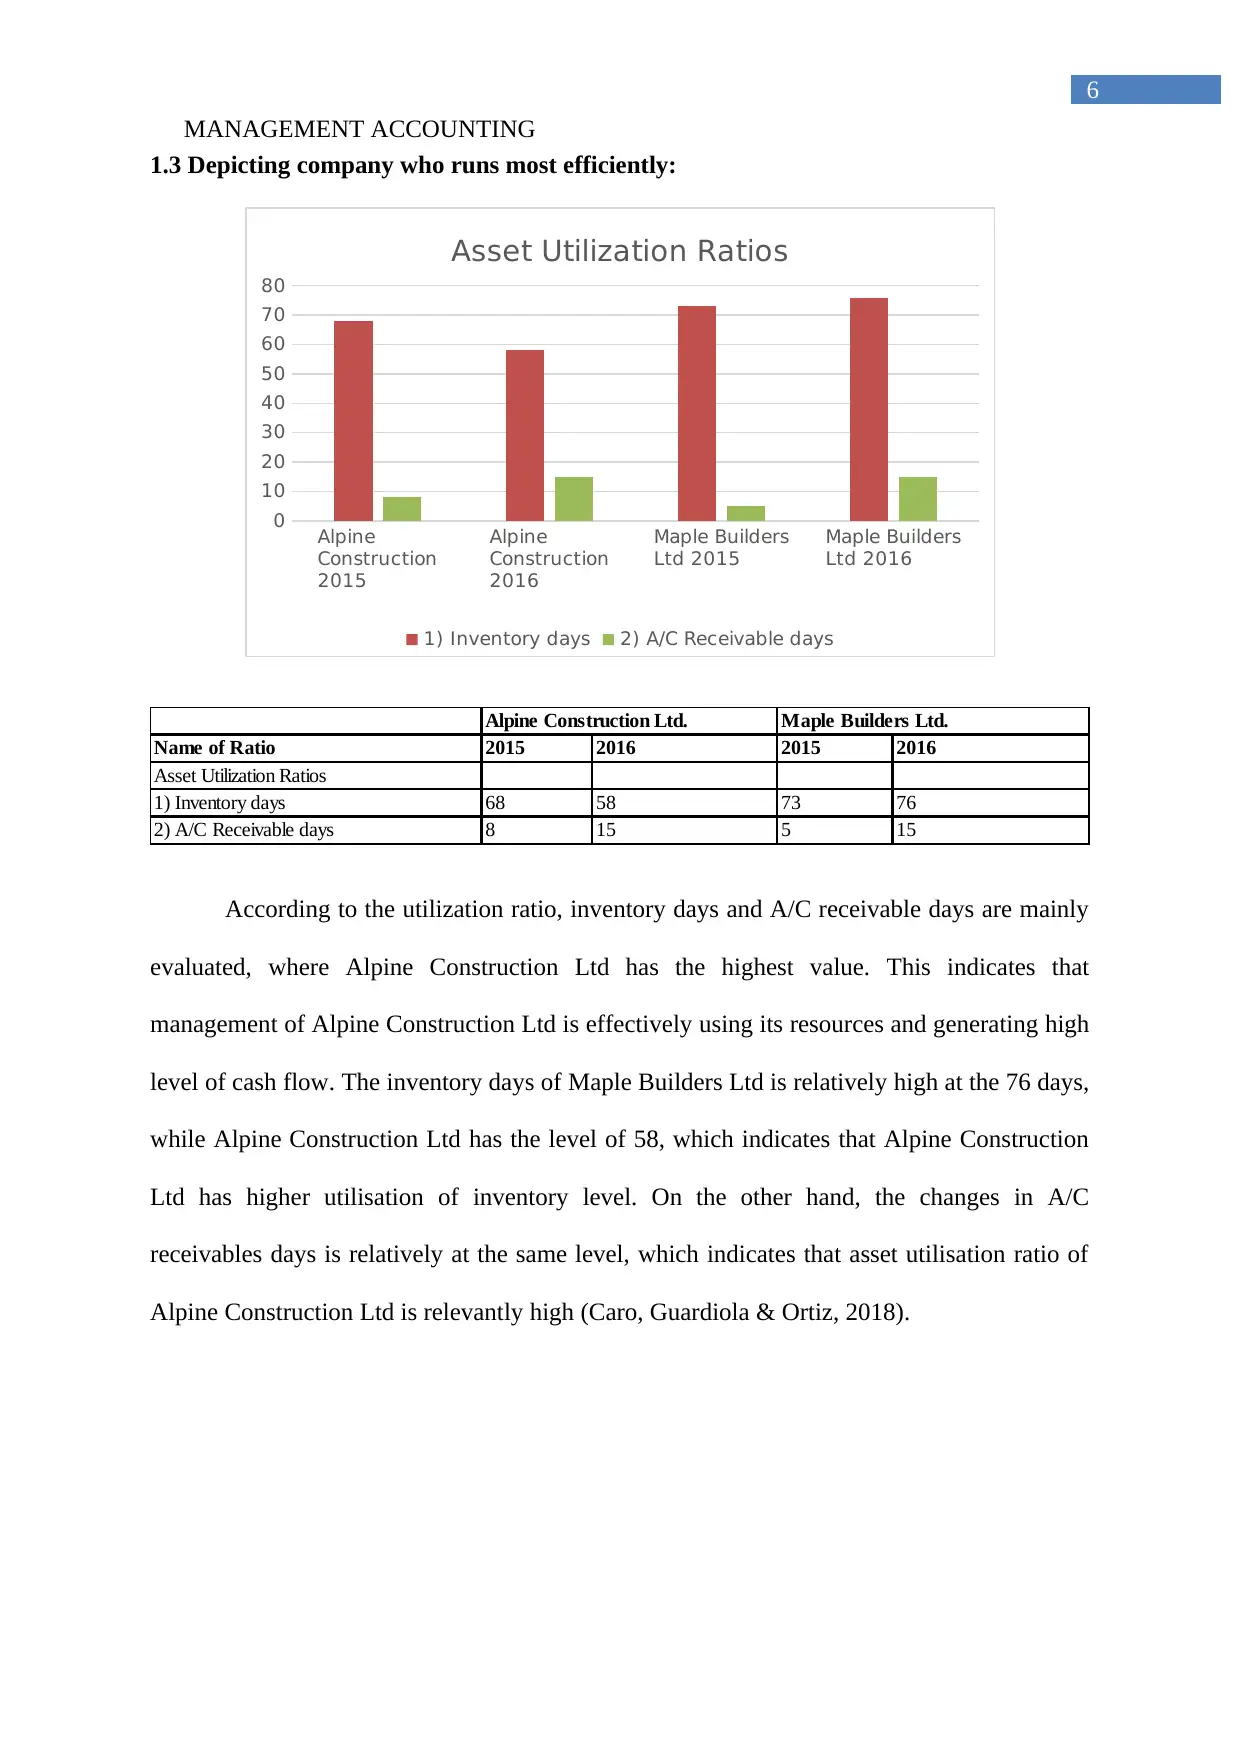
Name of Ratio 2015 2016 2015 2016
Asset Utilization Ratios
1) Inventory days 68 58 73 76
2) A/C Receivable days 8 15 5 15
Alpine Construction Ltd. Maple Builders Ltd.
According to the utilization ratio, inventory days and A/C receivable days are mainly
evaluated, where Alpine Construction Ltd has the highest value. This indicates that
management of Alpine Construction Ltd is effectively using its resources and generating high
level of cash flow. The inventory days of Maple Builders Ltd is relatively high at the 76 days,
while Alpine Construction Ltd has the level of 58, which indicates that Alpine Construction
Ltd has higher utilisation of inventory level. On the other hand, the changes in A/C
receivables days is relatively at the same level, which indicates that asset utilisation ratio of
Alpine Construction Ltd is relevantly high (Caro, Guardiola & Ortiz, 2018).
6
1.3 Depicting company who runs most efficiently:
Alpine
Construction
2015
Alpine
Construction
2016
Maple Builders
Ltd 2015
Maple Builders
Ltd 2016
0
10
20
30
40
50
60
70
80
Asset Utilization Ratios
1) Inventory days 2) A/C Receivable days
Name of Ratio 2015 2016 2015 2016
Asset Utilization Ratios
1) Inventory days 68 58 73 76
2) A/C Receivable days 8 15 5 15
Alpine Construction Ltd. Maple Builders Ltd.
According to the utilization ratio, inventory days and A/C receivable days are mainly
evaluated, where Alpine Construction Ltd has the highest value. This indicates that
management of Alpine Construction Ltd is effectively using its resources and generating high
level of cash flow. The inventory days of Maple Builders Ltd is relatively high at the 76 days,
while Alpine Construction Ltd has the level of 58, which indicates that Alpine Construction
Ltd has higher utilisation of inventory level. On the other hand, the changes in A/C
receivables days is relatively at the same level, which indicates that asset utilisation ratio of
Alpine Construction Ltd is relevantly high (Caro, Guardiola & Ortiz, 2018).
Paraphrase This Document
Need a fresh take? Get an instant paraphrase of this document with our AI Paraphraser
MANAGEMENT ACCOUNTING
7
1.4 Depicting which subsidiary is in the best market position:
Alpine
Construction
2015
Alpine
Construction
2016
Maple Builders
Ltd 2015
Maple Builders
Ltd 2016
0
0.5
1
1.5
2
2.5
3
3.5
4
Financial Market Ratios
1) EPS 2) DPS
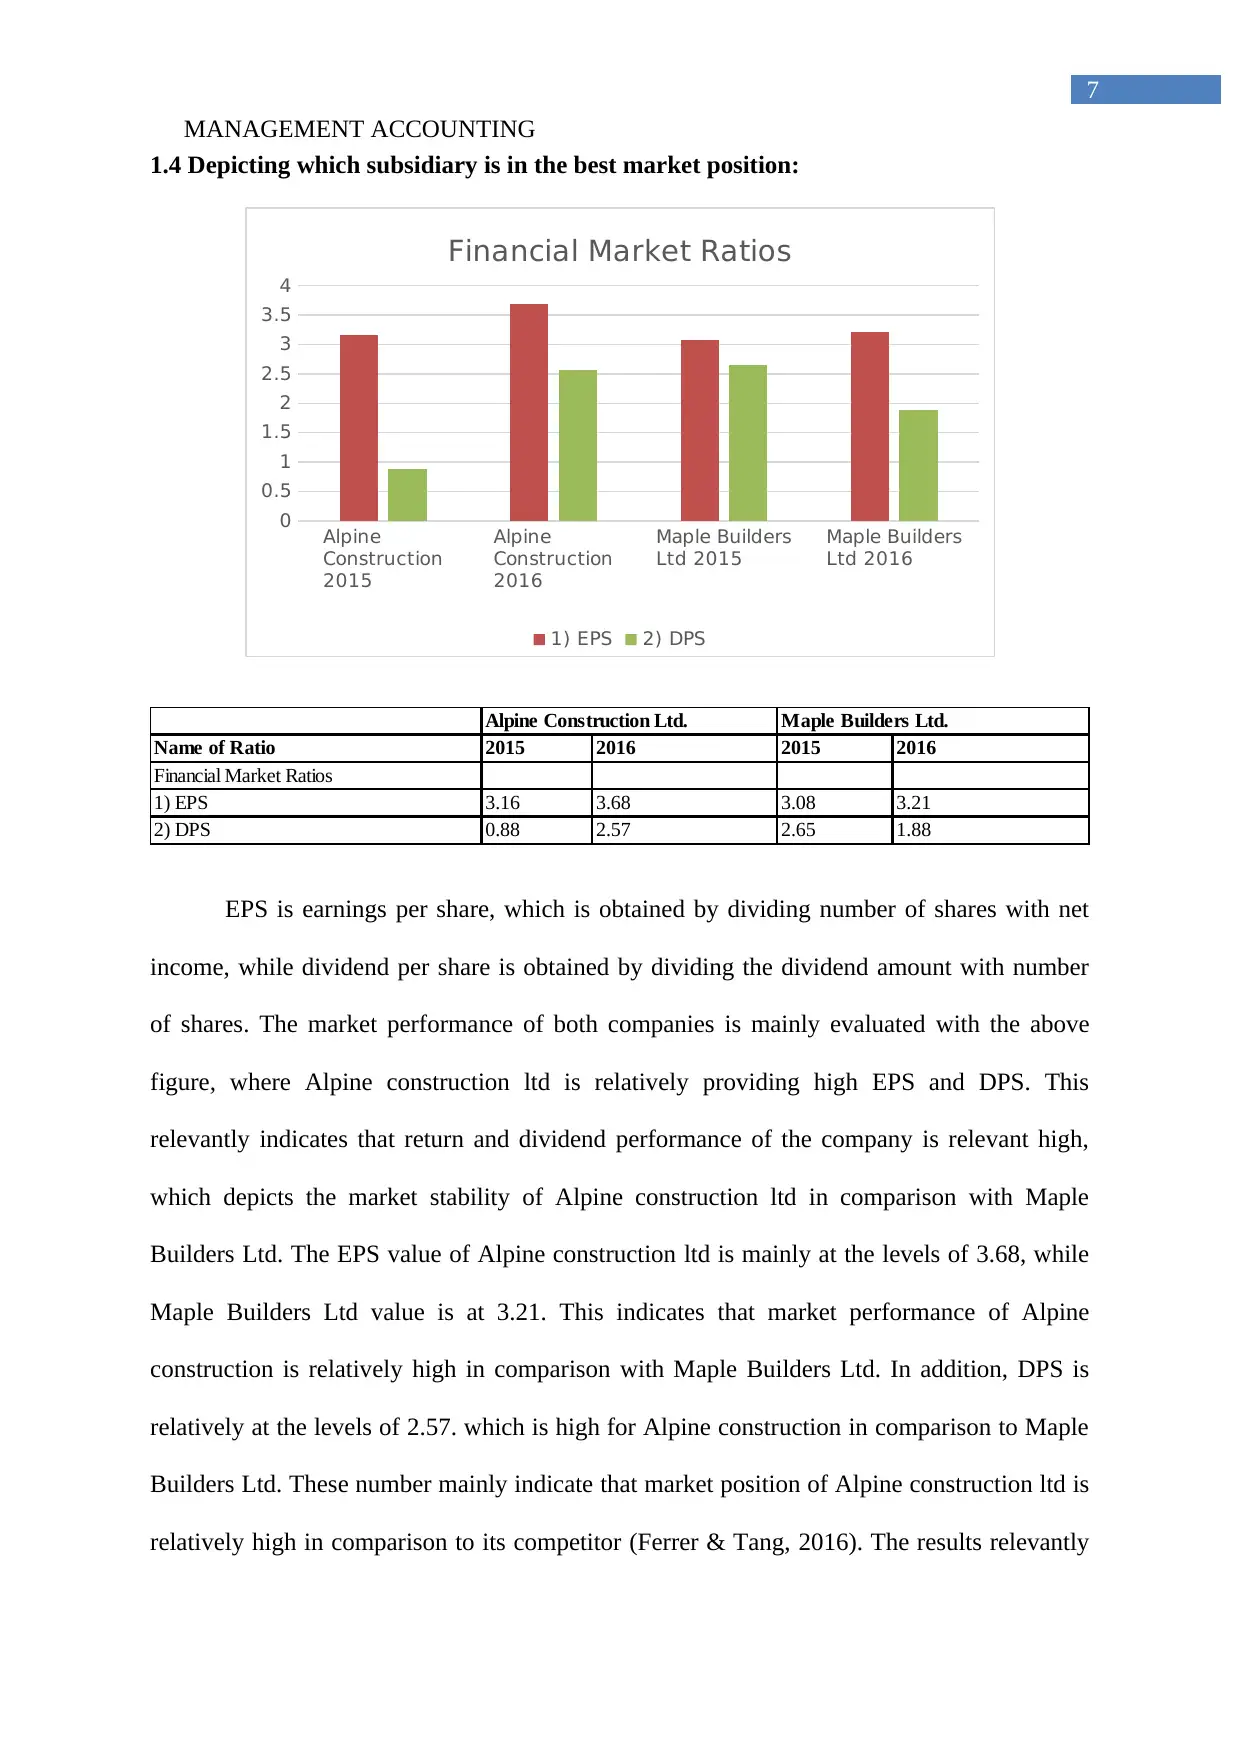
Name of Ratio 2015 2016 2015 2016
Financial Market Ratios
1) EPS 3.16 3.68 3.08 3.21
2) DPS 0.88 2.57 2.65 1.88
Alpine Construction Ltd. Maple Builders Ltd.
EPS is earnings per share, which is obtained by dividing number of shares with net
income, while dividend per share is obtained by dividing the dividend amount with number
of shares. The market performance of both companies is mainly evaluated with the above
figure, where Alpine construction ltd is relatively providing high EPS and DPS. This
relevantly indicates that return and dividend performance of the company is relevant high,
which depicts the market stability of Alpine construction ltd in comparison with Maple
Builders Ltd. The EPS value of Alpine construction ltd is mainly at the levels of 3.68, while
Maple Builders Ltd value is at 3.21. This indicates that market performance of Alpine
construction is relatively high in comparison with Maple Builders Ltd. In addition, DPS is
relatively at the levels of 2.57. which is high for Alpine construction in comparison to Maple
Builders Ltd. These number mainly indicate that market position of Alpine construction ltd is
relatively high in comparison to its competitor (Ferrer & Tang, 2016). The results relevantly
7
1.4 Depicting which subsidiary is in the best market position:
Alpine
Construction
2015
Alpine
Construction
2016
Maple Builders
Ltd 2015
Maple Builders
Ltd 2016
0
0.5
1
1.5
2
2.5
3
3.5
4
Financial Market Ratios
1) EPS 2) DPS
Name of Ratio 2015 2016 2015 2016
Financial Market Ratios
1) EPS 3.16 3.68 3.08 3.21
2) DPS 0.88 2.57 2.65 1.88
Alpine Construction Ltd. Maple Builders Ltd.
EPS is earnings per share, which is obtained by dividing number of shares with net
income, while dividend per share is obtained by dividing the dividend amount with number
of shares. The market performance of both companies is mainly evaluated with the above
figure, where Alpine construction ltd is relatively providing high EPS and DPS. This
relevantly indicates that return and dividend performance of the company is relevant high,
which depicts the market stability of Alpine construction ltd in comparison with Maple
Builders Ltd. The EPS value of Alpine construction ltd is mainly at the levels of 3.68, while
Maple Builders Ltd value is at 3.21. This indicates that market performance of Alpine
construction is relatively high in comparison with Maple Builders Ltd. In addition, DPS is
relatively at the levels of 2.57. which is high for Alpine construction in comparison to Maple
Builders Ltd. These number mainly indicate that market position of Alpine construction ltd is
relatively high in comparison to its competitor (Ferrer & Tang, 2016). The results relevantly
MANAGEMENT ACCOUNTING
8
implies that EPS of Alpine construction ltd and Maple Builders Ltd is relevantly high due to
the net income generate by the company. However, the DPS of Alpine construction ltd has
relevantly improved due to the increment in dividends payment. On the other hand, Maple
Builders Ltd DPS mainly declined due to the low dividends paid by the company.
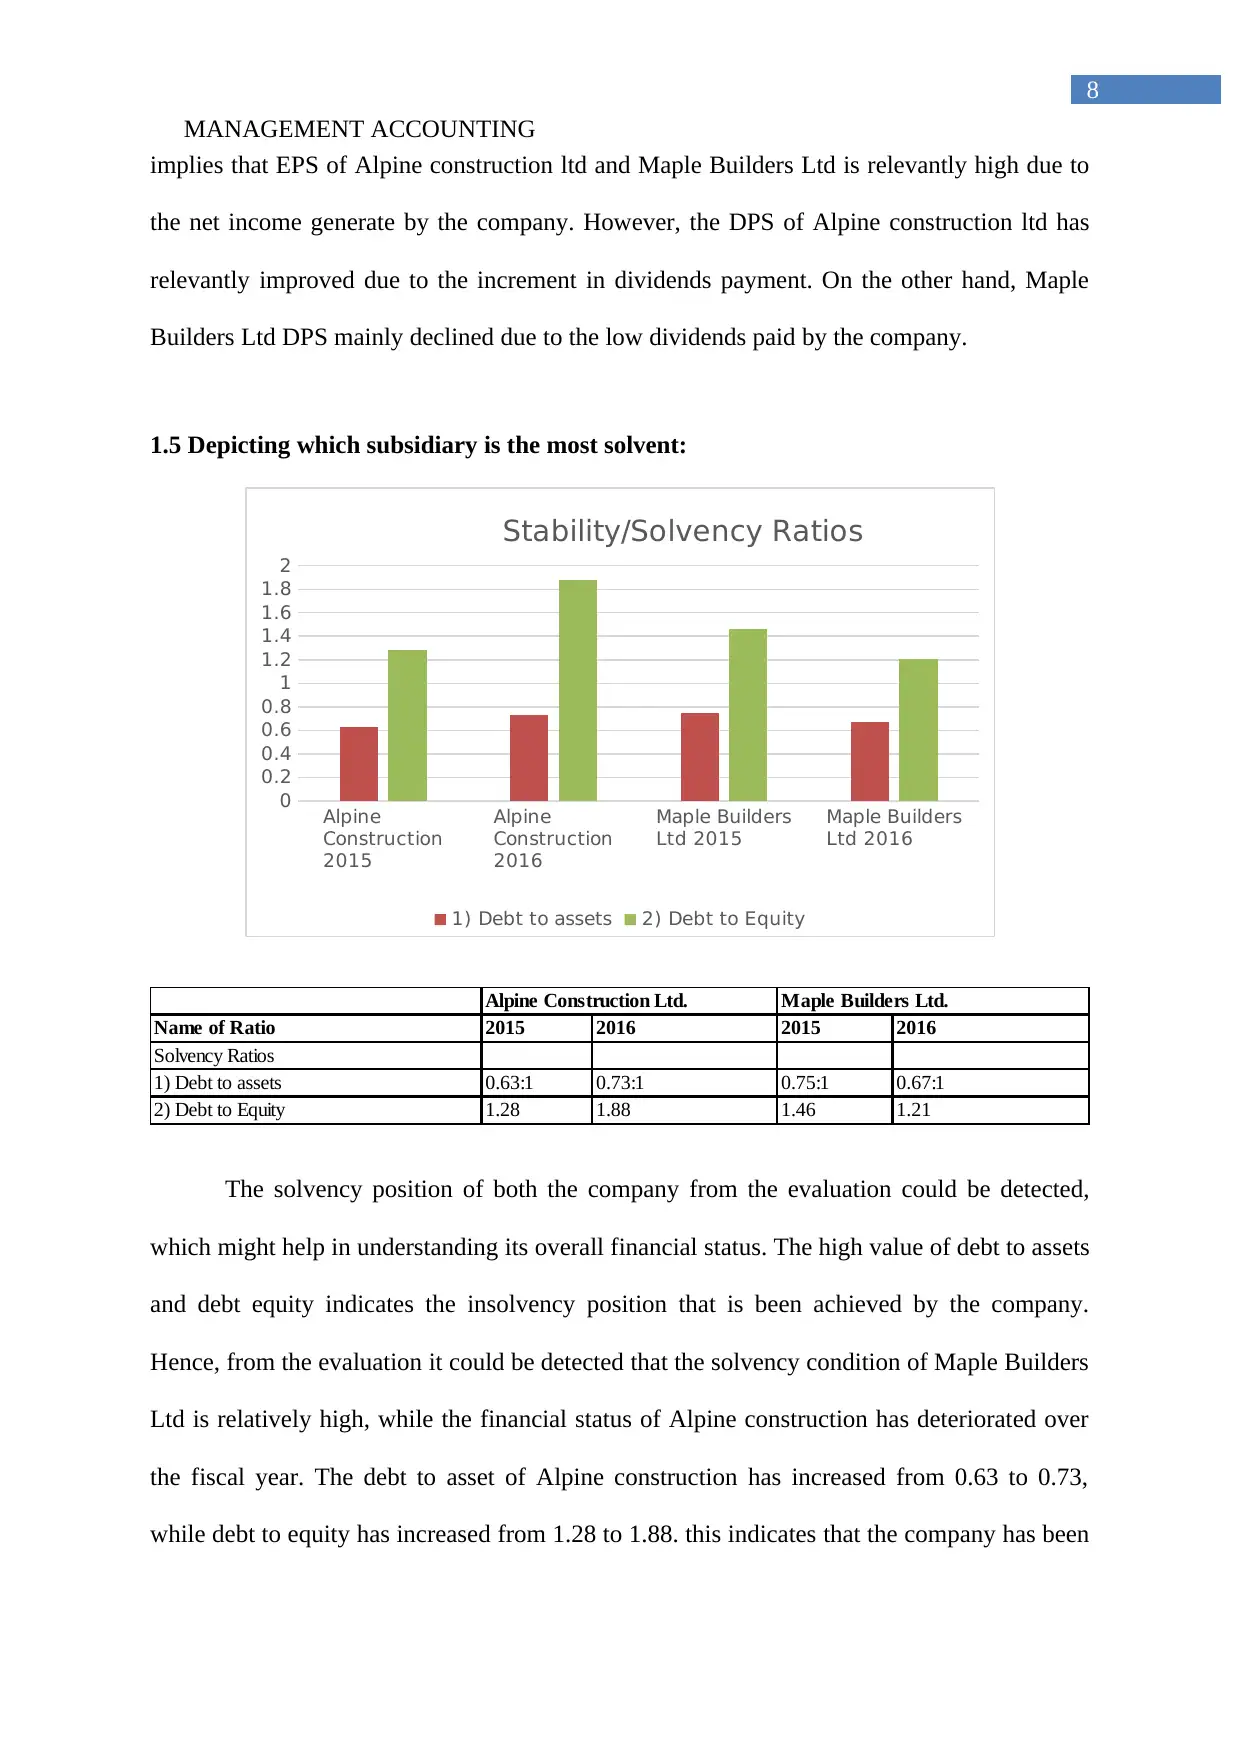
1.5 Depicting which subsidiary is the most solvent:
Alpine
Construction
2015
Alpine
Construction
2016
Maple Builders
Ltd 2015
Maple Builders
Ltd 2016
0
0.2
0.4
0.6
0.8
1
1.2
1.4
1.6
1.8
2
Stability/Solvency Ratios
1) Debt to assets 2) Debt to Equity
Name of Ratio 2015 2016 2015 2016
Solvency Ratios
1) Debt to assets 0.63:1 0.73:1 0.75:1 0.67:1
2) Debt to Equity 1.28 1.88 1.46 1.21
Alpine Construction Ltd. Maple Builders Ltd.
The solvency position of both the company from the evaluation could be detected,
which might help in understanding its overall financial status. The high value of debt to assets
and debt equity indicates the insolvency position that is been achieved by the company.
Hence, from the evaluation it could be detected that the solvency condition of Maple Builders
Ltd is relatively high, while the financial status of Alpine construction has deteriorated over
the fiscal year. The debt to asset of Alpine construction has increased from 0.63 to 0.73,
while debt to equity has increased from 1.28 to 1.88. this indicates that the company has been
8
implies that EPS of Alpine construction ltd and Maple Builders Ltd is relevantly high due to
the net income generate by the company. However, the DPS of Alpine construction ltd has
relevantly improved due to the increment in dividends payment. On the other hand, Maple
Builders Ltd DPS mainly declined due to the low dividends paid by the company.
1.5 Depicting which subsidiary is the most solvent:
Alpine
Construction
2015
Alpine
Construction
2016
Maple Builders
Ltd 2015
Maple Builders
Ltd 2016
0
0.2
0.4
0.6
0.8
1
1.2
1.4
1.6
1.8
2
Stability/Solvency Ratios
1) Debt to assets 2) Debt to Equity
Name of Ratio 2015 2016 2015 2016
Solvency Ratios
1) Debt to assets 0.63:1 0.73:1 0.75:1 0.67:1
2) Debt to Equity 1.28 1.88 1.46 1.21
Alpine Construction Ltd. Maple Builders Ltd.
The solvency position of both the company from the evaluation could be detected,
which might help in understanding its overall financial status. The high value of debt to assets
and debt equity indicates the insolvency position that is been achieved by the company.
Hence, from the evaluation it could be detected that the solvency condition of Maple Builders
Ltd is relatively high, while the financial status of Alpine construction has deteriorated over
the fiscal year. The debt to asset of Alpine construction has increased from 0.63 to 0.73,
while debt to equity has increased from 1.28 to 1.88. this indicates that the company has been
⊘ This is a preview!⊘
Do you want full access?
Subscribe today to unlock all pages.
Trusted by 1+ million students worldwide
MANAGEMENT ACCOUNTING
9
accumulating high debt for conducting its operations. However, Maple Builders Ltd has
relatively declined its overall debt accumulation, which indicate its financial strength and
positive solvency position.
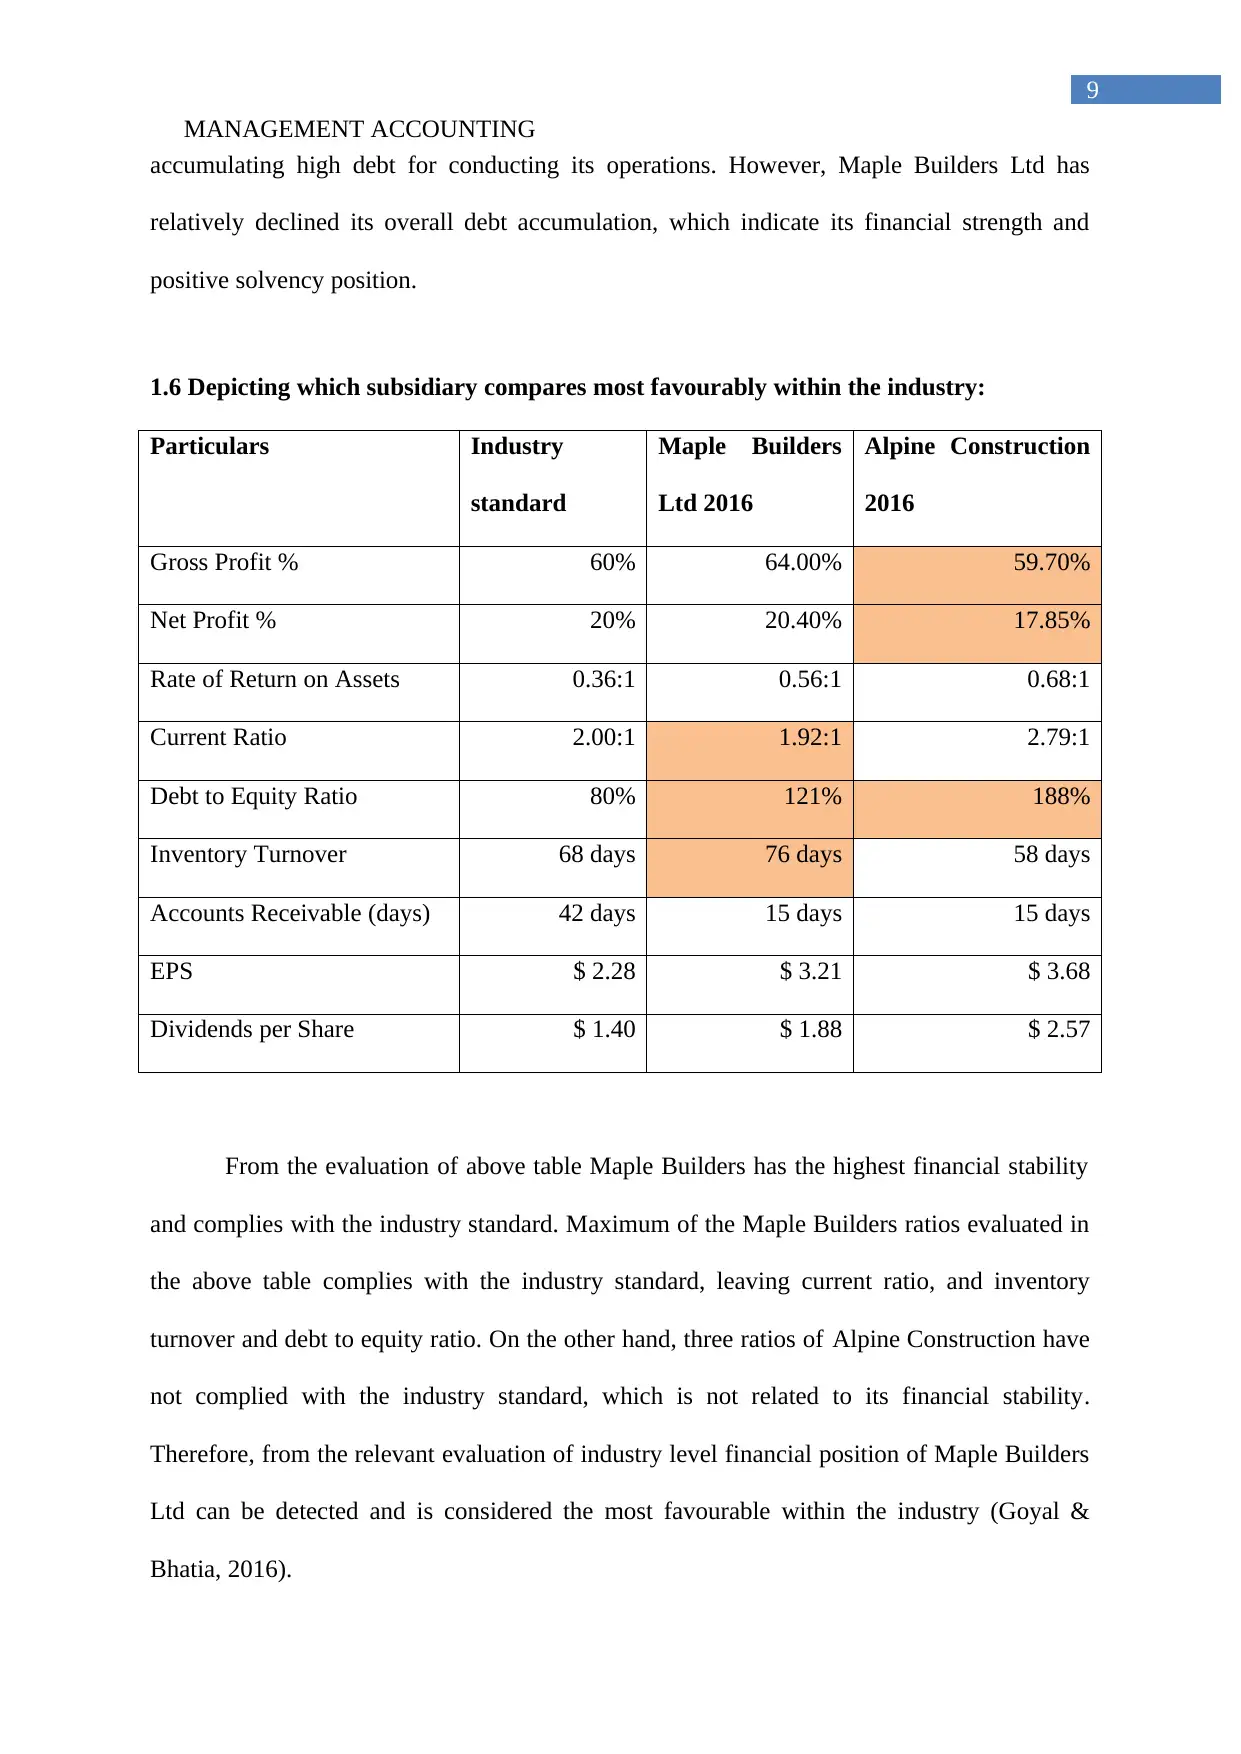
1.6 Depicting which subsidiary compares most favourably within the industry:
Particulars Industry
standard
Maple Builders
Ltd 2016
Alpine Construction
2016
Gross Profit % 60% 64.00% 59.70%
Net Profit % 20% 20.40% 17.85%
Rate of Return on Assets 0.36:1 0.56:1 0.68:1
Current Ratio 2.00:1 1.92:1 2.79:1
Debt to Equity Ratio 80% 121% 188%
Inventory Turnover 68 days 76 days 58 days
Accounts Receivable (days) 42 days 15 days 15 days
EPS $ 2.28 $ 3.21 $ 3.68
Dividends per Share $ 1.40 $ 1.88 $ 2.57
From the evaluation of above table Maple Builders has the highest financial stability
and complies with the industry standard. Maximum of the Maple Builders ratios evaluated in
the above table complies with the industry standard, leaving current ratio, and inventory
turnover and debt to equity ratio. On the other hand, three ratios of Alpine Construction have
not complied with the industry standard, which is not related to its financial stability.
Therefore, from the relevant evaluation of industry level financial position of Maple Builders
Ltd can be detected and is considered the most favourable within the industry (Goyal &
Bhatia, 2016).
9
accumulating high debt for conducting its operations. However, Maple Builders Ltd has
relatively declined its overall debt accumulation, which indicate its financial strength and
positive solvency position.
1.6 Depicting which subsidiary compares most favourably within the industry:
Particulars Industry
standard
Maple Builders
Ltd 2016
Alpine Construction
2016
Gross Profit % 60% 64.00% 59.70%
Net Profit % 20% 20.40% 17.85%
Rate of Return on Assets 0.36:1 0.56:1 0.68:1
Current Ratio 2.00:1 1.92:1 2.79:1
Debt to Equity Ratio 80% 121% 188%
Inventory Turnover 68 days 76 days 58 days
Accounts Receivable (days) 42 days 15 days 15 days
EPS $ 2.28 $ 3.21 $ 3.68
Dividends per Share $ 1.40 $ 1.88 $ 2.57
From the evaluation of above table Maple Builders has the highest financial stability
and complies with the industry standard. Maximum of the Maple Builders ratios evaluated in
the above table complies with the industry standard, leaving current ratio, and inventory
turnover and debt to equity ratio. On the other hand, three ratios of Alpine Construction have
not complied with the industry standard, which is not related to its financial stability.
Therefore, from the relevant evaluation of industry level financial position of Maple Builders
Ltd can be detected and is considered the most favourable within the industry (Goyal &
Bhatia, 2016).
Paraphrase This Document
Need a fresh take? Get an instant paraphrase of this document with our AI Paraphraser
MANAGEMENT ACCOUNTING
10
2. Depicting the conclusion drawn from financial analysis, while depicting the company
with better financial health/position and why:
The evaluation of financial ratios mainly allows investors in detect financial health
and position of both the companies. In addition, the evaluation of financial position mainly
helps in detecting the relevant conditions, while making investment decisions. The financial
position of Maple Builders Ltd is relatively high in comparison with Alpine construction, as
the company is providing high end profits. Maple Builders Ltd has relatively increased the
number of profits, which could be generated from operations, which is detected from relevant
ratios. From the evaluation of ratios and comparisons from industry averages both the
companies have been providing adequate return (Johri & Maheshwari, 2015). However, the
evaluation of solvency position mainly helps in depicting the overall financial position of
Maple Builders Ltd over Alpine construction. This relevant high-end profit generated by
Maple Builders Ltd and its improving solvency position relevantly states the financial health
and position of the company in comparison with Alpine construction.
3. Recommendations for BC Ltd:
3.1 Recommendation for BC Ltd on which of the two companies it should divest from:
The evaluation of both the companies mainly helps in understanding their financial
position, which could help in detecting its ability to divest. The financial position of Maple
Builders Ltd is detected to have the most viable financial position in comparison with Alpine
construction. The financial ratios such as profitability, solvency and financial market ratios
mainly indicate the performance of Maple Builders Ltd, which might help in generating high
level of income from investment. Therefore, from the evaluation BC Ltd should divest from
with Alpine construction, as the financial position of the company is not increasing over the
period of two fiscal years.
MANAGEMENT ACCOUNTING
11
3.2 Suggesting three ways in which improvements in business can be conducted in the
company that is not recommended for divesting:
There are three ways in which relevant improvements of Maple Builders Ltd needs to
be steered, which might decline the deficiencies in its ratios.
The asset utilisation of relevant operations of the company needs to improve by
reducing the lag in inventory sales, which is derived from inventory ratios. The supply
of inventory needs to be improved by the organisation.
The increment in current ratio and quick ratio also needs to be conducted by the
company by reducing the current liability or increasing current assets.
Lastly, the increment in return on assets needs to increase, which is only possible by
effectively raising the level of revenue and net income of the organisation, which is
conducted by reducing the cost of sales and administrative expenses.
4. Dividend payments:
4.1 Explaining the Solvency Tests in accordance with the Companies Act 1993:
The relevant solvency test mainly allows directors of the company to evaluate the
financial position of the company. In addition, the Companies Act 1993 mainly focuses in
evaluating solvency test, which needs to be portrayed to its shareholder before making any
decisions. The solvency test mainly needs balance sheet limb, cash flow test to determine the
solvency position of the company. Moreover, the solvency test mainly requires section 4 of
the companies Act 1993, where both solvency limb and balance sheet limb need to be
evaluated. The liquidity limb and balance sheet limb mainly evaluate debt position of the
company, which might help in understanding its financial position. The value of company’s
⊘ This is a preview!⊘
Do you want full access?
Subscribe today to unlock all pages.
Trusted by 1+ million students worldwide
1 out of 18
Related Documents


Your All-in-One AI-Powered Toolkit for Academic Success.
+13062052269
info@desklib.com
Available 24*7 on WhatsApp / Email
![[object Object]](/_next/static/media/star-bottom.7253800d.svg)
Unlock your academic potential
Copyright © 2020–2026 A2Z Services. All Rights Reserved. Developed and managed by ZUCOL.