Analysis of Australian and US Economies (1985-2016)

Verified

Added on  2020/02/24

|18
|3823
|46
Report
AI Summary
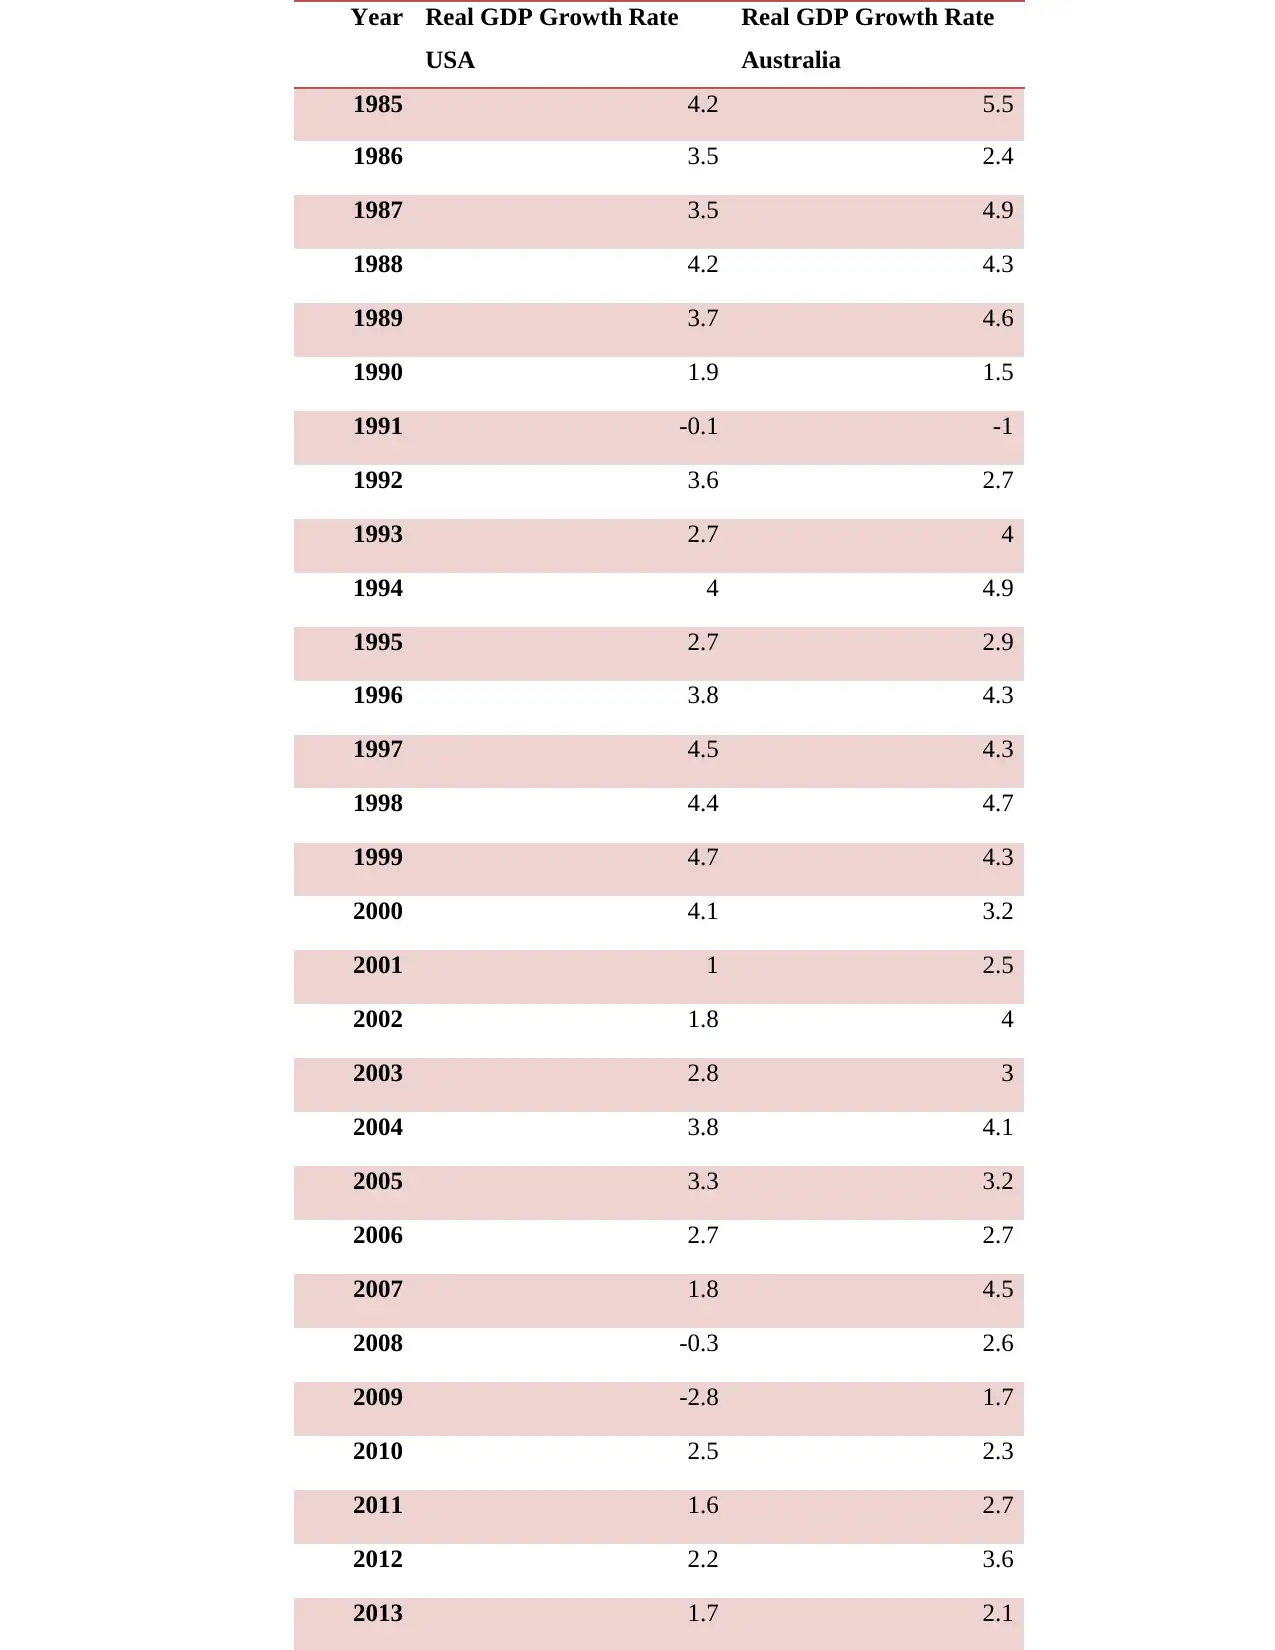
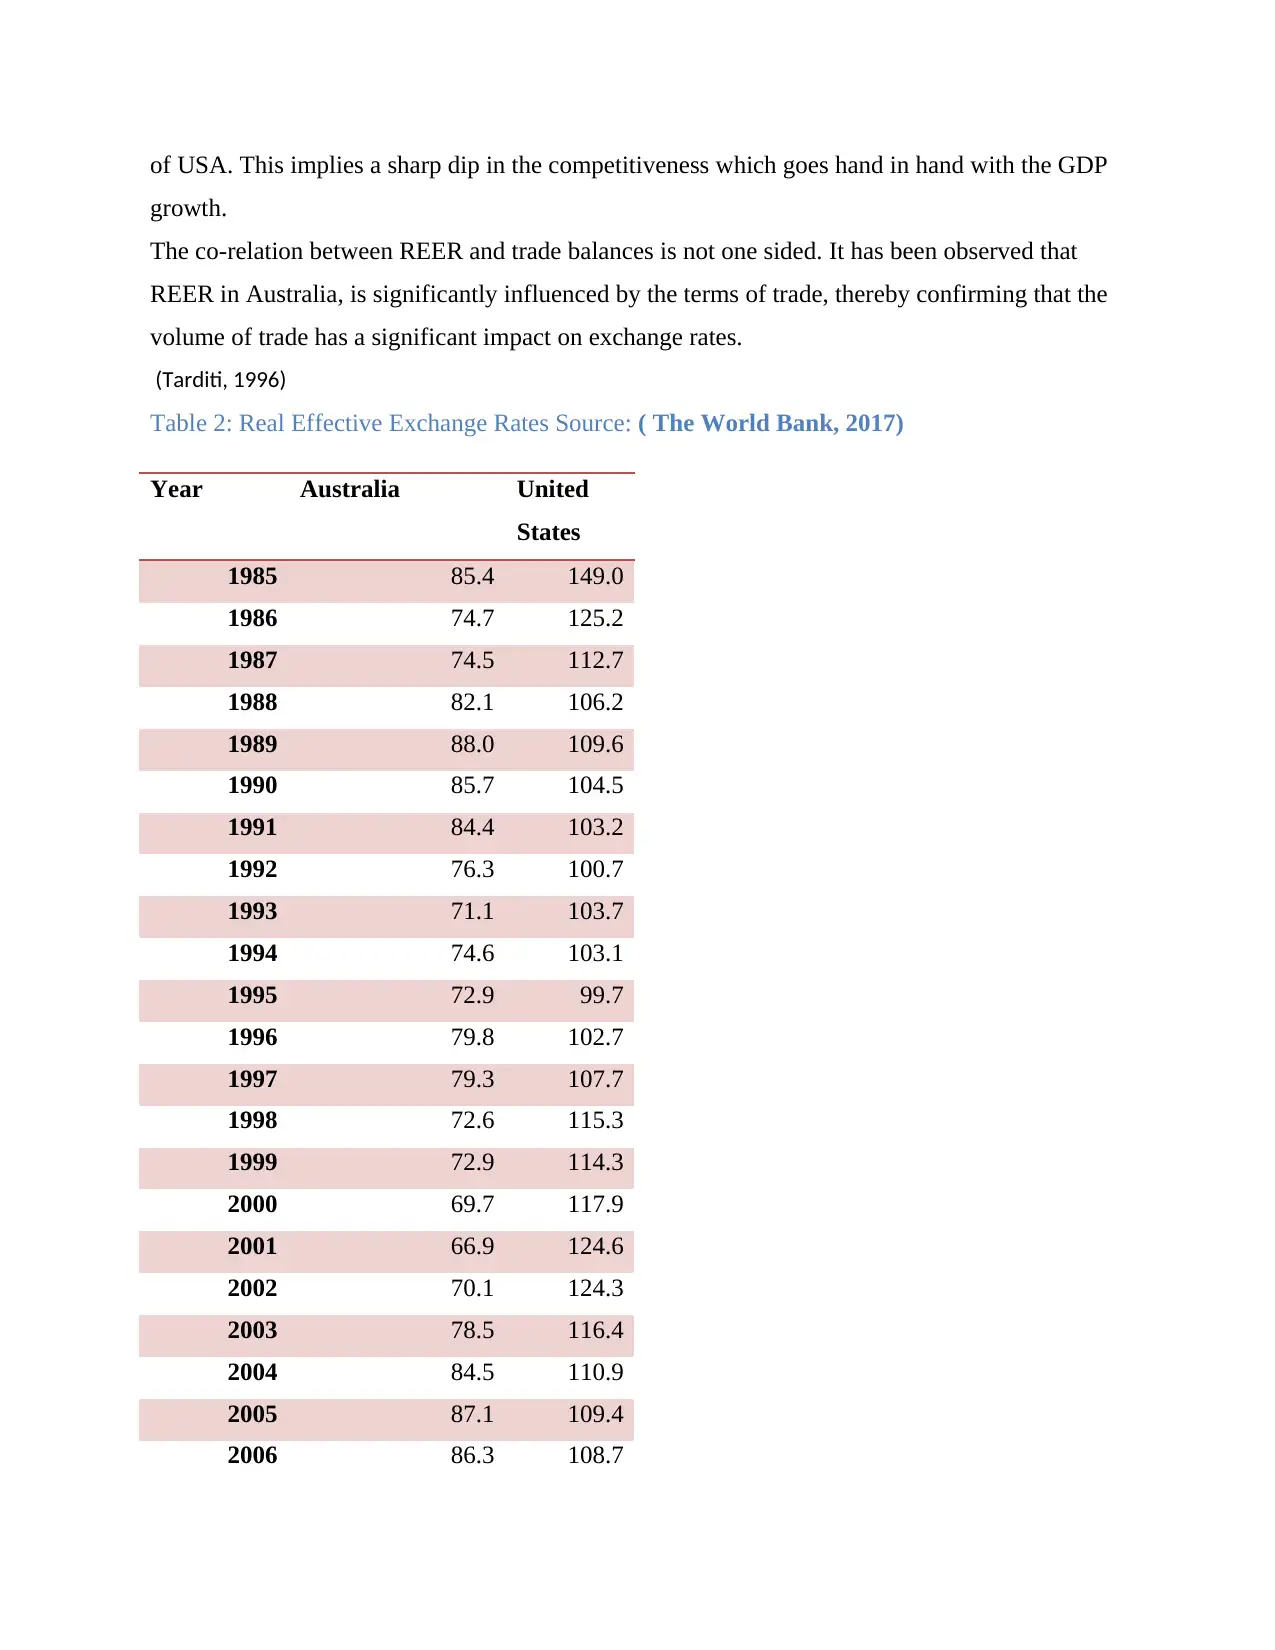
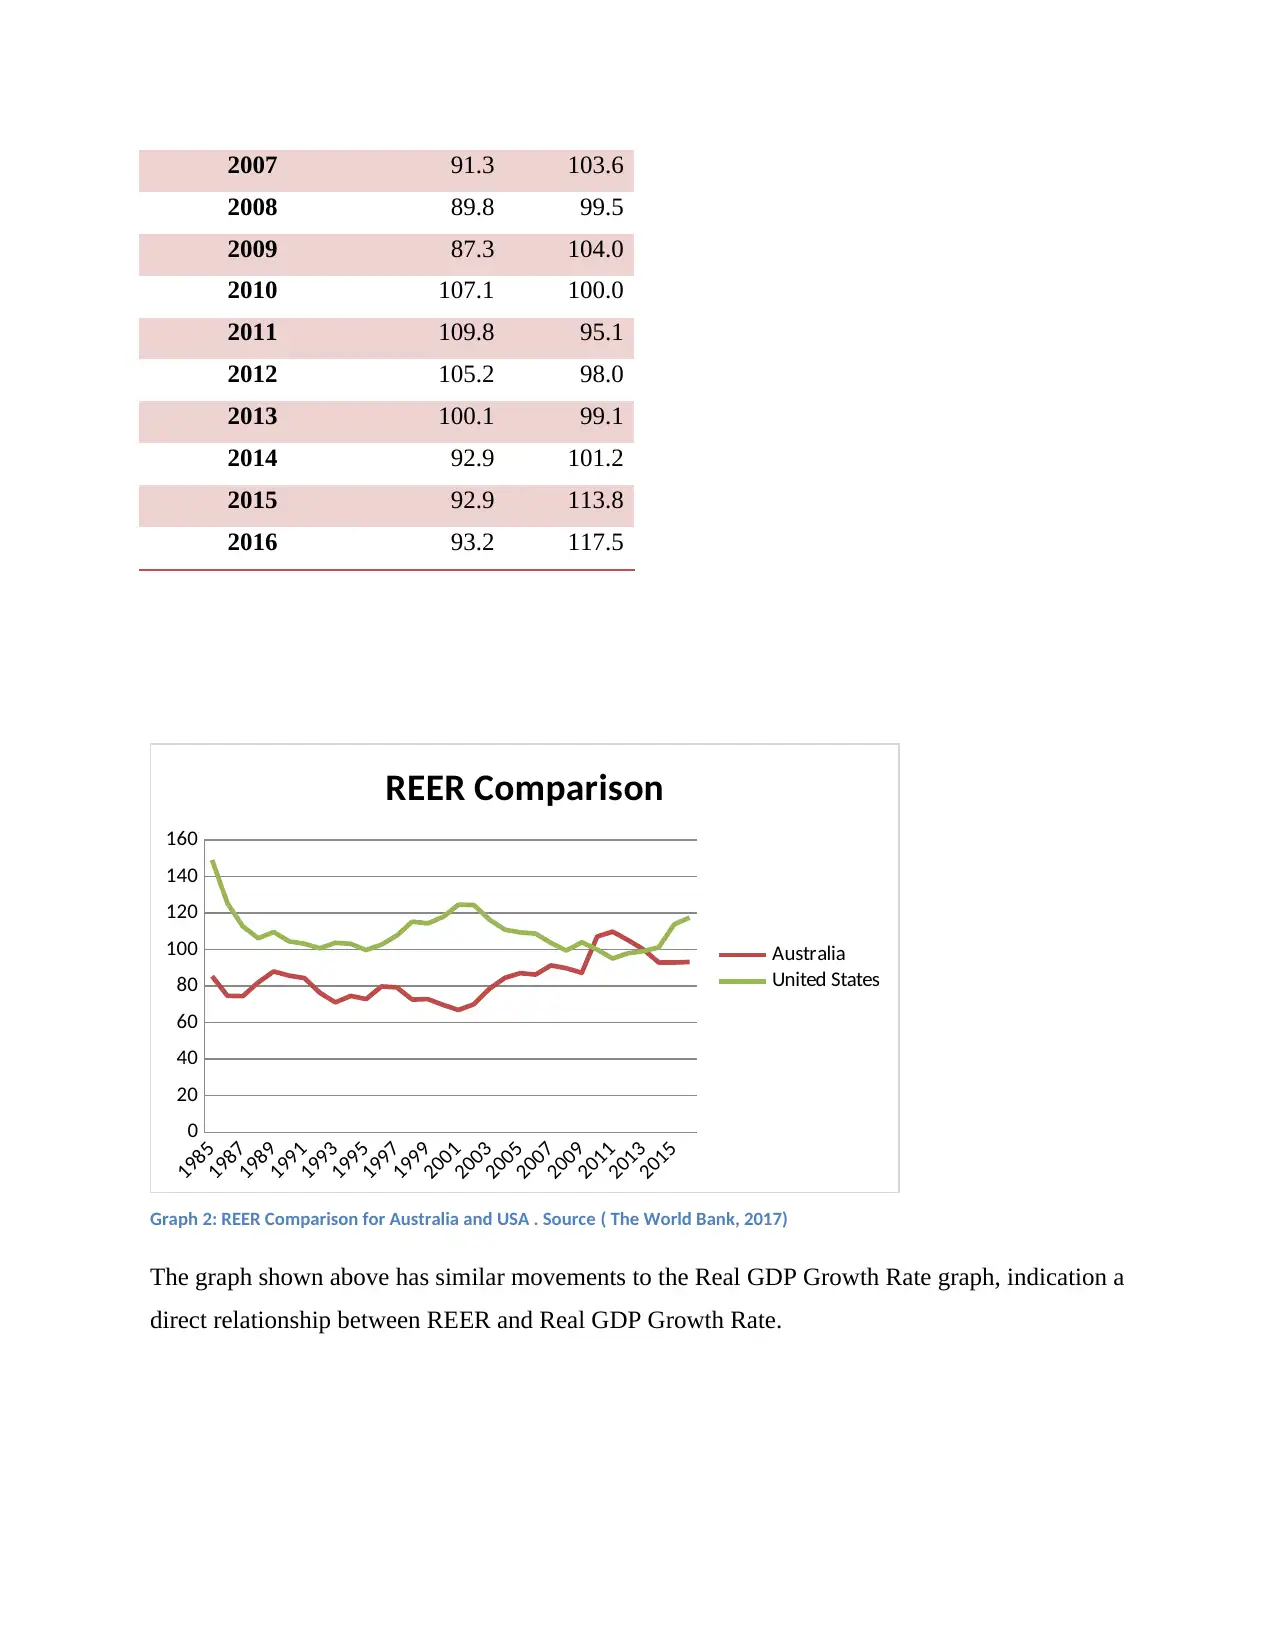
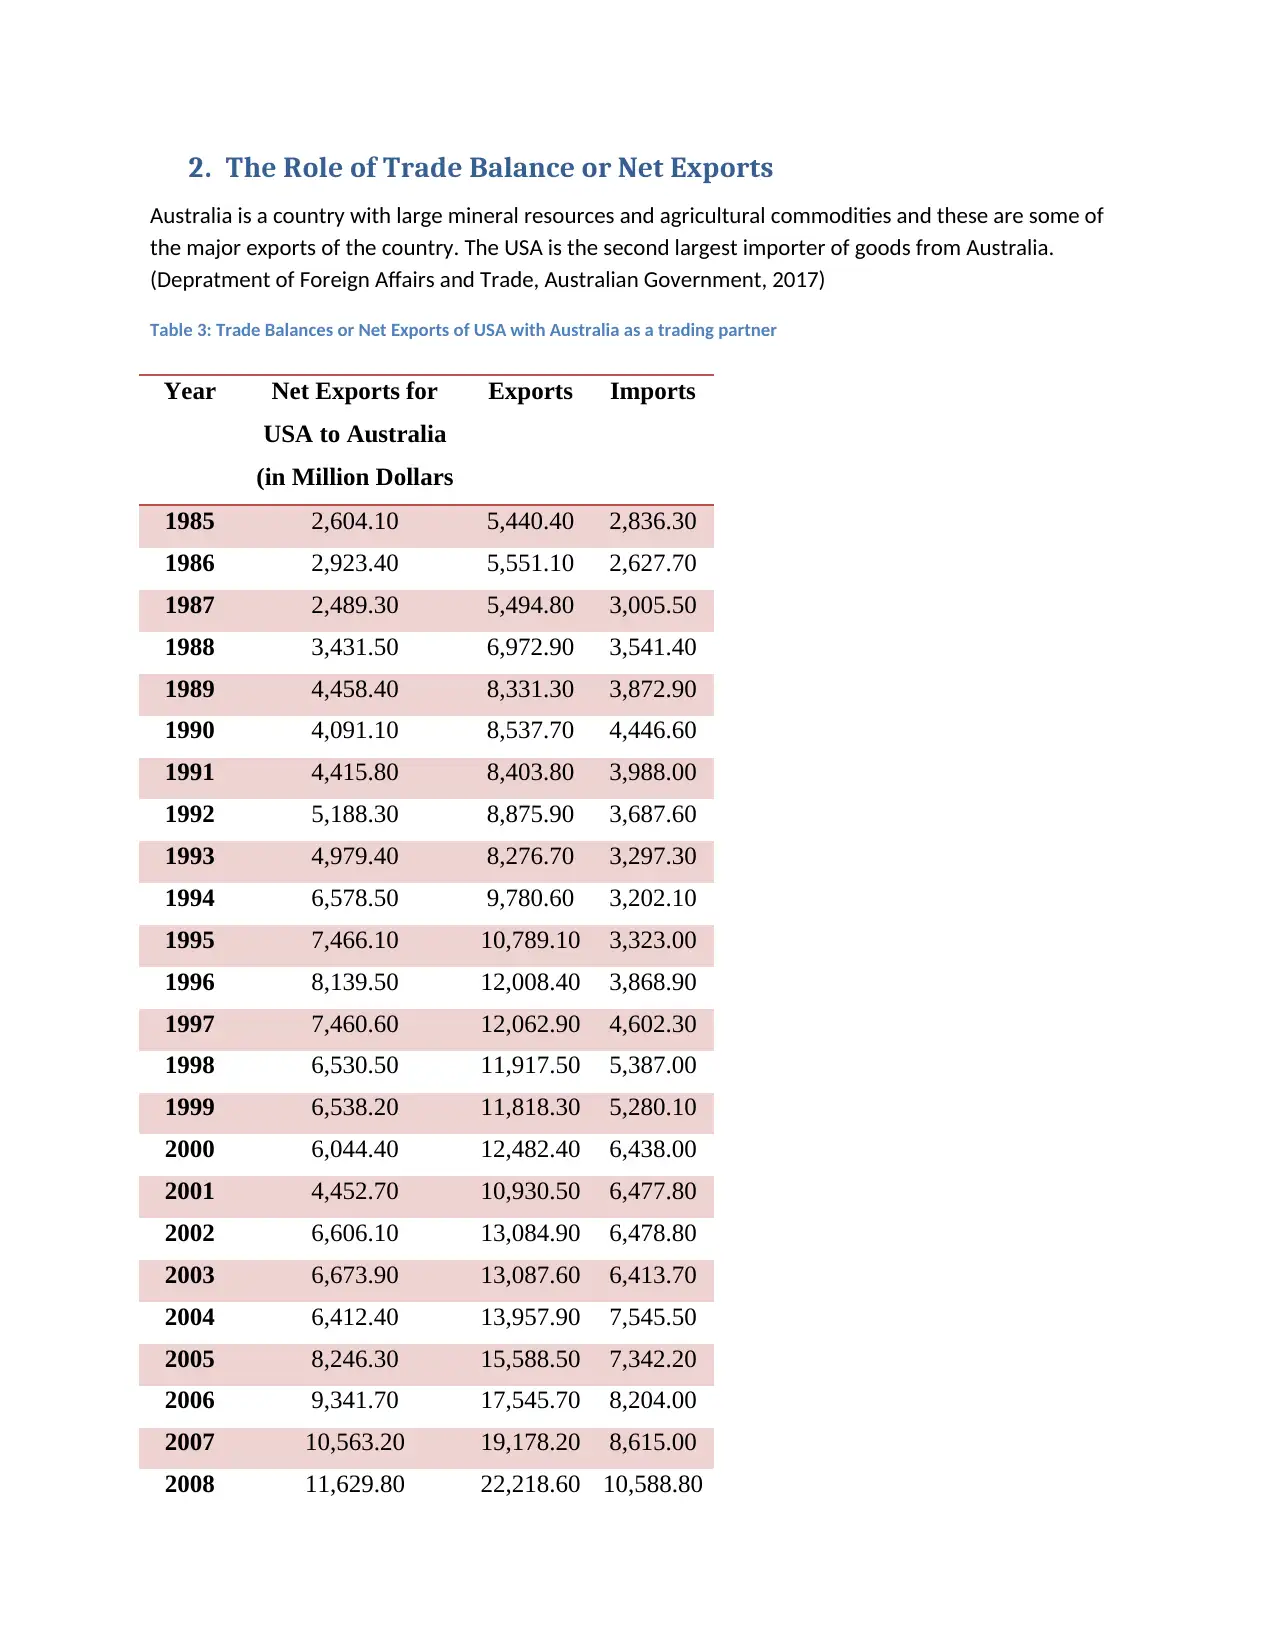
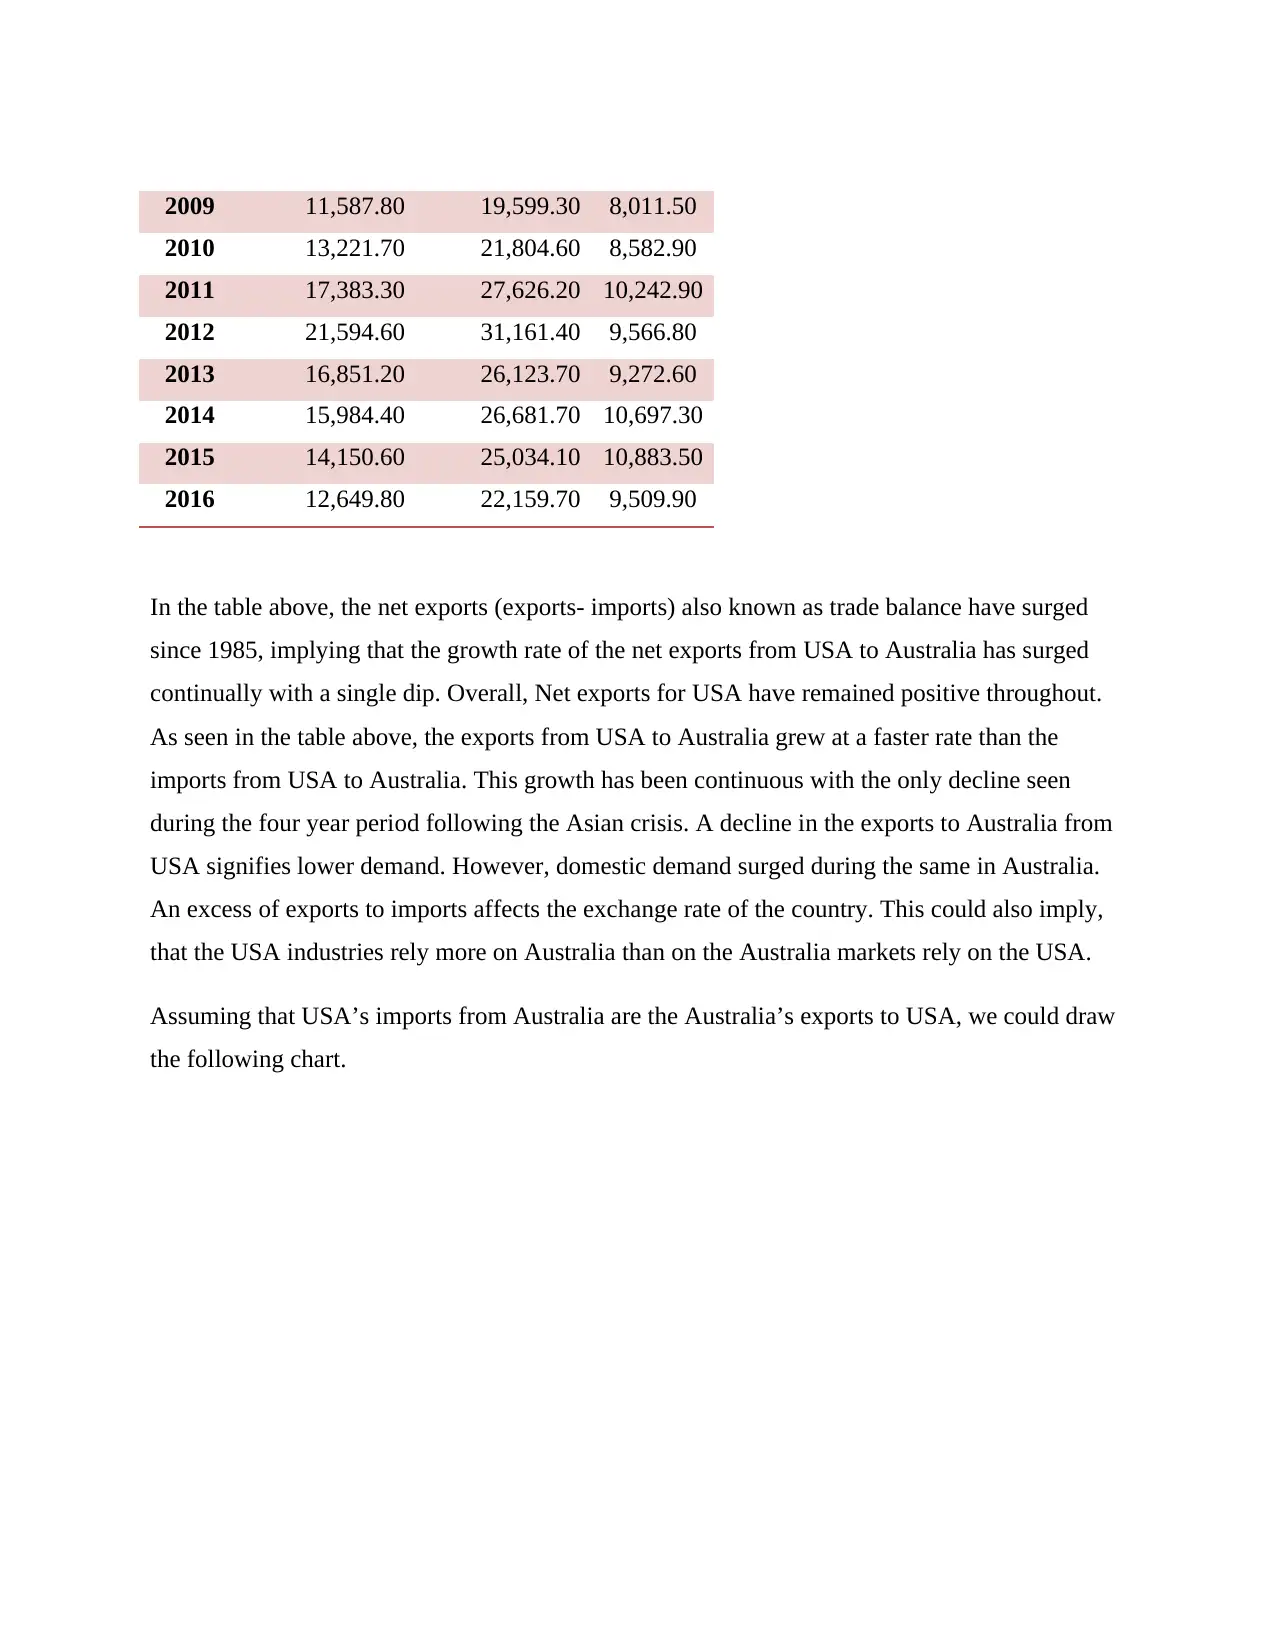
This report presents a comparative analysis of the Australian and United States economies from 1985 to 2016. The analysis explores various macroeconomic parameters, including Real GDP Growth Rates, Real Effective Exchange Rates, Interest Rates, and Net Exports. The report examines the co-relation between the trajectories of the growth rates and the impact of the 1997 Asian Crisis and the 2008 financial crisis on both economies. The report analyzes the role of exchange rates, trade balances, and interest rates in shaping the economic performance of both countries, highlighting periods of growth, such as the Australian economic miracle of the 1990s, and periods of economic downturn. The study uses data from sources like the International Monetary Fund and The World Bank to compare the trajectories of the two economies, highlighting the differences in their responses to global economic events and their reliance on trade and fiscal policies. The report concludes by summarizing the key findings and providing insights into the economic linkages between the two nations.
Document Page
qwertyuiopasdfghjklzxcvbnmqwertyui
opasdfghjklzxcvbnmqwertyuiopasdfgh
jklzxcvbnmqwertyuiopasdfghjklzxcvb
nmqwertyuiopasdfghjklzxcvbnmqwer
tyuiopasdfghjklzxcvbnmqwertyuiopas
dfghjklzxcvbnmqwertyuiopasdfghjklzx
cvbnmqwertyuiopasdfghjklzxcvbnmq
wertyuiopasdfghjklzxcvbnmqwertyuio
pasdfghjklzxcvbnmqwertyuiopasdfghj
klzxcvbnmqwertyuiopasdfghjklzxcvbn
mqwertyuiopasdfghjklzxcvbnmqwerty
uiopasdfghjklzxcvbnmqwertyuiopasdf
ghjklzxcvbnmqwertyuiopasdfghjklzxc
vbnmqwertyuiopasdfghjklzxcvbnmrty
uiopasdfghjklzxcvbnmqwertyuiopasdf
ghjklzxcvbnmqwertyuiopasdfghjklzxc
A Comparative Analysis of the Australian and US Economy between
1985 - 2016
[Type the document subtitle]
[Pick the date]
Com
tabler-icon-diamond-filled.svg

Paraphrase This Document

Need a fresh take? Get an instant paraphrase of this document with our AI Paraphraser
Document Page
Contents
1. Introduction.........................................................................................................................................2
2. Real GDP Growth Rates: A Comparison...............................................................................................2
3. The Role of Exchange Rates.................................................................................................................6
4. The Role of Trade Balance or Net Exports...........................................................................................8
5. The Role of Interest Rates.................................................................................................................11
6. Conclusion.........................................................................................................................................14
Bibliography...............................................................................................................................................15
Document Page
Executive Summary
Australia and the United States have seen tremendous growth since the year 1991. The Australian
growth for a period of nearly a decade beginning in the early 1990s is generally known as an economic
miracle. The two countries enjoyed similar growth rates and similar growth paths in during the decade
from 1991-2000. This led many to believe that there are linkages between the real economy of the USA
and the Australian economy and explore the linkages between the two economies. While the two
countries seem to have similar track records, it could be purely circumstantial. The following paper
analyses the data on various macro-economic parameters such as Real GDP Growth Rate, Real Effective
Exchange Rate, Interest Rates and Net Exports growth between the two countries.
Document Page
Introduction
Australia and the United States have seen tremendous growth since the year 1991. The country
followed very similar trajectories of economic growth since the year 1985 for nearly up to a decade. This
has led to the belief that the Australian economy is greatly affected by movements in other economies.
However, Bean (2000) argues that this was a period of prosperity for most advanced countries including
other countries like Japan. The economies of the two countries are linked due to trade and globalization
but the two countries have differences too. These include differences in population size , geographical
positions and more
tabler-icon-diamond-filled.svg

Paraphrase This Document

Need a fresh take? Get an instant paraphrase of this document with our AI Paraphraser
Document Page
2. Real GDP Growth Rates: A Comparison
Table 1Table 1 A Comparison between the Real GDP Growth Rates of Australia and USA. Source: (International Monetary
Fund, 2017)
Document Page
Year Real GDP Growth Rate
USA
Real GDP Growth Rate
Australia
1985 4.2 5.5
1986 3.5 2.4
1987 3.5 4.9
1988 4.2 4.3
1989 3.7 4.6
1990 1.9 1.5
1991 -0.1 -1
1992 3.6 2.7
1993 2.7 4
1994 4 4.9
1995 2.7 2.9
1996 3.8 4.3
1997 4.5 4.3
1998 4.4 4.7
1999 4.7 4.3
2000 4.1 3.2
2001 1 2.5
2002 1.8 4
2003 2.8 3
2004 3.8 4.1
2005 3.3 3.2
2006 2.7 2.7
2007 1.8 4.5
2008 -0.3 2.6
2009 -2.8 1.7
2010 2.5 2.3
2011 1.6 2.7
2012 2.2 3.6
2013 1.7 2.1
Document Page
Graph 1 A Comparison between the Real GDP Growth Rates of Australia and USA. Source: (International Monetary Fund,
2017)
As seen from the above graph, there is definitely a co-relation between the trajectories of the
growth rates. During the Asian Crisis of 1997, the Australian and the US economy grew further
despite the odds of lower demand from Asia. However, the US economy growth seems to have
hit rock bottom during the financial crisis but recovered as sharply as it fell, showing a higher
growth rate than the USA and then again in 2014.. In the economic Survey of 2016, the
Organization for Economic Co-operation and Development, (2017) commended the USA for
achieving better GDP growth than most countries in the OECD, including Australia. The year
2007, there was sub-prime housing crisis in the USA which then morphed into a global financial
crisis. (Demyanyk & Hemert, 2009)
Recovering from a recession in the 1991, both countries have shown a growth remarkable
growth between 1992-2000. Some of the reasons that led to a period of sustained growth in
Australia are the deregulation of the financial sector, the removal of barriers on trade and floating
the currency in the free market (Harchaoui, Jean, & Tarkhani, 2006). At the same time, the USA
with its neo-liberal trade policies, fiscal and monetary policies of allowing smaller budget
deficits and progressive taxation, also underwent periods of economic boom. (Kotz, 2003)
(Jeffery Frankel, 2001) This was a period of high private sector investment and high consumer
spending in USA. (Jeffery Frankel, 2001) During this period, asset prices in advanced
economies were beginning to bubble. (Bean, 2000) This helps establish that are linkages between
the various economies of the world.
Following the period of sustained growth, there is a sudden sharp dip in the year 2008. The
Financial Crisis of 2008-2009 was one of the biggest economic crises that the world has
experience since the Second World War. (Bean, 2000) The economy of USA took a serious hit
and went into a recession with a Real GDP growth rate of -3% but the Australian economy did
not take such a sharp dip.
The US economy also seems to have been more volatile following the crisis, than the Australian
economy. According to Organization for Economic Co-operation and Development, (2017), the
US economy still seems to be reeling from the after-effects of the financial crisis despite a
sustained growth for the seven years following the crisis.
tabler-icon-diamond-filled.svg

Paraphrase This Document

Need a fresh take? Get an instant paraphrase of this document with our AI Paraphraser
Document Page
The graph above shows that co-relation between the US economy and the Australian economy
starts to weaken during the crisis as the Real GDP growth rate is largely better than the real US
growth rate at the tail end i.e. in the post financial crisis period.
In the post- crisis period, the US economy has expanded, although this expansion is nothing like
the previous economic expansions that the country has seen, such as the economic boom of
1990s.
According to Organization for Economic Co-operation and Development, (2017), the US
economy has surpassed the peak –crisis output levels which would indicate its recovery.
According to the OECD, the recovery has been largely due to profit margins in the private sector
of the economy, especially the technology sector. On the other hand, the commodity boom has
been responsible for the buoyant Australian economy between 2012 and 2016. Both the countries
have also has fiscal policies of allowing greater budget deficit and this seems to have off for the
two countries.
1. The Role of Exchange Rates
In this case, we have taken the Real Effective Exchange Rates (REER) to measure the macro-
economic performance since REER accounts for inflation and is largely free from distortions of
currency market speculation.
“REER is the nominal effective exchange rate (a measure of the value of a currency against a
weighted average of several foreign currencies) divided by a price deflator or index of costs.”
(International Monetary Fund, 2017) Exchange rates are related to terms of trade since a better
exchange rate implies better relative prices. “Growth in REER implies that exports became more
expensive while it became cheaper to import goods. This is an indicator of the loss in ‘trade
competitiveness’ (International Monetary Fund, 2017) The graph shown below depicts that the
Australia REER followed more or less the trajectory of the USA REER, until 1995. Following
that during period of 2000 - 2005, the Australian trade competiveness has grown comparatively
with a sharp dips in the REER. This implies that Australia outperformed USA in competitiveness
during this period. However, between 2010 and 2016, the Australia REER was greater than that
Document Page
of USA. This implies a sharp dip in the competitiveness which goes hand in hand with the GDP
growth.
The co-relation between REER and trade balances is not one sided. It has been observed that
REER in Australia, is significantly influenced by the terms of trade, thereby confirming that the
volume of trade has a significant impact on exchange rates.
(Tarditi, 1996)
Table 2: Real Effective Exchange Rates Source: ( The World Bank, 2017)
Year Australia United
States
1985 85.4 149.0
1986 74.7 125.2
1987 74.5 112.7
1988 82.1 106.2
1989 88.0 109.6
1990 85.7 104.5
1991 84.4 103.2
1992 76.3 100.7
1993 71.1 103.7
1994 74.6 103.1
1995 72.9 99.7
1996 79.8 102.7
1997 79.3 107.7
1998 72.6 115.3
1999 72.9 114.3
2000 69.7 117.9
2001 66.9 124.6
2002 70.1 124.3
2003 78.5 116.4
2004 84.5 110.9
2005 87.1 109.4
2006 86.3 108.7
Document Page
2007 91.3 103.6
2008 89.8 99.5
2009 87.3 104.0
2010 107.1 100.0
2011 109.8 95.1
2012 105.2 98.0
2013 100.1 99.1
2014 92.9 101.2
2015 92.9 113.8
2016 93.2 117.5
1985
1987
1989
1991
1993
1995
1997
1999
2001
2003
2005
2007
2009
2011
2013
2015
0
20
40
60
80
100
120
140
160
REER Comparison
Australia
United States
Graph 2: REER Comparison for Australia and USA . Source ( The World Bank, 2017)
The graph shown above has similar movements to the Real GDP Growth Rate graph, indication a
direct relationship between REER and Real GDP Growth Rate.
tabler-icon-diamond-filled.svg

Paraphrase This Document

Need a fresh take? Get an instant paraphrase of this document with our AI Paraphraser
Document Page
2. The Role of Trade Balance or Net Exports
Australia is a country with large mineral resources and agricultural commodities and these are some of
the major exports of the country. The USA is the second largest importer of goods from Australia.
(Depratment of Foreign Affairs and Trade, Australian Government, 2017)
Table 3: Trade Balances or Net Exports of USA with Australia as a trading partner
Year Net Exports for
USA to Australia
(in Million Dollars
Exports Imports
1985 2,604.10 5,440.40 2,836.30
1986 2,923.40 5,551.10 2,627.70
1987 2,489.30 5,494.80 3,005.50
1988 3,431.50 6,972.90 3,541.40
1989 4,458.40 8,331.30 3,872.90
1990 4,091.10 8,537.70 4,446.60
1991 4,415.80 8,403.80 3,988.00
1992 5,188.30 8,875.90 3,687.60
1993 4,979.40 8,276.70 3,297.30
1994 6,578.50 9,780.60 3,202.10
1995 7,466.10 10,789.10 3,323.00
1996 8,139.50 12,008.40 3,868.90
1997 7,460.60 12,062.90 4,602.30
1998 6,530.50 11,917.50 5,387.00
1999 6,538.20 11,818.30 5,280.10
2000 6,044.40 12,482.40 6,438.00
2001 4,452.70 10,930.50 6,477.80
2002 6,606.10 13,084.90 6,478.80
2003 6,673.90 13,087.60 6,413.70
2004 6,412.40 13,957.90 7,545.50
2005 8,246.30 15,588.50 7,342.20
2006 9,341.70 17,545.70 8,204.00
2007 10,563.20 19,178.20 8,615.00
2008 11,629.80 22,218.60 10,588.80
Document Page
2009 11,587.80 19,599.30 8,011.50
2010 13,221.70 21,804.60 8,582.90
2011 17,383.30 27,626.20 10,242.90
2012 21,594.60 31,161.40 9,566.80
2013 16,851.20 26,123.70 9,272.60
2014 15,984.40 26,681.70 10,697.30
2015 14,150.60 25,034.10 10,883.50
2016 12,649.80 22,159.70 9,509.90
In the table above, the net exports (exports- imports) also known as trade balance have surged
since 1985, implying that the growth rate of the net exports from USA to Australia has surged
continually with a single dip. Overall, Net exports for USA have remained positive throughout.
As seen in the table above, the exports from USA to Australia grew at a faster rate than the
imports from USA to Australia. This growth has been continuous with the only decline seen
during the four year period following the Asian crisis. A decline in the exports to Australia from
USA signifies lower demand. However, domestic demand surged during the same in Australia.
An excess of exports to imports affects the exchange rate of the country. This could also imply,
that the USA industries rely more on Australia than on the Australia markets rely on the USA.
Assuming that USA’s imports from Australia are the Australia’s exports to USA, we could draw
the following chart.
chevron_up_icon
1 out of 18
circle_padding
hide_on_mobile
zoom_out_icon
[object Object]