Financial Performance Comparison: Goldman Sachs and JP Morgan Chase
VerifiedAdded on 2022/12/29
|37
|7387
|71
Report
AI Summary
This report presents a detailed financial statement analysis comparing Goldman Sachs and JP Morgan Chase, two of the world's largest investment banks. The study aims to evaluate their financial performance by calculating and comparing key financial ratios such as Return on Equity (ROE), Price to Earnings ratio (P/E), and Return on Investment (ROI). The research explores the objectives of financial statement analysis, including assessing a bank's long-range objectives and maximizing firm value. It reviews relevant literature on balance sheet and income statement analysis, off-balance-sheet items, and the importance of interpreting profitability and operating efficiency ratios. The methodology section outlines the research approach, philosophy (positivism), and justification for the chosen methods, including descriptive research strategies and the deductive approach. The analysis aims to identify which bank performs better, the reasons behind the differences, and the implications for management decisions and stakeholder expectations. The report also highlights the significance of financial statement analysis in evaluating a bank's financial condition and detecting areas for improvement.
A STUDY ON FINANCIAL STATEMENT ANALYSIS OF THE BANKING
INSTITUTIONS
INSTITUTIONS
Paraphrase This Document
Need a fresh take? Get an instant paraphrase of this document with our AI Paraphraser
1
Chapter 1
1.1Introduction
The research report contains a detail analysis of the financial statement analysis of
Goldman Sachs and JP Morgan chase which is considered to be the largest investment banks
in the world. JP Morgan chase is an American multinational company headquartered in New
york city it is the largest bank in US and the sixth largest bank in the world the company has
a total assets value of $2.535 trillion. By market capitalisation it is the world’s most valuable
bank. on the other hand Goldman Sachs is also a USA based company the headquarter of
which is situated in west street in Manhattan. The company assets valuation is about US
$1.542 trillion and is also considered as one of the largest banks in the world.
1.2 Research aim
The aim of the report is to make a comparative analysis of the financial statement of
both the banks and make a comparison among these two banks. For comparison different
ratios like the return on equity, price to earnings ratio, return on investment ratios is
calculated.
1.3 Research objective
The objective of the research is to find out that among these two banks which bank is
performing better and what is the reason of one bank being better, than the other one. The
research also try to find out the importance of the analysis of the financial statements like the
balance sheet and income statement, and how these financial statement is used to evaluate
the financial condition of any organisation.
2
1.4 Problem statement
The main reason to make a comparison between these two banks is to find out the
reason why one bank is able perform better than the other and what actions the management
should take in order to reduce the gap that has been arise between these two organisations.
The financial statements is analysed to detect the isas where the banks should give more
emphasis in order to bring more efficiency in their operations and to meet the expectations of
the stakeholders.
Chapter 2
2.1literature review
The particular services each bank chooses to offer and the overall size of a banking
organization is reflected in its financial statements. The two main financial statements that
bank managers, customers (particularly large depositors not fully protected by deposit
insurance), and the regulatory authorities look at is the balance sheet and the income
statement.
A bank’s balance sheet lists the assets, liabilities, and equity capital (owner’s funds)
held by or invested in the bank on any given date. Because banks is simply business firms
selling a particular kind of product, the basic balance sheet identity
Assets=Liabilities+ Equity capital
must be valid for banks just like any other business firm.
⊘ This is a preview!⊘
Do you want full access?
Subscribe today to unlock all pages.
Trusted by 1+ million students worldwide
3
Prominent examples of off-balance-sheet items include:
1. Standby credit agreements, in which a bank pledges to guarantee repayment
of a customer’s loan received from a third party.
2. Interest rate swaps, in which a bank promises to exchange interest payments
on debt securities with another party.
3. Financial futures and option interest-rate contracts, in which a bank agrees
to deliver or to take delivery of securities from another party at a guaranteed
price.
4. Loan commitments, in which a bank pledges to lend up to a certain amount
of funds until the commitment matures.
5. Foreign exchange rate contracts, in which a bank agrees to deliver or accept
delivery of foreign currencies.
A bank’s income statement indicates the amount of revenue received and expenses
incurred over a specific period of time, such as the current year. The principal source of bank
revenue is the interest income generated by the bank’s earning assets, mainly its loans,
securities, any interest-bearing deposits that is part of cash assets held with other banks, and
any miscellaneous assets generating revenue(including any income earned by subsidiaries of
the bank or rental income from property that it owns.
Statement of Stockholders’ Equity
Is the financial report that reveals changes in the all-important capital account,
showing how the owners’ investment of funds in the bank has changed over time. Because
Paraphrase This Document
Need a fresh take? Get an instant paraphrase of this document with our AI Paraphraser
4
stockholders’ equity represents a cushion of financial strength for the bank that can be used to
absorb losses and protect the depositors and other creditors, changes in the bank’s capital
account is closely followed by regulators and large depositors.
Evaluating a Bank’s Performance
How can we use a bank’s financial statements, particularly its balance sheet and
income statement to evaluate how well the bank is performing? What do we look at to help
decide if a bank is facing serious problems that its management should deal with?
Determining the Bank’s Long-Range Objectives
The first step in analysing any bank’s financial statements is to decide what objectives
the bank is or should be seeking. Bank performance must be directed toward specific
objectives. A fair evaluation of any bank’s performance should start by evaluating whether it
has been able to achieve the objectives its management and stockholders have chosen.
Certainly many banks have their own unique objectives.
Maximizing the Value of the firm: A Key Objective for any Bank
The basic principles of financial management, as that science is practiced today,
suggest strongly that attempting to maximize a bank’s stock value is the key objective that
should have priority over all others
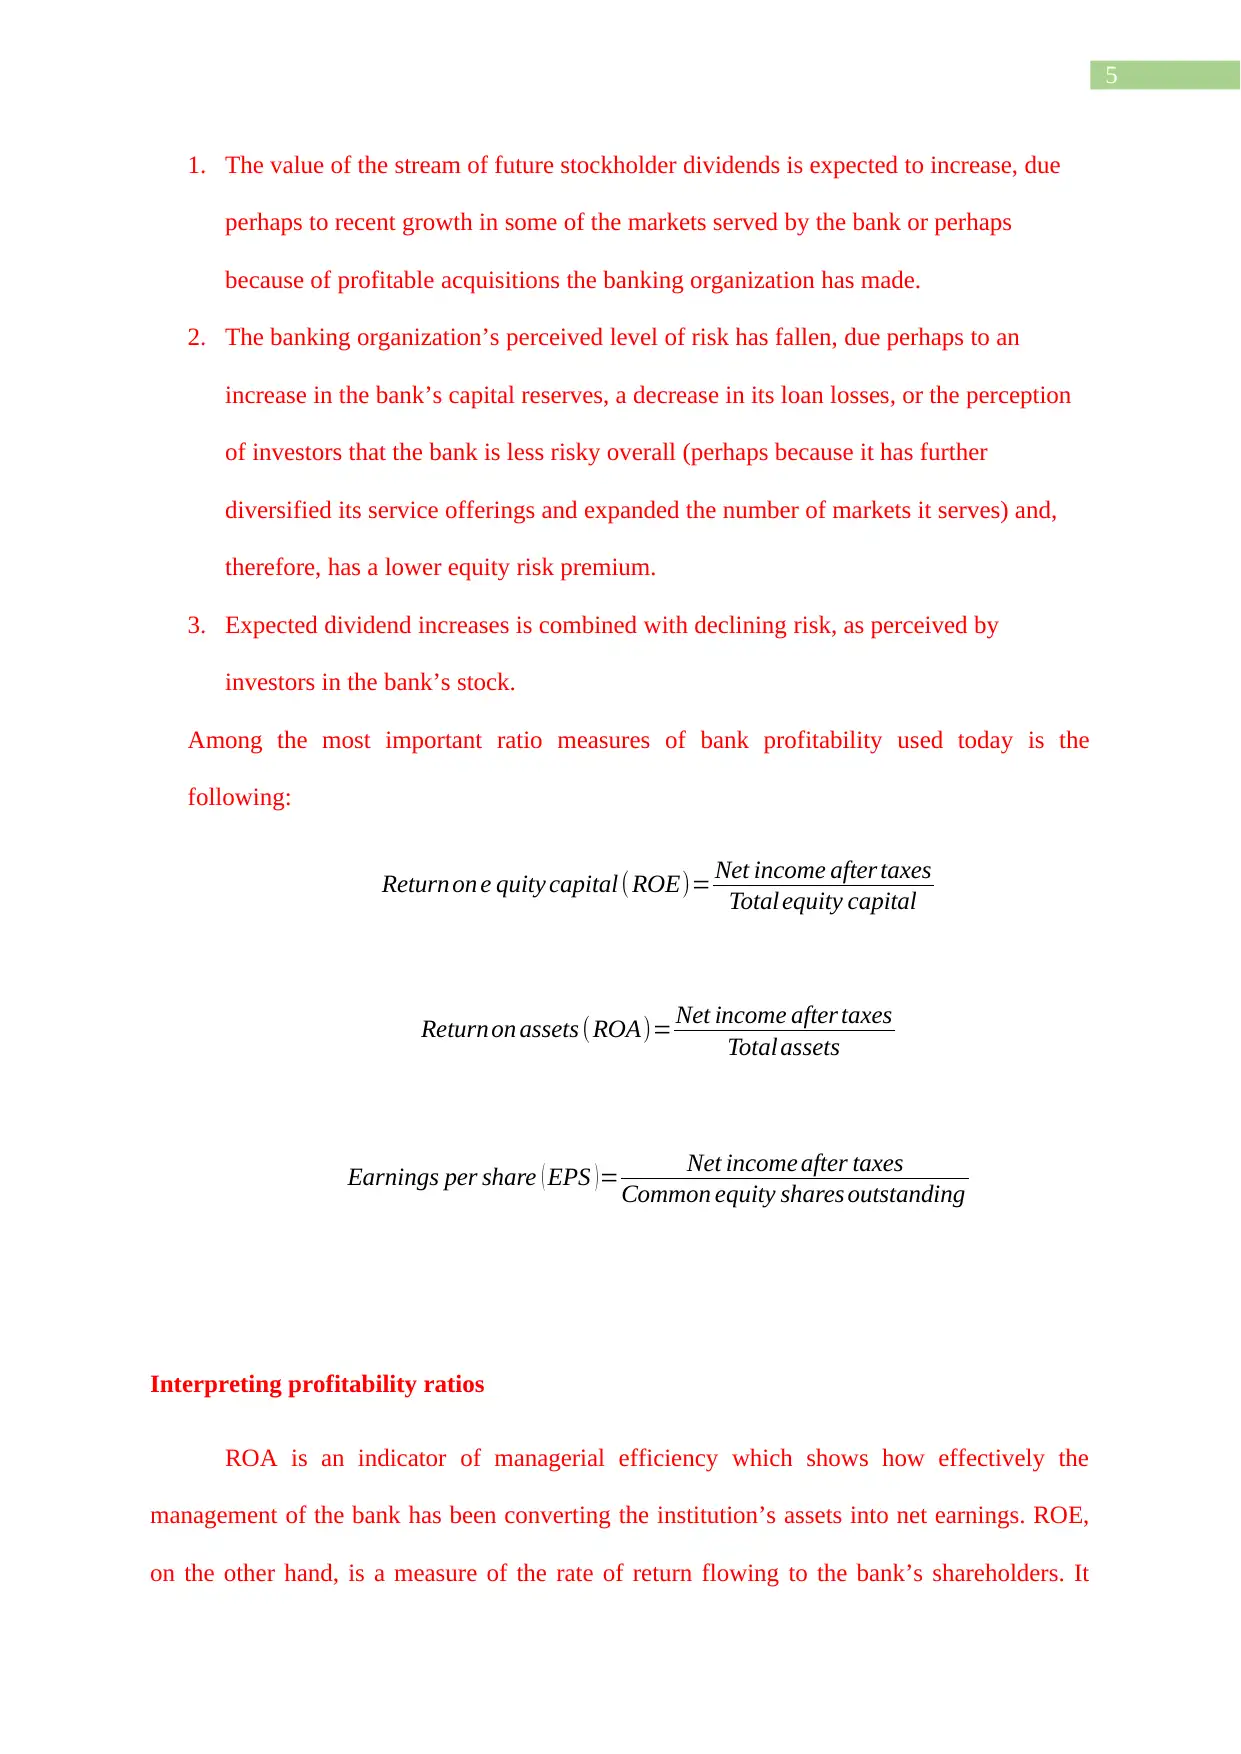
Value of thebank ’ s stoc= Expected streamof future stockholder divid
Discount factor (based on the minimum required¿ market rate of return on equity capi
The value of the bank’s stock will tend to rise in any of the following situations:
stockholders’ equity represents a cushion of financial strength for the bank that can be used to
absorb losses and protect the depositors and other creditors, changes in the bank’s capital
account is closely followed by regulators and large depositors.
Evaluating a Bank’s Performance
How can we use a bank’s financial statements, particularly its balance sheet and
income statement to evaluate how well the bank is performing? What do we look at to help
decide if a bank is facing serious problems that its management should deal with?
Determining the Bank’s Long-Range Objectives
The first step in analysing any bank’s financial statements is to decide what objectives
the bank is or should be seeking. Bank performance must be directed toward specific
objectives. A fair evaluation of any bank’s performance should start by evaluating whether it
has been able to achieve the objectives its management and stockholders have chosen.
Certainly many banks have their own unique objectives.
Maximizing the Value of the firm: A Key Objective for any Bank
The basic principles of financial management, as that science is practiced today,
suggest strongly that attempting to maximize a bank’s stock value is the key objective that
should have priority over all others
Value of thebank ’ s stoc= Expected streamof future stockholder divid
Discount factor (based on the minimum required¿ market rate of return on equity capi
The value of the bank’s stock will tend to rise in any of the following situations:
5
1. The value of the stream of future stockholder dividends is expected to increase, due
perhaps to recent growth in some of the markets served by the bank or perhaps
because of profitable acquisitions the banking organization has made.
2. The banking organization’s perceived level of risk has fallen, due perhaps to an
increase in the bank’s capital reserves, a decrease in its loan losses, or the perception
of investors that the bank is less risky overall (perhaps because it has further
diversified its service offerings and expanded the number of markets it serves) and,
therefore, has a lower equity risk premium.
3. Expected dividend increases is combined with declining risk, as perceived by
investors in the bank’s stock.
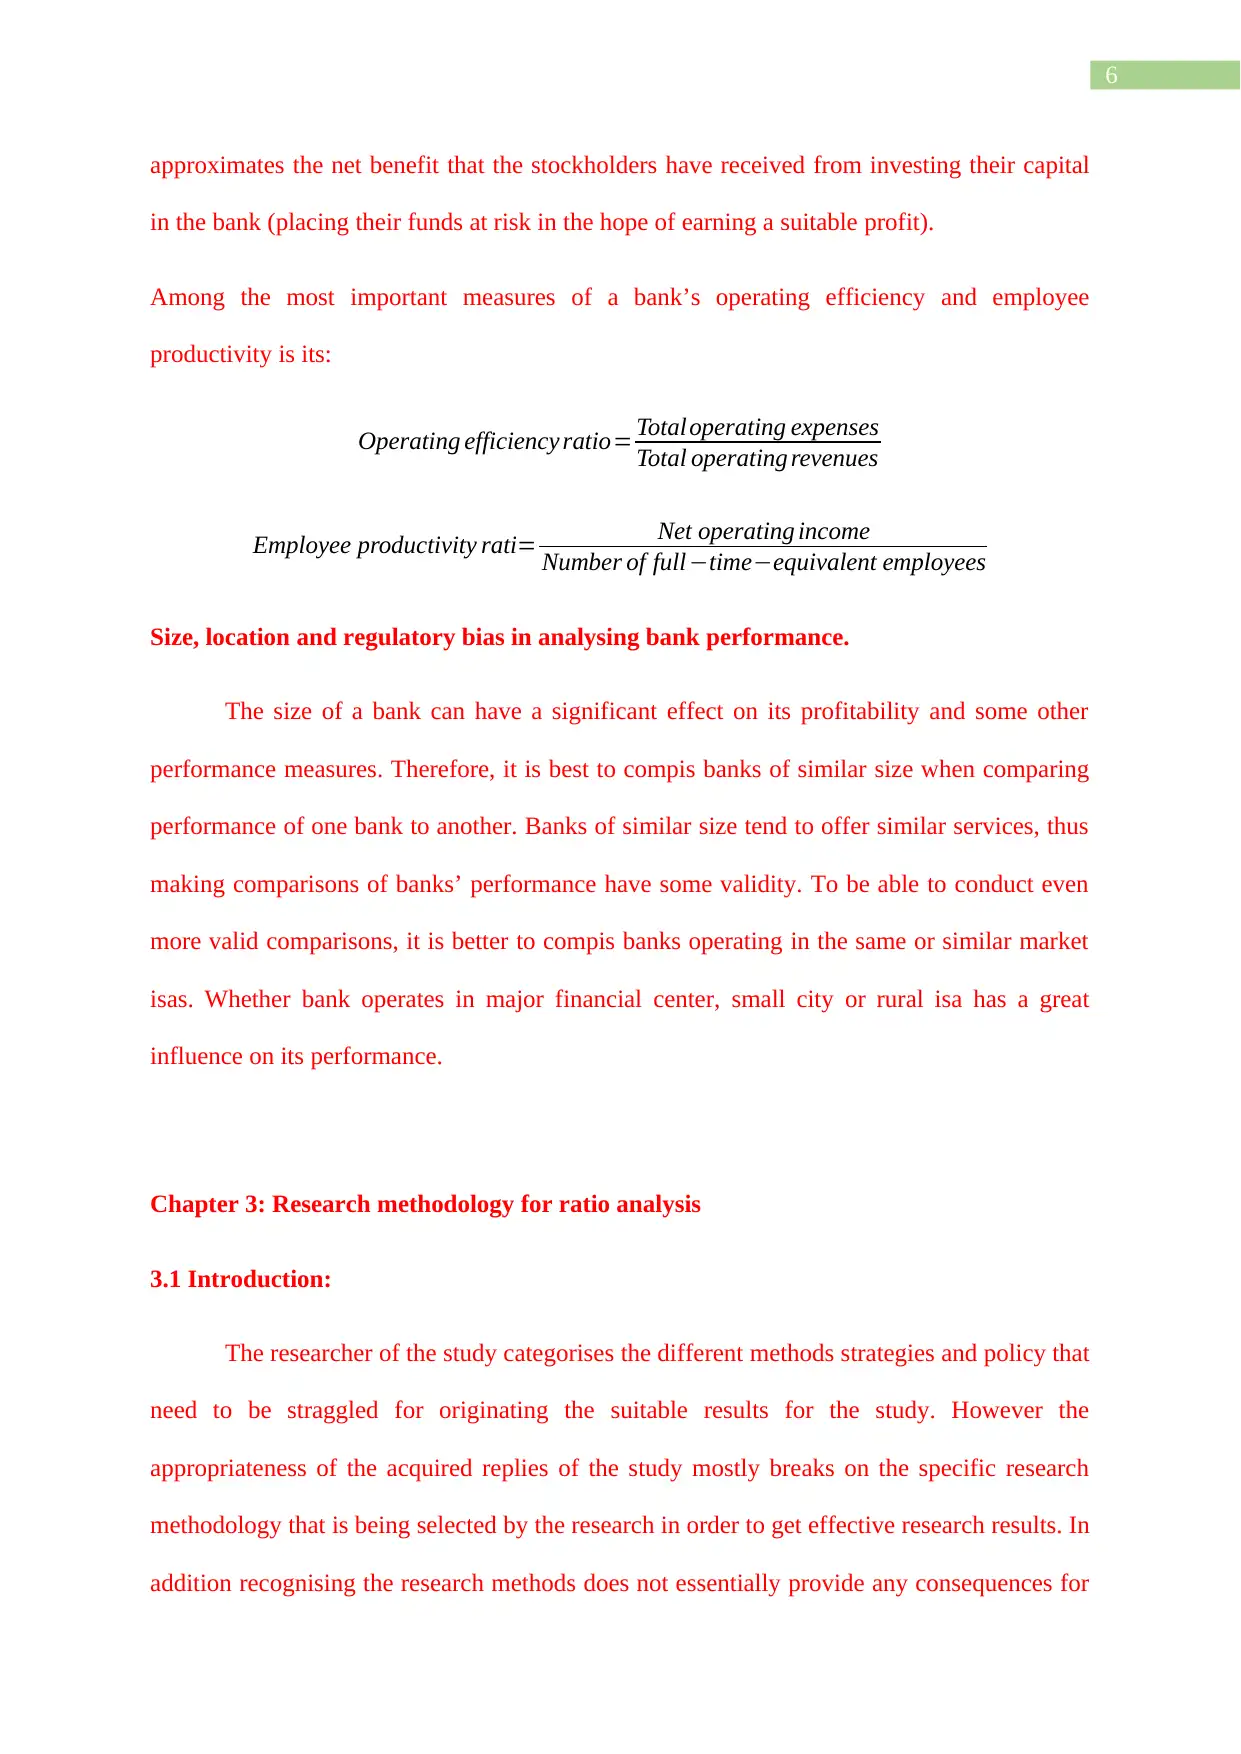
Among the most important ratio measures of bank profitability used today is the
following:
Return on e quity capital ( ROE)= Net income after taxes
Total equity capital
Return on assets (ROA)= Net income after taxes
Total assets
Earnings per share ( EPS )= Net income after taxes
Common equity shares outstanding
Interpreting profitability ratios
ROA is an indicator of managerial efficiency which shows how effectively the
management of the bank has been converting the institution’s assets into net earnings. ROE,
on the other hand, is a measure of the rate of return flowing to the bank’s shareholders. It
1. The value of the stream of future stockholder dividends is expected to increase, due
perhaps to recent growth in some of the markets served by the bank or perhaps
because of profitable acquisitions the banking organization has made.
2. The banking organization’s perceived level of risk has fallen, due perhaps to an
increase in the bank’s capital reserves, a decrease in its loan losses, or the perception
of investors that the bank is less risky overall (perhaps because it has further
diversified its service offerings and expanded the number of markets it serves) and,
therefore, has a lower equity risk premium.
3. Expected dividend increases is combined with declining risk, as perceived by
investors in the bank’s stock.
Among the most important ratio measures of bank profitability used today is the
following:
Return on e quity capital ( ROE)= Net income after taxes
Total equity capital
Return on assets (ROA)= Net income after taxes
Total assets
Earnings per share ( EPS )= Net income after taxes
Common equity shares outstanding
Interpreting profitability ratios
ROA is an indicator of managerial efficiency which shows how effectively the
management of the bank has been converting the institution’s assets into net earnings. ROE,
on the other hand, is a measure of the rate of return flowing to the bank’s shareholders. It
⊘ This is a preview!⊘
Do you want full access?
Subscribe today to unlock all pages.
Trusted by 1+ million students worldwide
6
approximates the net benefit that the stockholders have received from investing their capital
in the bank (placing their funds at risk in the hope of earning a suitable profit).
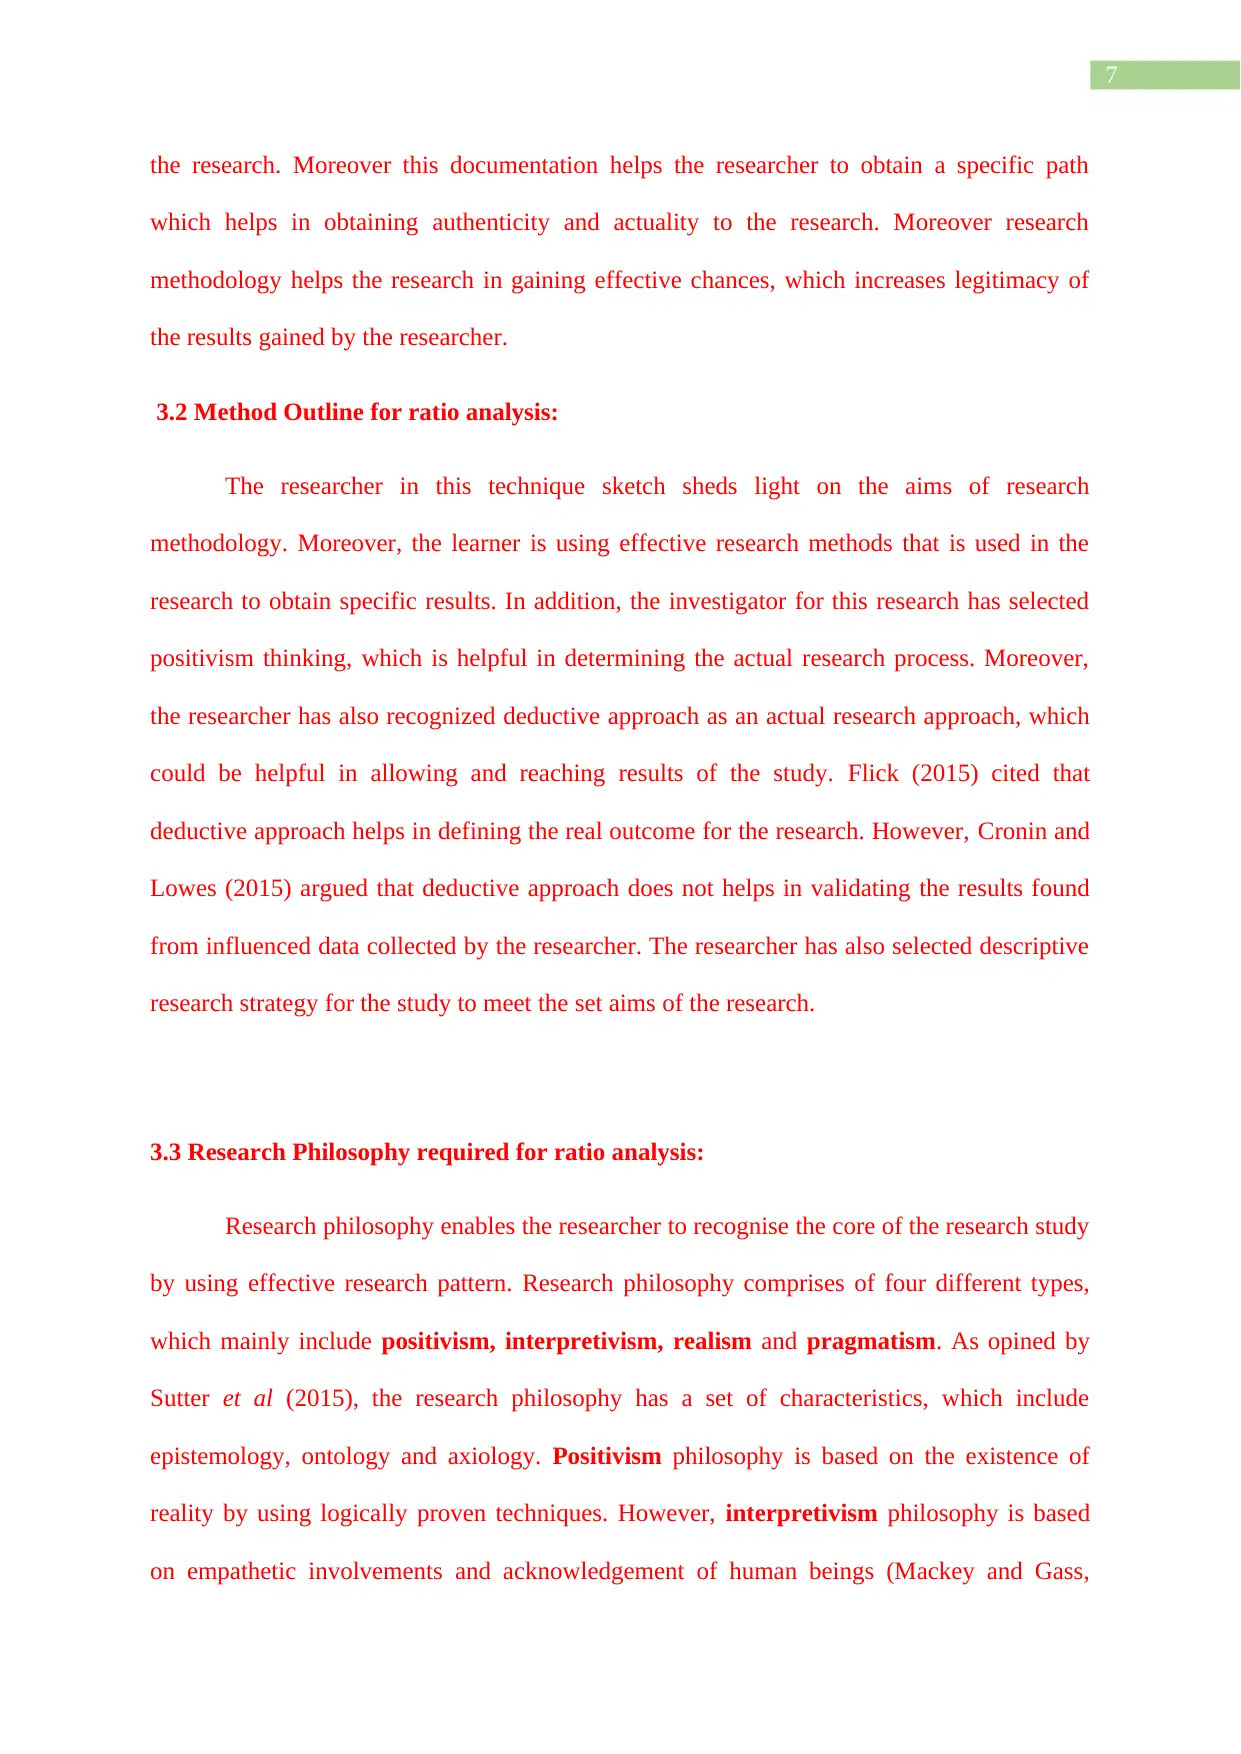
Among the most important measures of a bank’s operating efficiency and employee
productivity is its:
Operating efficiency ratio= Total operating expenses
Total operating revenues
Employee productivity rati= Net operating income
Number of full−time−equivalent employees
Size, location and regulatory bias in analysing bank performance.
The size of a bank can have a significant effect on its profitability and some other
performance measures. Therefore, it is best to compis banks of similar size when comparing
performance of one bank to another. Banks of similar size tend to offer similar services, thus
making comparisons of banks’ performance have some validity. To be able to conduct even
more valid comparisons, it is better to compis banks operating in the same or similar market
isas. Whether bank operates in major financial center, small city or rural isa has a great
influence on its performance.
Chapter 3: Research methodology for ratio analysis
3.1 Introduction:
The researcher of the study categorises the different methods strategies and policy that
need to be straggled for originating the suitable results for the study. However the
appropriateness of the acquired replies of the study mostly breaks on the specific research
methodology that is being selected by the research in order to get effective research results. In
addition recognising the research methods does not essentially provide any consequences for
approximates the net benefit that the stockholders have received from investing their capital
in the bank (placing their funds at risk in the hope of earning a suitable profit).
Among the most important measures of a bank’s operating efficiency and employee
productivity is its:
Operating efficiency ratio= Total operating expenses
Total operating revenues
Employee productivity rati= Net operating income
Number of full−time−equivalent employees
Size, location and regulatory bias in analysing bank performance.
The size of a bank can have a significant effect on its profitability and some other
performance measures. Therefore, it is best to compis banks of similar size when comparing
performance of one bank to another. Banks of similar size tend to offer similar services, thus
making comparisons of banks’ performance have some validity. To be able to conduct even
more valid comparisons, it is better to compis banks operating in the same or similar market
isas. Whether bank operates in major financial center, small city or rural isa has a great
influence on its performance.
Chapter 3: Research methodology for ratio analysis
3.1 Introduction:
The researcher of the study categorises the different methods strategies and policy that
need to be straggled for originating the suitable results for the study. However the
appropriateness of the acquired replies of the study mostly breaks on the specific research
methodology that is being selected by the research in order to get effective research results. In
addition recognising the research methods does not essentially provide any consequences for
Paraphrase This Document
Need a fresh take? Get an instant paraphrase of this document with our AI Paraphraser
7
the research. Moreover this documentation helps the researcher to obtain a specific path
which helps in obtaining authenticity and actuality to the research. Moreover research
methodology helps the research in gaining effective chances, which increases legitimacy of
the results gained by the researcher.
3.2 Method Outline for ratio analysis:
The researcher in this technique sketch sheds light on the aims of research
methodology. Moreover, the learner is using effective research methods that is used in the
research to obtain specific results. In addition, the investigator for this research has selected
positivism thinking, which is helpful in determining the actual research process. Moreover,
the researcher has also recognized deductive approach as an actual research approach, which
could be helpful in allowing and reaching results of the study. Flick (2015) cited that
deductive approach helps in defining the real outcome for the research. However, Cronin and
Lowes (2015) argued that deductive approach does not helps in validating the results found
from influenced data collected by the researcher. The researcher has also selected descriptive
research strategy for the study to meet the set aims of the research.
3.3 Research Philosophy required for ratio analysis:
Research philosophy enables the researcher to recognise the core of the research study
by using effective research pattern. Research philosophy comprises of four different types,
which mainly include positivism, interpretivism, realism and pragmatism. As opined by
Sutter et al (2015), the research philosophy has a set of characteristics, which include
epistemology, ontology and axiology. Positivism philosophy is based on the existence of
reality by using logically proven techniques. However, interpretivism philosophy is based
on empathetic involvements and acknowledgement of human beings (Mackey and Gass,
8
2015). On the contrary, Kumar (2019) contended that positivism philosophy helps the
researcher to analyse the data accumulated by using both quantitative and qualitative
approaches.
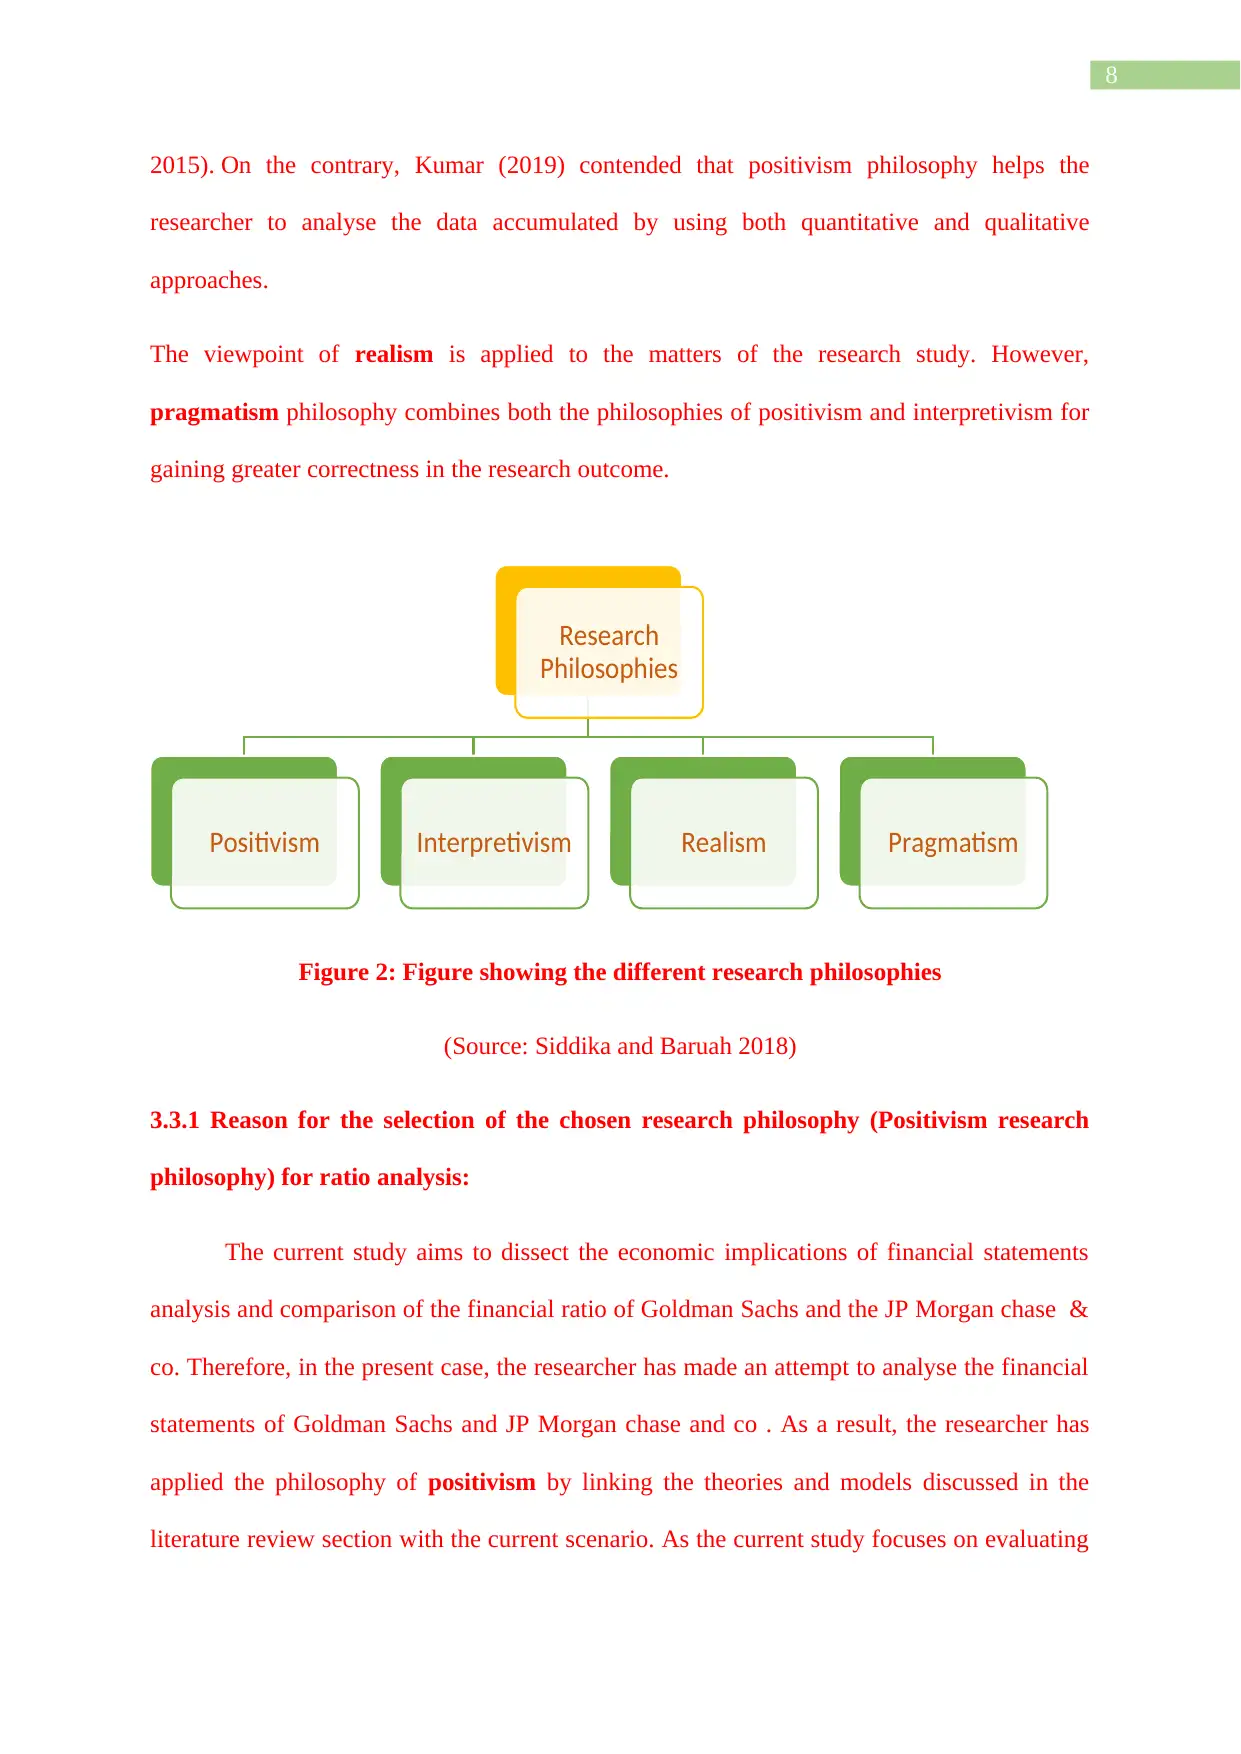
The viewpoint of realism is applied to the matters of the research study. However,
pragmatism philosophy combines both the philosophies of positivism and interpretivism for
gaining greater correctness in the research outcome.
Figure 2: Figure showing the different research philosophies
(Source: Siddika and Baruah 2018)
3.3.1 Reason for the selection of the chosen research philosophy (Positivism research
philosophy) for ratio analysis:
The current study aims to dissect the economic implications of financial statements
analysis and comparison of the financial ratio of Goldman Sachs and the JP Morgan chase &
co. Therefore, in the present case, the researcher has made an attempt to analyse the financial
statements of Goldman Sachs and JP Morgan chase and co . As a result, the researcher has
applied the philosophy of positivism by linking the theories and models discussed in the
literature review section with the current scenario. As the current study focuses on evaluating
Research
Philosophies
Positivism Interpretivism Realism Pragmatism
2015). On the contrary, Kumar (2019) contended that positivism philosophy helps the
researcher to analyse the data accumulated by using both quantitative and qualitative
approaches.
The viewpoint of realism is applied to the matters of the research study. However,
pragmatism philosophy combines both the philosophies of positivism and interpretivism for
gaining greater correctness in the research outcome.
Figure 2: Figure showing the different research philosophies
(Source: Siddika and Baruah 2018)
3.3.1 Reason for the selection of the chosen research philosophy (Positivism research
philosophy) for ratio analysis:
The current study aims to dissect the economic implications of financial statements
analysis and comparison of the financial ratio of Goldman Sachs and the JP Morgan chase &
co. Therefore, in the present case, the researcher has made an attempt to analyse the financial
statements of Goldman Sachs and JP Morgan chase and co . As a result, the researcher has
applied the philosophy of positivism by linking the theories and models discussed in the
literature review section with the current scenario. As the current study focuses on evaluating
Research
Philosophies
Positivism Interpretivism Realism Pragmatism
⊘ This is a preview!⊘
Do you want full access?
Subscribe today to unlock all pages.
Trusted by 1+ million students worldwide
9
the financial ratios of Goldman Sachs and JP Morgan chase and co and thereby make a
comparison of these two companies, positivism is the most relevant philosophy to evaluate
the financial ratios of these two banks. The researcher has not applied the other philosophies,
as they is not based on scientifically proven theories and models.
3.4 Research Approach for ratio analysis:
Research approach is the most critical step in directing research study for arriving at
the real and anticipated result of the research. In this situation, Johnson et al (2017) stated
that research approach helps the researcher to recognise each step for execution the desired
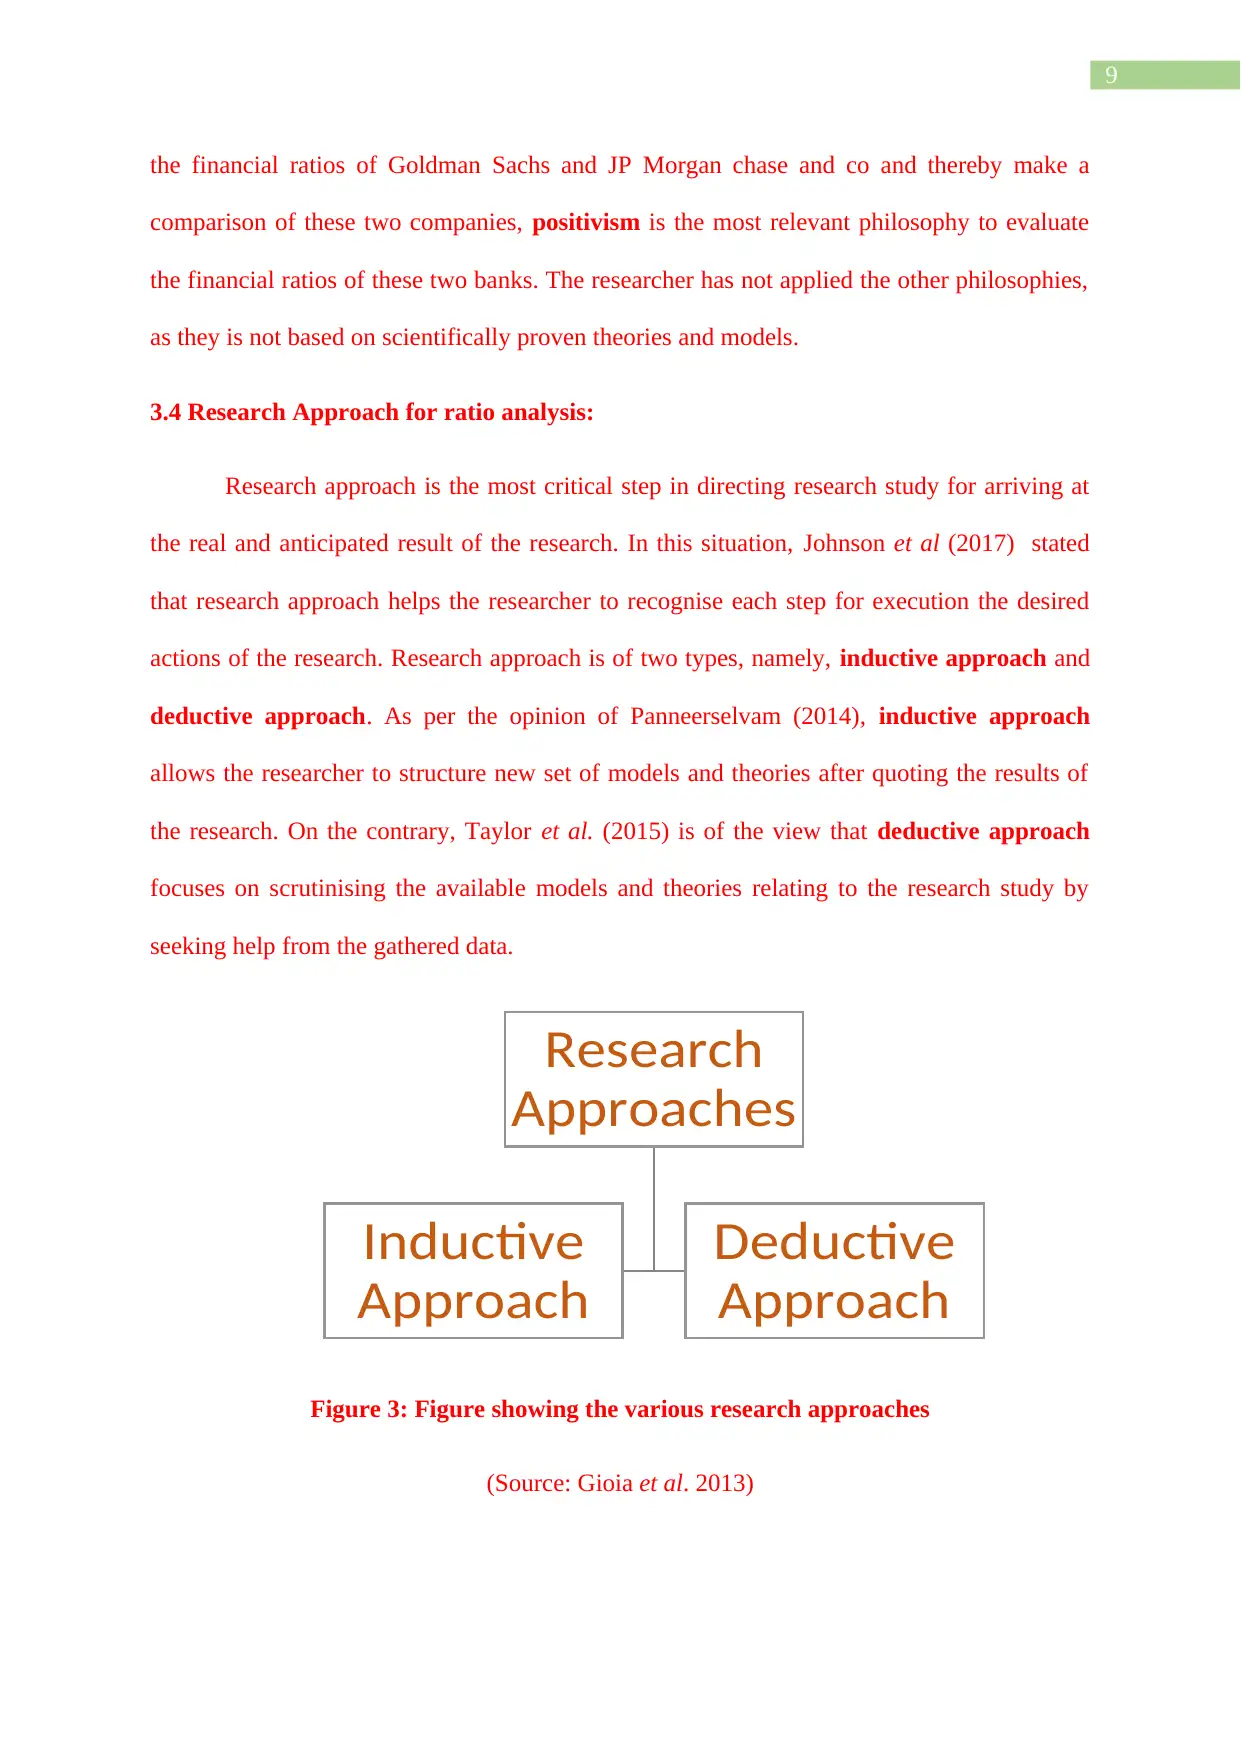
actions of the research. Research approach is of two types, namely, inductive approach and
deductive approach. As per the opinion of Panneerselvam (2014), inductive approach
allows the researcher to structure new set of models and theories after quoting the results of
the research. On the contrary, Taylor et al. (2015) is of the view that deductive approach
focuses on scrutinising the available models and theories relating to the research study by
seeking help from the gathered data.
Figure 3: Figure showing the various research approaches
(Source: Gioia et al. 2013)
Research
Approaches
Inductive
Approach
Deductive
Approach
the financial ratios of Goldman Sachs and JP Morgan chase and co and thereby make a
comparison of these two companies, positivism is the most relevant philosophy to evaluate
the financial ratios of these two banks. The researcher has not applied the other philosophies,
as they is not based on scientifically proven theories and models.
3.4 Research Approach for ratio analysis:
Research approach is the most critical step in directing research study for arriving at
the real and anticipated result of the research. In this situation, Johnson et al (2017) stated
that research approach helps the researcher to recognise each step for execution the desired
actions of the research. Research approach is of two types, namely, inductive approach and
deductive approach. As per the opinion of Panneerselvam (2014), inductive approach
allows the researcher to structure new set of models and theories after quoting the results of
the research. On the contrary, Taylor et al. (2015) is of the view that deductive approach
focuses on scrutinising the available models and theories relating to the research study by
seeking help from the gathered data.
Figure 3: Figure showing the various research approaches
(Source: Gioia et al. 2013)
Research
Approaches
Inductive
Approach
Deductive
Approach
Paraphrase This Document
Need a fresh take? Get an instant paraphrase of this document with our AI Paraphraser
10
3.5 Justification for the selection of the chosen research approach (Deductive) for ratio
analysis:
As the current research focus on evaluating the financial strength of JP Morgan chase
and Goldman Sachs, it will be required to analyse the financial statements of these two banks
and there by calculating the different ratios of JP Morgan chase and Goldman Sachs. Since
the researcher has used quantitative analysis for accomplishment of the outcome of the
research. The quantitative analysis is performed by appraising the responses received from
the defendants. In addition, the positivism philosophy is directly related to quantitative data
analysis, in which the data congregated has been assessed with the help of the historical
trends and prevailing models and recognized facts. Therefore, deductive approach has been
considered as the most pertinent one for accomplishment the actual consequences of the
research study.
3.6 Research Design for financial ratio analysis:
Research design offers the researcher a chance of guiding the study towards achieving
a specific goal based on the research purposes. As cited by Tesch (2013), research design
helps the researcher to deliver the orientation by preventing the embattled results, in which
the enduring part of the complete research is attained on the declisd goal. Research design
can be of three categories, which include explanatory research design, exploratory
research design and descriptive research design. Explanatory research design helps in
describing the cause-effect relationship by predicting the likely future consequences of the
constant process (Rimando et al 2015).
.
11
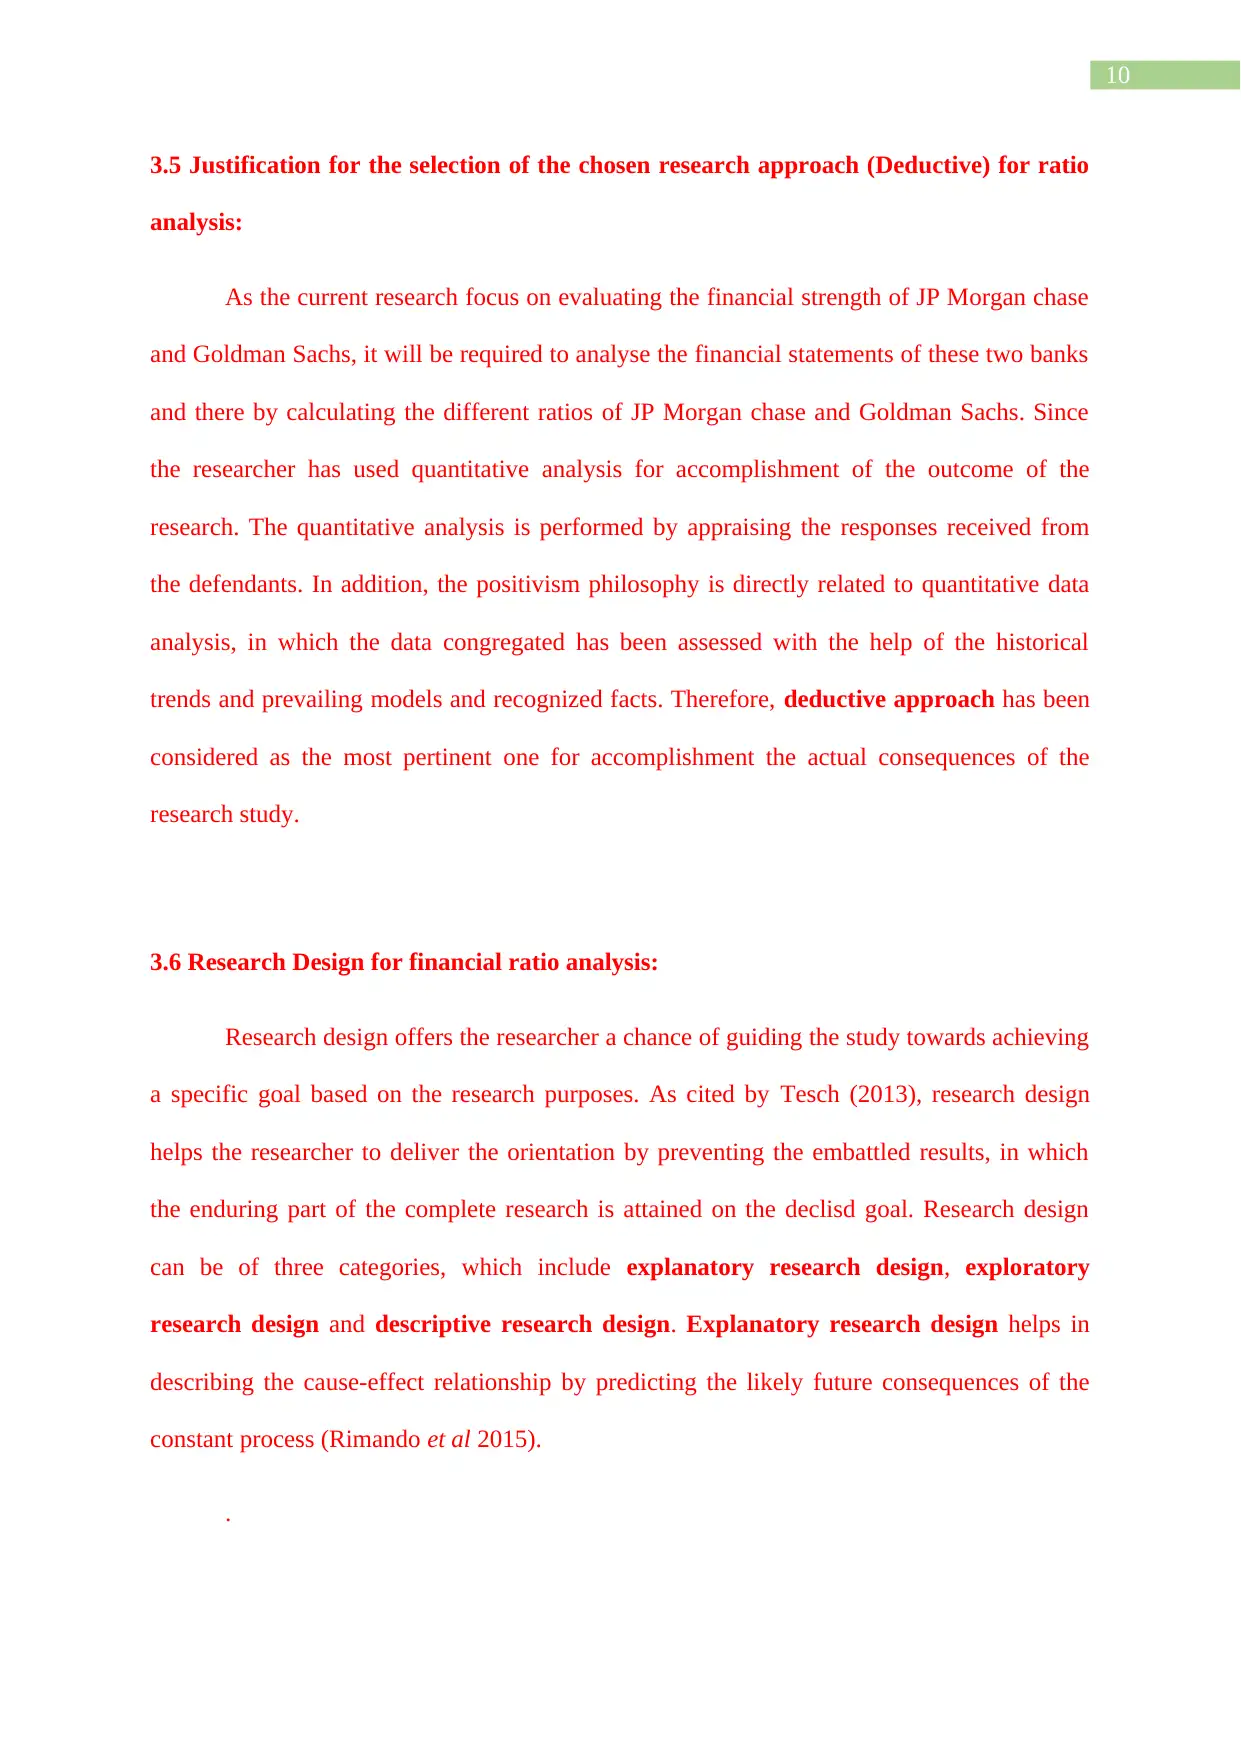
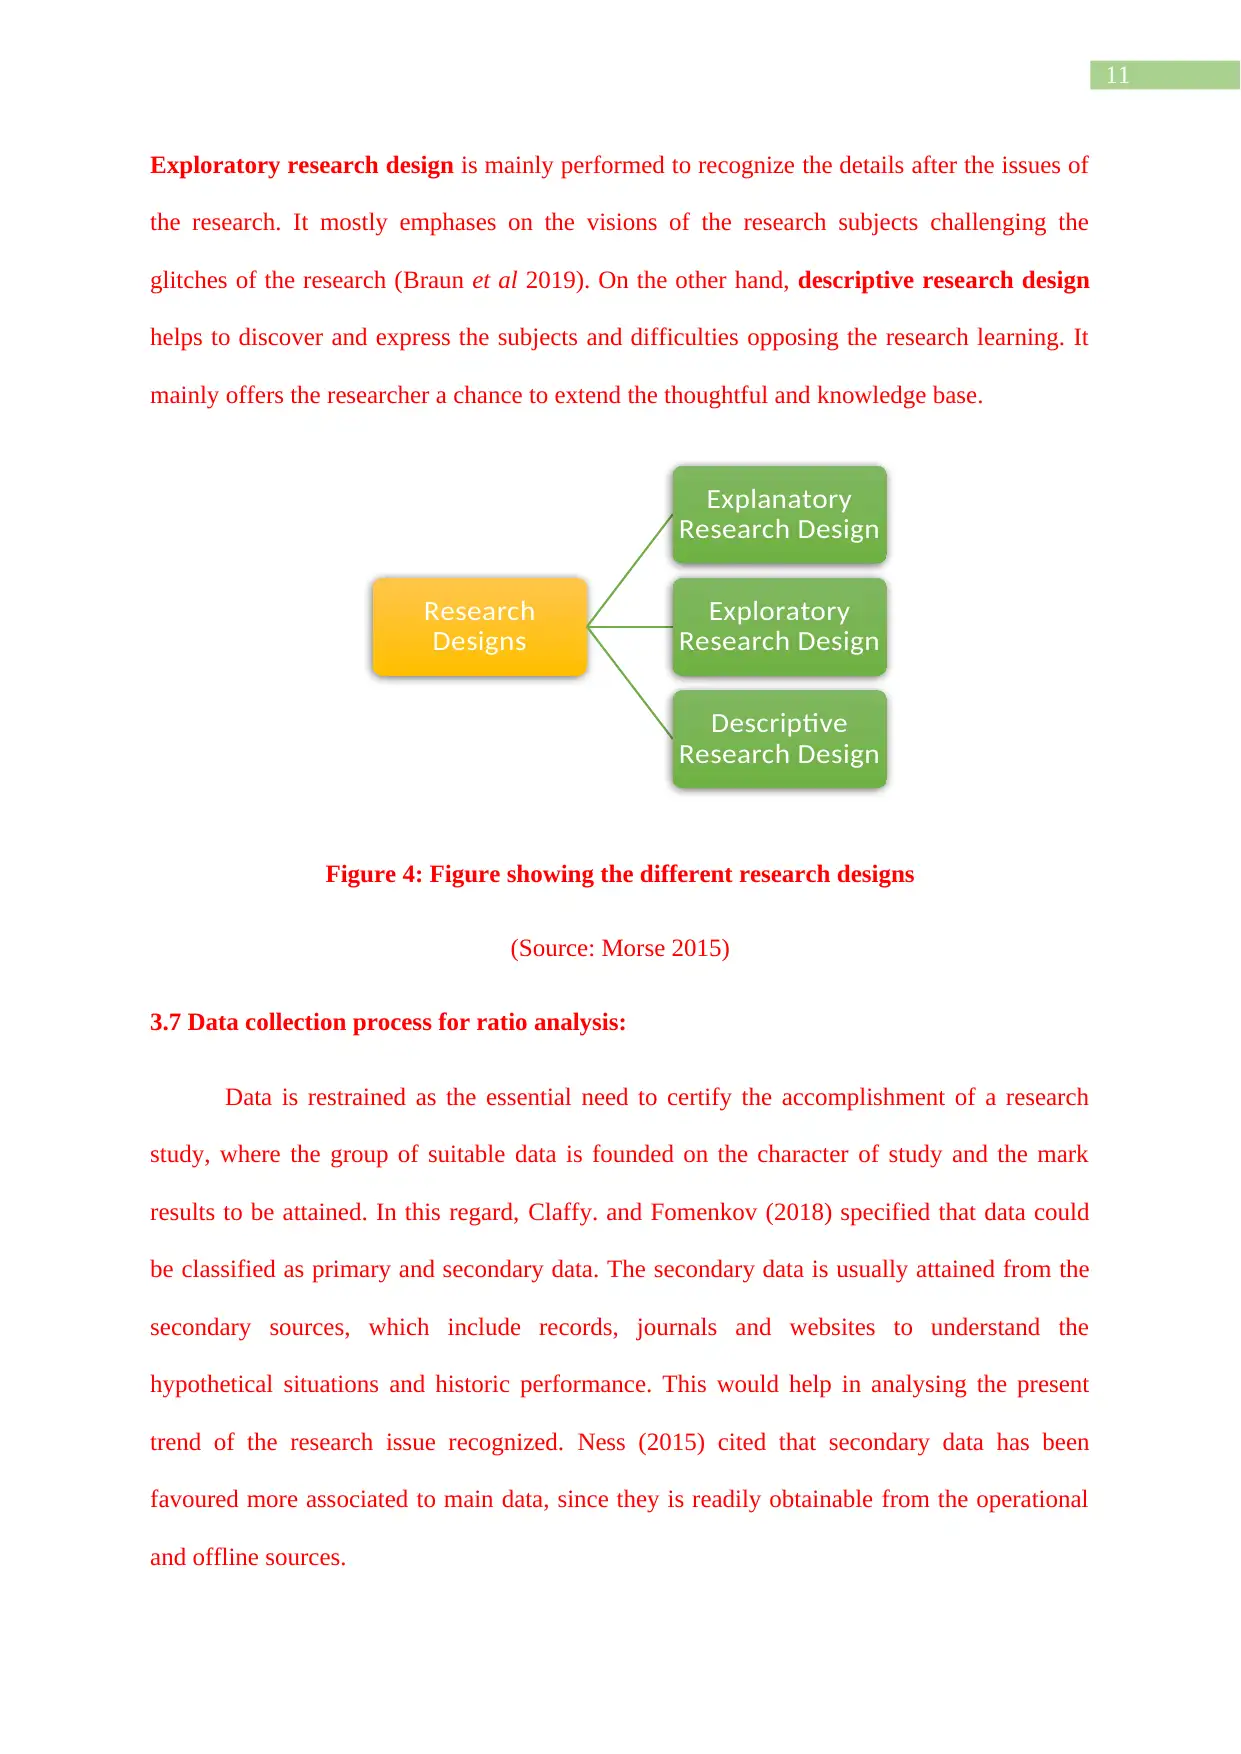
Exploratory research design is mainly performed to recognize the details after the issues of
the research. It mostly emphases on the visions of the research subjects challenging the
glitches of the research (Braun et al 2019). On the other hand, descriptive research design
helps to discover and express the subjects and difficulties opposing the research learning. It
mainly offers the researcher a chance to extend the thoughtful and knowledge base.
Figure 4: Figure showing the different research designs
(Source: Morse 2015)
3.7 Data collection process for ratio analysis:
Data is restrained as the essential need to certify the accomplishment of a research
study, where the group of suitable data is founded on the character of study and the mark
results to be attained. In this regard, Claffy. and Fomenkov (2018) specified that data could
be classified as primary and secondary data. The secondary data is usually attained from the
secondary sources, which include records, journals and websites to understand the
hypothetical situations and historic performance. This would help in analysing the present
trend of the research issue recognized. Ness (2015) cited that secondary data has been
favoured more associated to main data, since they is readily obtainable from the operational
and offline sources.
Research
Designs
Explanatory
Research Design
Exploratory
Research Design
Descriptive
Research Design
⊘ This is a preview!⊘
Do you want full access?
Subscribe today to unlock all pages.
Trusted by 1+ million students worldwide
1 out of 37
Related Documents


Your All-in-One AI-Powered Toolkit for Academic Success.
+13062052269
info@desklib.com
Available 24*7 on WhatsApp / Email
![[object Object]](/_next/static/media/star-bottom.7253800d.svg)
Unlock your academic potential
Copyright © 2020–2026 A2Z Services. All Rights Reserved. Developed and managed by ZUCOL.