Business Economics Report: China and Australia Economic Analysis
VerifiedAdded on 2022/09/16
|13
|2685
|16
Report
AI Summary
This report provides a comparative analysis of the economic growth and living standards in China and Australia. It begins with an introduction to economic growth and then delves into the GDP growth rates of both countries, highlighting key economic indicators such as GDP, unemployment rates, and the Human Development Index. The report explores social and economic welfare in each nation, comparing factors like poverty rates and purchasing power parity. It examines living standards, including consumer prices and disposable income. The analysis further discusses the contribution of living standards and economic growth to the overall economy, considering factors such as aggregate demand and supply. The report concludes with recommendations for improving economic performance in both China and Australia, emphasizing the importance of factors such as innovation, public spending, and infrastructure development. The report references various sources to support its findings and analysis.

BUSINESS ECONOMICS
Paraphrase This Document
Need a fresh take? Get an instant paraphrase of this document with our AI Paraphraser
Contents
Introduction...........................................................................................................................................3
GDP growth rate of China and Australia...............................................................................................3
Social and economic welfare.................................................................................................................5
Comparison of living standard and economic growth in China and Australia.......................................6
Contribution of living standard and economic growth on economy......................................................8
Conclusion and recommendation...........................................................................................................9
References...........................................................................................................................................11
Introduction
Economic growth is well-defined as upsurge in productive ability of country, which means
increase in national income and output. The essay brings out a discussion and analysis on
economic trend of China and Australia. The essay elaborates the performance of China and
Australia in terms of economic growth and living standards. It has been extended to living
standards of people living in China and Australia and relating it to the economic growth. The
essay will use economic indicators to analyse the economic conditions such as unemployment
rate, GDP, human development index, disposable income and inflation rate. The essay will
undertake in-depth analysis of both the nations by showing the implications of living
standards and economic growth.
Currently, China is one of the fastest growing economy with the growth rate of 6 percent for
the last six years. In 2019, China`s GDP (Gross domestic product) was estimated at $14.3
trillion. Australia is the world`s 14th biggest economy with the GDP growth rate of 2.7
percent. Australia has been featured by diverse technology and services with low government
debt. Nominal GDP is $1.5 trillion in 2019 and it has entered amongst uninterrupted annual
growth in the economy (Australian Trade and Investment Commission, 2019).
GDP growth rate of China and Australia
GDP measures the country`s economic activity, which should not consider measure of
nation`s wellbeing. It is necessary to remain aware of how GDP components can lead
towards economic growth (Numeo, 2019). Australia has been continuously enjoying high
performance same as the developed economies after the boom of mining sector since 2000s.
Australia is the 14th largest economy and the nation has grown healthy pace by maintaining
low unemployment level, robust exports, low public debt, stable financial system, and strong
service industry (ADB, Furceri, and IMF, 2016). As far as different sectors are concerned,
⊘ This is a preview!⊘
Do you want full access?
Subscribe today to unlock all pages.
Trusted by 1+ million students worldwide
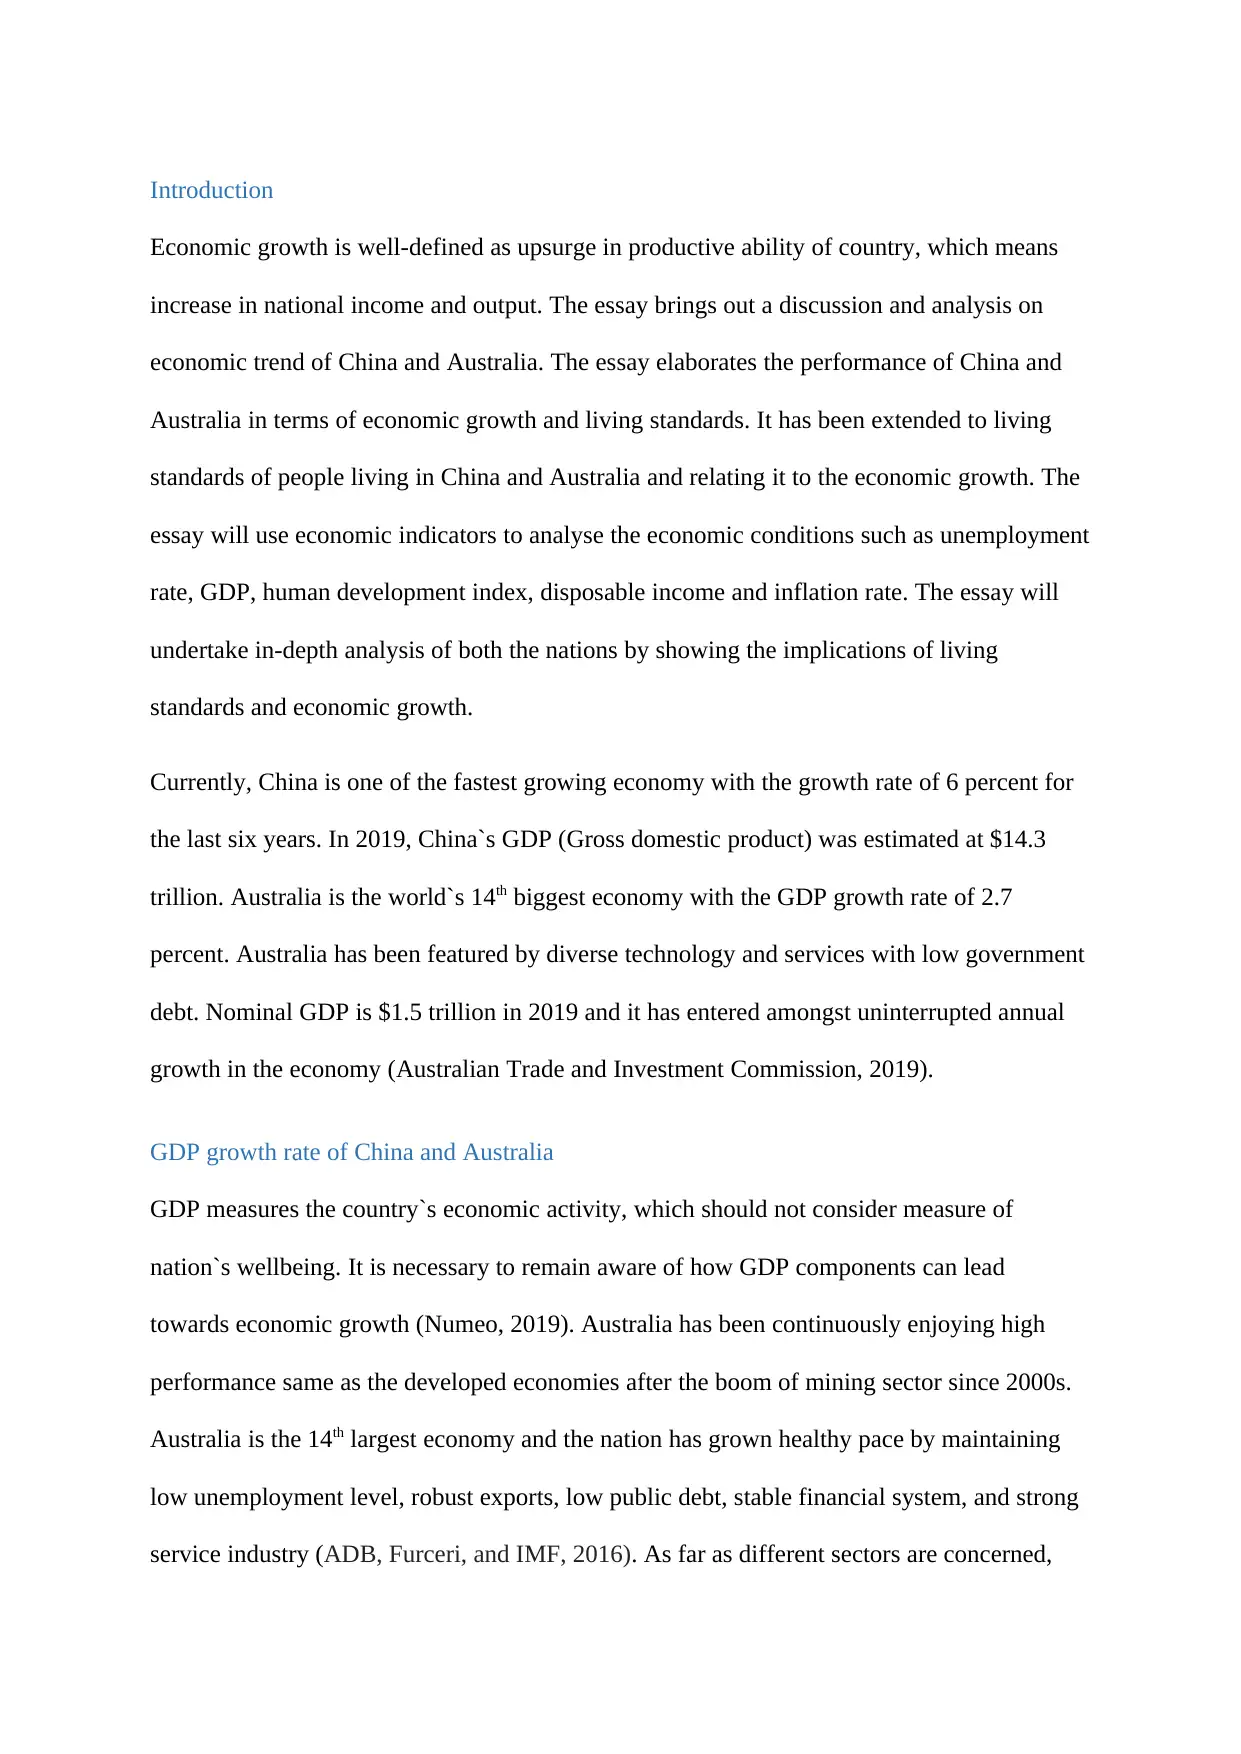
agriculture, industry, contributes to four to 26 percent. Australia has been expecting annual
GDP development of 2.7 percent from 2019 to 2023 (Australian Trade and Investment
Commission, 2019). The economy maintains robustness as sustained by the social
frameworks, attractive investment, and deep trade relationship with Asian region.
(Source: Australian Trade and Investment Commission, 2019)
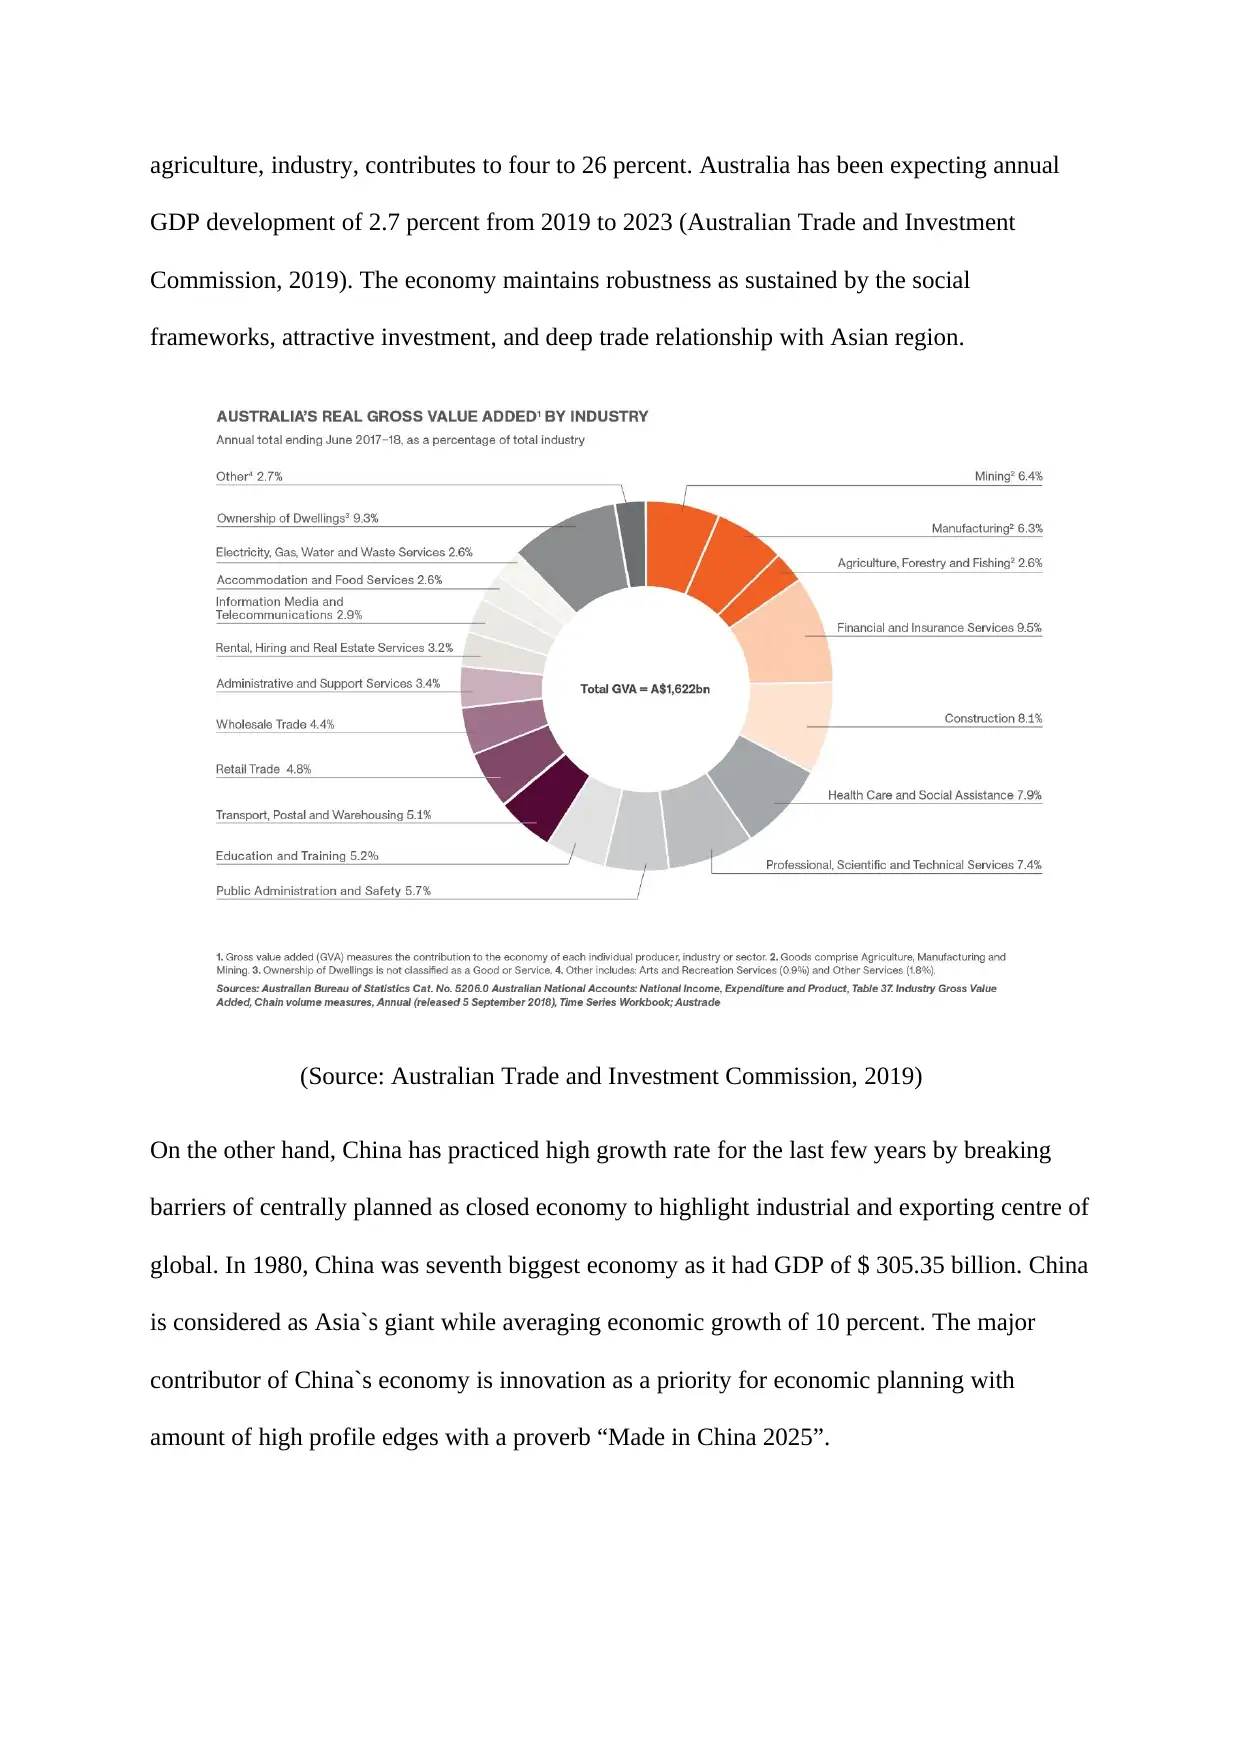
On the other hand, China has practiced high growth rate for the last few years by breaking
barriers of centrally planned as closed economy to highlight industrial and exporting centre of
global. In 1980, China was seventh biggest economy as it had GDP of $ 305.35 billion. China
is considered as Asia`s giant while averaging economic growth of 10 percent. The major
contributor of China`s economy is innovation as a priority for economic planning with
amount of high profile edges with a proverb “Made in China 2025”.
GDP development of 2.7 percent from 2019 to 2023 (Australian Trade and Investment
Commission, 2019). The economy maintains robustness as sustained by the social
frameworks, attractive investment, and deep trade relationship with Asian region.
(Source: Australian Trade and Investment Commission, 2019)
On the other hand, China has practiced high growth rate for the last few years by breaking
barriers of centrally planned as closed economy to highlight industrial and exporting centre of
global. In 1980, China was seventh biggest economy as it had GDP of $ 305.35 billion. China
is considered as Asia`s giant while averaging economic growth of 10 percent. The major
contributor of China`s economy is innovation as a priority for economic planning with
amount of high profile edges with a proverb “Made in China 2025”.
Paraphrase This Document
Need a fresh take? Get an instant paraphrase of this document with our AI Paraphraser
(Source: Huimin, 2018)
Social and economic welfare
Social development index processes the extent to which nations can avail social and
environmental need of citizens. The index combines three dimensions such as basic human
needs, fundamentals of wellbeing and chance. Australia has been ranked at 12th in social
progress index with score of 88.02 (The borgan project, 2018). The index for China is 154.
Human development index is the statistic-combined index for education, expectancy, and per
capital income that is used to rank nations into four tiers of the human development. China`s
HDI value for 2018 is estimated at 0.758, which shows that nation in high human
development strategy positioning 85 out of 189 nations. In the last few years, value has
increased from .501 to .758 from 1990 to 2018. For Australia, HDI value for 2018, it is
estimated at 0.938, which has increased by 8.3 percent. Amongst both the nations, Australia
has high HDI because of income, opportunities, high living standard, supported by the
HealthCare and superannuation programs (The borgan project, 2018).
Unemployment rate for Australia is estimated at 6.05 percent in 2015, 5.7 percent in 2016,
5.58 percent in 2017, and 5.29 percent in 2018 (Xin, 2019). The reason of increasing
unemployment rate is increasing number of people looking for work with highest labour
force participation rising to 66.2 percent (Trading economics, 2019). In 2018, the
unemployment rate in China is nearly 3.8 percent, which remain stable until 2024. The reason
of increasing unemployment rate is 4.07 percent from 2002 to 2019 (Trading economics,
2019).
Currently, it has been seen that population living below poverty line has been increasing in
Australia with the estimation 2.9 million individuals and nearly 13.3 percent of person live
underneath poverty line in internationally accepted poverty line (Gumata, and Ndou, 2019).
Poverty line in China shows that number of people living in China as per the national poverty
line is estimated at 16.6 million, which is nearly 1.7 percent of total population to eradicate
poverty by the end of 2020 (Gumata, and Ndou, 2019).
Comparison of living standard and economic growth in China and Australia
The china has planned to modernise china`s industrial for 10 main sectors with widespread
government support. This measure has increased concerns where China intends to use
industrial policy so that it can decrease nation`s reliance on technology. Living standard
shows the level of spending by the customers in the market (Gumata, and Ndou, 2019).
Standard living will be restrained by the (PPP) purchasing power parity that is a standardised
amount of income level differentiating between nations by eliminating difference at price
levels. While undertaking the analysis of indices, it is seen that the living standards of
Australia is more than China. Groceries prices, local purchasing power restaurant prices, rent
prices and consumer prices in Australia are much more while comparing it to China (Khan et
al., 2018).
⊘ This is a preview!⊘
Do you want full access?
Subscribe today to unlock all pages.
Trusted by 1+ million students worldwide
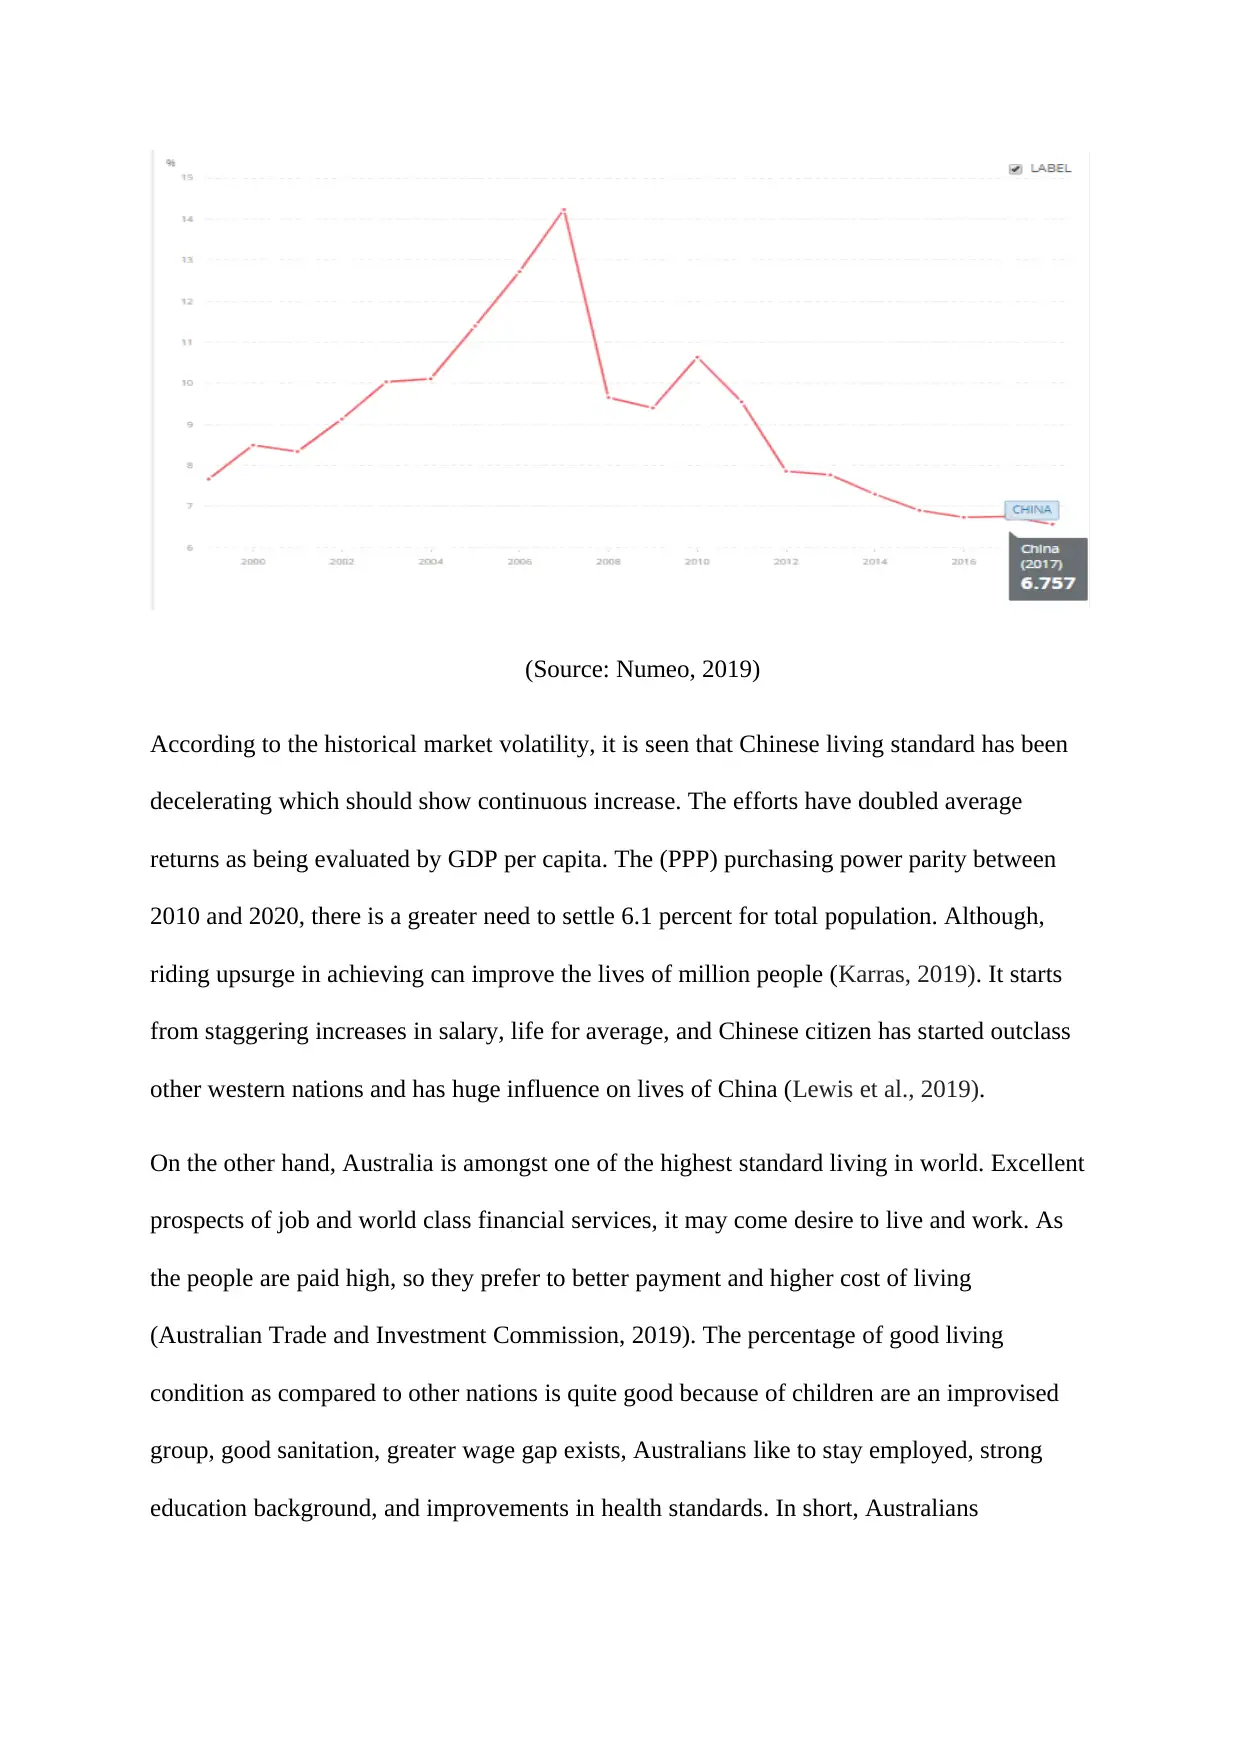
(Source: Numeo, 2019)
According to the historical market volatility, it is seen that Chinese living standard has been
decelerating which should show continuous increase. The efforts have doubled average
returns as being evaluated by GDP per capita. The (PPP) purchasing power parity between
2010 and 2020, there is a greater need to settle 6.1 percent for total population. Although,
riding upsurge in achieving can improve the lives of million people (Karras, 2019). It starts
from staggering increases in salary, life for average, and Chinese citizen has started outclass
other western nations and has huge influence on lives of China (Lewis et al., 2019).
On the other hand, Australia is amongst one of the highest standard living in world. Excellent
prospects of job and world class financial services, it may come desire to live and work. As
the people are paid high, so they prefer to better payment and higher cost of living
(Australian Trade and Investment Commission, 2019). The percentage of good living
condition as compared to other nations is quite good because of children are an improvised
group, good sanitation, greater wage gap exists, Australians like to stay employed, strong
education background, and improvements in health standards. In short, Australians
Paraphrase This Document
Need a fresh take? Get an instant paraphrase of this document with our AI Paraphraser
continuously on making rich people richer, which will increase income inequality (Huimin,
2018).
Contribution of living standard and economic growth on economy
China and Australia have sustainably improved their living of standard where the
consumption of goods can avail more revenues. Improved services related to public services
can increase the life style of the people, where high standard contributes to economic growth.
While evaluating the contribution towards the living standard and economic development.
With tremendous growth rate in Australia has improved living standards (Trading economics,
2019). Australia indicates that it is a desirable nation, which focuses to eradicate poverty,
which finally contribute to overall economic growth level of nation. Moreover, there is a
huge gap between Australians as six poor Australians are equal to middle class Australian
(Huimin, 2018). For 2018, purchasing power for parity as Australians is equal to 1.4 LCU
international dollars. It is expected that PPP will definitely reach 46400 USD. GDP of
economy and purchasing power parity has direct relationship where employment level can
have high impact on purchasing power of customers (Xin, 2019). Per capita Gross domestic
product as bring calculated by dividing GDP to total population. Purchasing power is an
increase or decrease in the consumer buying. When consumer lose purchasing power when
the price increases so as reverse or visa-versa (Gymnastiar, 2017).
On the other hand, within the volatile market, it is seen that administration overshadows
china`s economy and World`s economy (Xin, 2019). In 2019, the country has realised that it
will come up with greatest international uncertainties with more market volatility. The
Chinese government has ignored the commitment to eradicate poverty, sustainability, and
higher living standards. China was able to achieve more economic growth but it started
focusing on improving the standard of living of people (Gumata, and Ndou, 2019). Although,
it has faced deceleration and this resulted in increasing living standard can continue to
improve. The government has been introducing supportive fiscal policies as a tool to ensure
that they have stable growth where fixed investment is expected to play an important role
when export growth and consumption are stagnant (The balance, 2019). Once overall
purchasing power of parity has been increased, then it will enable and improve the overall
performance of the nation. China`s potential growth rate can indicate that growth rate will
definitely manage the increasing inflation so as the GDP. Furthermore, it is important to
understand that GDP is not the only economic indicator, which measure economic
performance, which is resolute by market values of services and goods. It will comprise
dynamic actions does not opt for any market deal (The balance, 2019).
Conclusion and recommendation
From the above discussion, it can be seen that China has been striving hard to improve the
living standard of people. Whereas, the living standard maintained in Australia indicates the
gap between poor and rich people. GDP does not consider factors such as spreading of
income, and output donates to people`s worth of life. GDP, industrial production, and the
literacy rate amongst the population can improve the GDP, poverty line, and unemployment
rate (Karras, 2019). The nation has to improve its GDP by increasing its industry base and
employing more people so that disposable income of the people can be increased so finally
the circulation of goods and services can generate value and money. Two core aspects of
economic growth include aggregate demand and aggregate supply, which will increase the
consumer spending, investments from customers through saving. Furthermore, China has
been trying in minimising the gap between the populations so that living standard can be
overall (Ács, Szerb, and Autio, 2016). On the other hand, Australians has tried to maximise
the disposable income, which has indirectly widened the gap between poor and rich.
Enhancing aggregate supply will demand development of new technologies, internet, AI, and
block chain and help to enhance productivity in this era. Furthermore, there can be
⊘ This is a preview!⊘
Do you want full access?
Subscribe today to unlock all pages.
Trusted by 1+ million students worldwide
introduction to new management techniques to improve skills and qualification finally
enhancing the job employment. Public spending, sector investment, and improved
infrastructure on education can lead to enhance the economic growth of China as well as
Australia. China has already attained a image of 5th largest economy and it is far more active
in public sector work as compared to Australia.
Paraphrase This Document
Need a fresh take? Get an instant paraphrase of this document with our AI Paraphraser
References
Ács, Z.J., Szerb, L. and Autio, E., 2016. Global entrepreneurship and development index
2015 (p. 1). Springer.
ADB, A.A., Furceri, D. and IMF, P.T., 2016. The macroeconomic effects of public
investment: Evidence from advanced economies. Journal of Macroeconomics, 50, pp.224-
240.
Australian Trade and Investment Commission, 2019. Robust Economy. Available on:
https://www.austrade.gov.au/International/Invest/Why-Australia/robust-economy [Accessed
on: 11/04/2020]
Gumata, N. and Ndou, E., 2019. How Does Nominal GDP Growth Respond to Various
Shocks. In Accelerated Land Reform, Mining, Growth, Unemployment and Inequality in
South Africa (pp. 135-144). Palgrave Macmillan, Cham.
Gymnastiar, F., 2017. The Impact Of Eps, Federal Funds Rate, Previous Federal Funds Rate
Inflation Rate, Unemployment Rate, And Real Gdp Toward Lq45 And Russel Top 50 Market
Index (Doctoral dissertation, Universitas Brawijaya).
Huimin, Z., 2018. Historic changes in China's economic structure in past 40 years. Available
on: https://news.cgtn.com/news/3d3d674d77677a4d31457a6333566d54/share_p.html
Accessed on: 11/04/2020]
Karras, G., 2019. Macroeconomic Effects of Tax Changes: Evidence from a Sample of
OECD Countries. SPOUDAI-Journal of Economics and Business, 69(3), pp.111-138.
Khan, I., Ahmad, A., Khan, M.T. and Ilyas, M., 2018. The impact of GDP, inflation,
exchange rate, unemployment and tax rate on the non performing loans of banks: Evidence
from Pakistani commercial banks. Journal of Social Sciences and Humanities, 26(1).
Lewis, B., Veronica, C.M., Francis, N. and Isaac, A., 2019. Effects of Gross Domestic
Product and Inflation Rate on Unemployment Rate in Ghana: Comparative Analysis of
Multiple Regression and Covariance Matrix Models. American Journal of Applied
Mathematics, 7(1), pp.5-12.
Numeo, 2019. Cost of Living Comparison between China and Australia. Available on:
https://www.numbeo.com/cost-of-living/compare_countries_result.jsp?
country1=China&country2=Australia [Accessed on: 11/04/2020]
The balance, 2019. China's Economic Growth, Its Causes, Pros, Cons, and Future. Available
on: https://www.thebalance.com/china-s-economic-growth-cause-pros-cons-future-3305478
[Accessed on: 11/04/2020]
The borgan project, 2018. 7 FACTS ABOUT LIVING CONDITIONS IN AUSTRALIA.
Available on: https://borgenproject.org/7-facts-about-living-conditions-in-australia/
[Accessed on: 11/04/2020]
Trading economics, 2019. China Unemployment Rate. Available on:
https://tradingeconomics.com/china/unemployment-rate [Accessed on: 11/04/2020]
Xin, Z., 2019. China’s GDP growth last year was worth more than Australia’s whole
economy. Available on:
https://www.scmp.com/economy/china-economy/article/2188404/china-says-last-years-gdp-
growth-was-worth-more-australias [Accessed on: 11/04/2020]
⊘ This is a preview!⊘
Do you want full access?
Subscribe today to unlock all pages.
Trusted by 1+ million students worldwide
1 out of 13
Related Documents


Your All-in-One AI-Powered Toolkit for Academic Success.
+13062052269
info@desklib.com
Available 24*7 on WhatsApp / Email
![[object Object]](/_next/static/media/star-bottom.7253800d.svg)
Unlock your academic potential
Copyright © 2020–2026 A2Z Services. All Rights Reserved. Developed and managed by ZUCOL.