Comparative Economic Analysis: New Zealand vs. Australia's Economies
VerifiedAdded on 2020/03/04
|6
|1027
|39
Homework Assignment
AI Summary
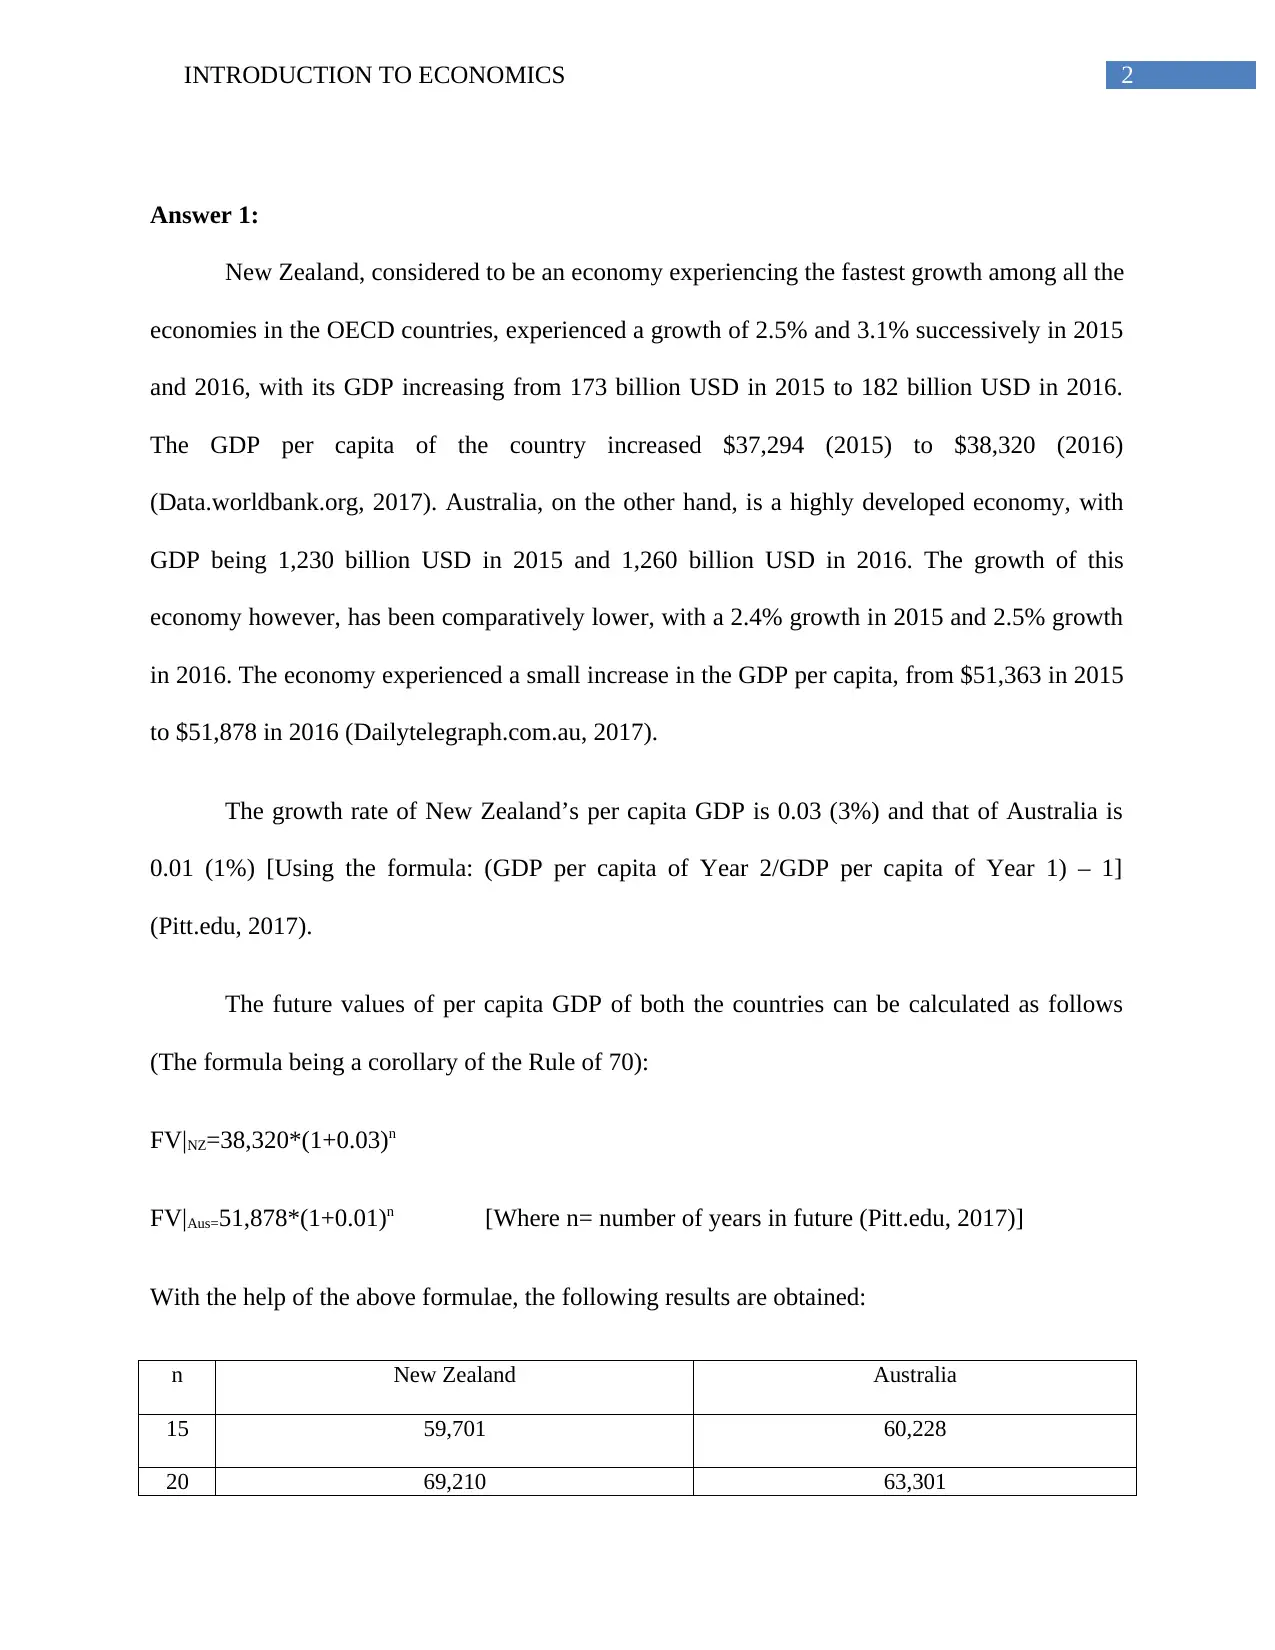
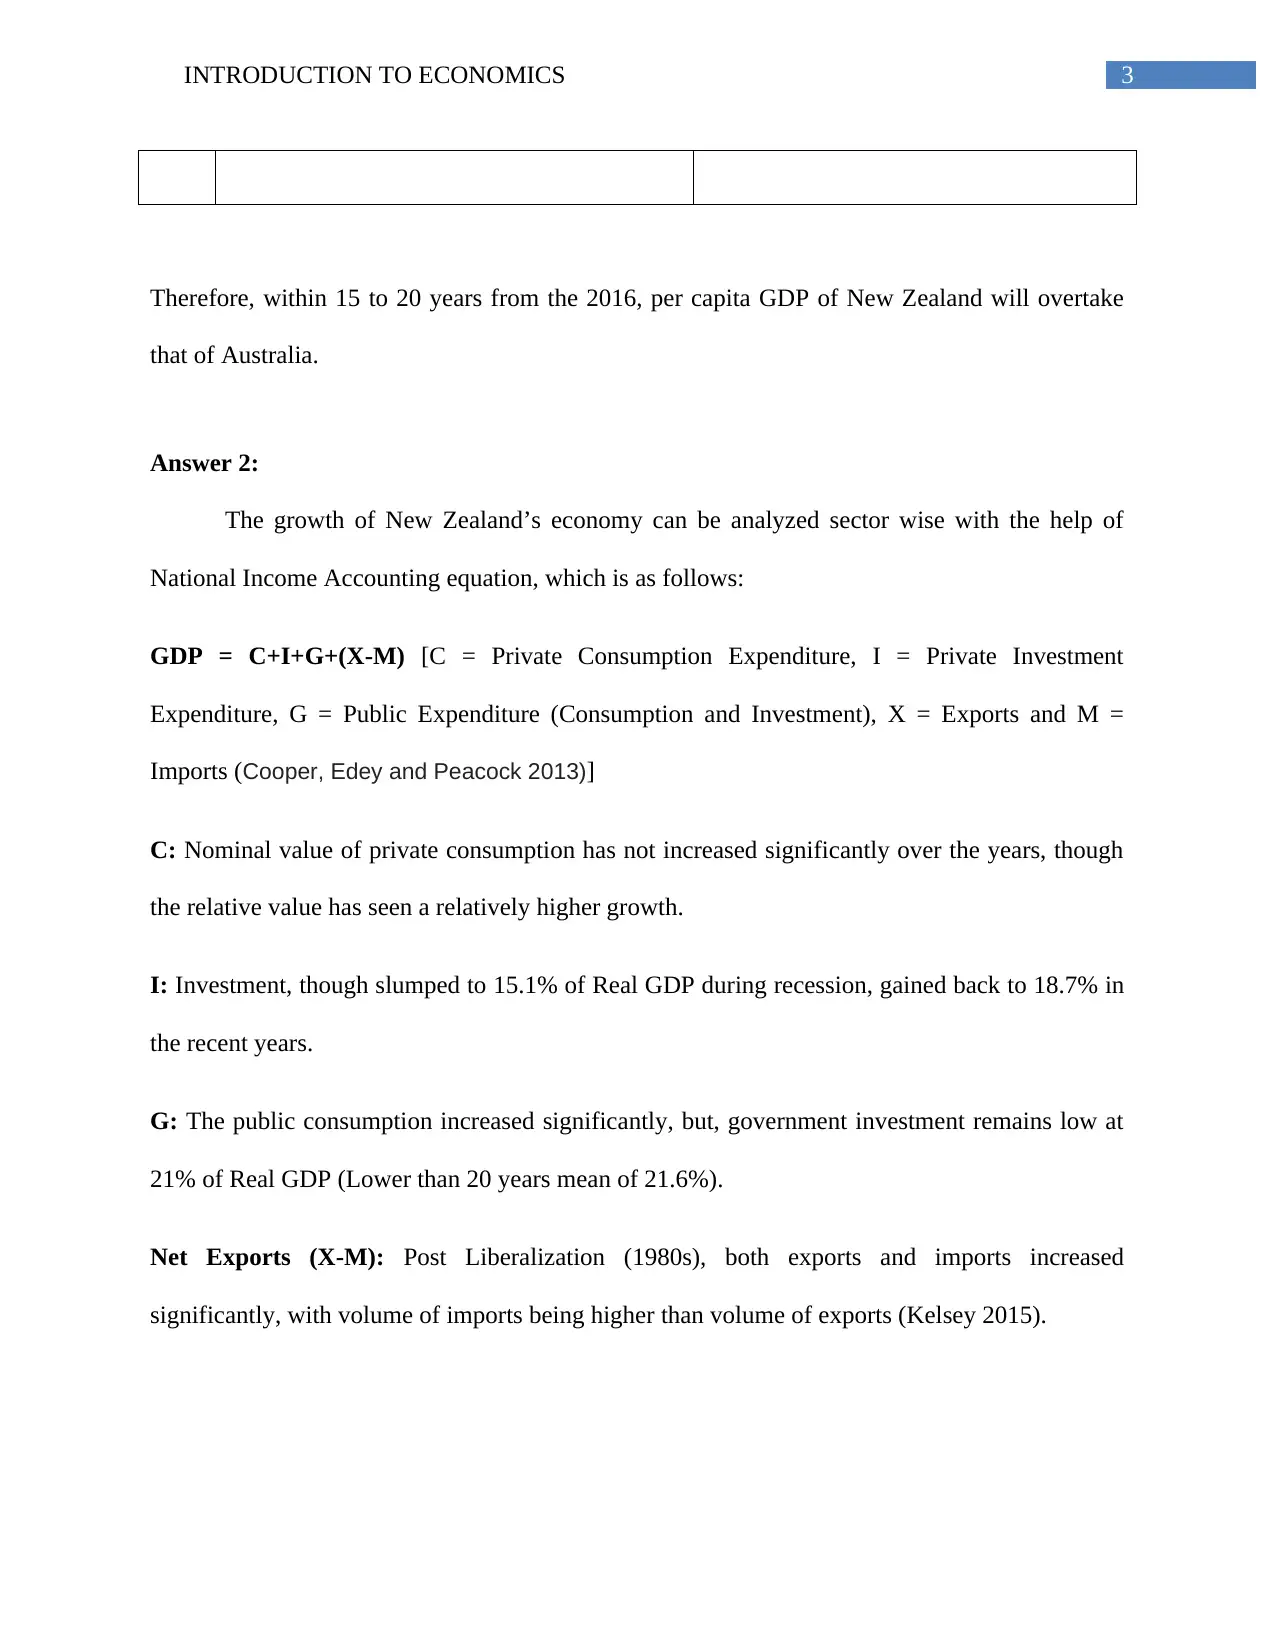
This economics assignment provides a comparative analysis of the economies of New Zealand and Australia. The assignment begins by comparing the GDP and GDP per capita of both countries, highlighting growth rates and future projections. It then delves into sector-specific economic factors in New Zealand, utilizing the National Income Accounting equation to analyze private consumption, investment, public expenditure, and net exports. The study further examines the Closer Economic Relations agreement between the two countries and its impact on international market shares. Finally, it explores the effects of the mining boom in Australia, discussing its influence on the country's GDP and standard of living, as well as the subsequent challenges faced due to fluctuating commodity prices and investment concentration. The assignment draws on various sources to support its findings, offering a comprehensive overview of the economic landscapes of New Zealand and Australia.

Running head: INTRODUCTION TO ECONOMICS
Introduction to Economics
Name of the Student
Name of the University
Author Note
Introduction to Economics
Name of the Student
Name of the University
Author Note
Paraphrase This Document
Need a fresh take? Get an instant paraphrase of this document with our AI Paraphraser

1INTRODUCTION TO ECONOMICS
Table of Contents
Answer 1:.........................................................................................................................................2
Answer 2:.........................................................................................................................................3
Answer 3:.........................................................................................................................................4
Answer 4:.........................................................................................................................................4
References:......................................................................................................................................5

2INTRODUCTION TO ECONOMICS
Answer 1:
New Zealand, considered to be an economy experiencing the fastest growth among all the
economies in the OECD countries, experienced a growth of 2.5% and 3.1% successively in 2015
and 2016, with its GDP increasing from 173 billion USD in 2015 to 182 billion USD in 2016.
The GDP per capita of the country increased $37,294 (2015) to $38,320 (2016)
(Data.worldbank.org, 2017). Australia, on the other hand, is a highly developed economy, with
GDP being 1,230 billion USD in 2015 and 1,260 billion USD in 2016. The growth of this
economy however, has been comparatively lower, with a 2.4% growth in 2015 and 2.5% growth
in 2016. The economy experienced a small increase in the GDP per capita, from $51,363 in 2015
to $51,878 in 2016 (Dailytelegraph.com.au, 2017).
The growth rate of New Zealand’s per capita GDP is 0.03 (3%) and that of Australia is
0.01 (1%) [Using the formula: (GDP per capita of Year 2/GDP per capita of Year 1) – 1]
(Pitt.edu, 2017).
The future values of per capita GDP of both the countries can be calculated as follows
(The formula being a corollary of the Rule of 70):
FV|NZ=38,320*(1+0.03)n
FV|Aus=51,878*(1+0.01)n [Where n= number of years in future (Pitt.edu, 2017)]
With the help of the above formulae, the following results are obtained:
n New Zealand Australia
15 59,701 60,228
20 69,210 63,301
⊘ This is a preview!⊘
Do you want full access?
Subscribe today to unlock all pages.

Trusted by 1+ million students worldwide

3INTRODUCTION TO ECONOMICS
Therefore, within 15 to 20 years from the 2016, per capita GDP of New Zealand will overtake
that of Australia.
Answer 2:
The growth of New Zealand’s economy can be analyzed sector wise with the help of
National Income Accounting equation, which is as follows:
GDP = C+I+G+(X-M) [C = Private Consumption Expenditure, I = Private Investment
Expenditure, G = Public Expenditure (Consumption and Investment), X = Exports and M =
Imports (Cooper, Edey and Peacock 2013)]
C: Nominal value of private consumption has not increased significantly over the years, though
the relative value has seen a relatively higher growth.
I: Investment, though slumped to 15.1% of Real GDP during recession, gained back to 18.7% in
the recent years.
G: The public consumption increased significantly, but, government investment remains low at
21% of Real GDP (Lower than 20 years mean of 21.6%).
Net Exports (X-M): Post Liberalization (1980s), both exports and imports increased
significantly, with volume of imports being higher than volume of exports (Kelsey 2015).
Paraphrase This Document
Need a fresh take? Get an instant paraphrase of this document with our AI Paraphraser

4INTRODUCTION TO ECONOMICS
Answer 3:
The Closer Economic Relations, which came in force in 1983, was mutual agreement of
free trade between New Zealand and Australia. The elimination of tariffs and quantity
restrictions between two countries were among the main policies designed under this agreement.
This agreement succeeded immensely in increasing the international market shares of both the
countries (News.com.au, 2017). Both of them experienced an 8 to 9 per cent mean growth. The
key objectives behind this thought were economic integration and symbiotic economic growth of
both countries, which were successfully achieved (Reinalda 2013).
Answer 4:
The mining boom started in Australia from 2003, with a huge increase in the global
demand and prices of the mining exports of Australia. The international price of these exports,
especially iron ores, saw more than three times increase over a decade, substantially increasing
Australia’s GDP as well as standard of living (News.com.au, 2017). This led to investment
shifting towards this sector (Investment increasing from 2% to 8% over that period). However,
the prices of iron ores saw a tremendous low in the recent period, leading to an immense
downsizing of the country’s budget, as major share of the country’s GDP depended on this
mining sector and over-emphasizing on mining led to thinner concentration of investment in the
other sectors of the economy (Downes, Hanslow and Tulip 2014).

5INTRODUCTION TO ECONOMICS
References:
Cooper, R., Edey, H.C. and Peacock, A.T., 2013. National income and social accounting.
Routledge.
Dailytelegraph.com.au (2017). The Kiwis are on our economic tails. [online]
Dailytelegraph.com.au. Available at:
http://www.dailytelegraph.com.au/business/jessica-irvine/new-zealand-is-kicking-australias-
economy/news- story/cdce93e5511f96f9b45a3406ddef4805 [Accessed 17 Aug. 2017].
Data.worldbank.org (2017). Countries | Data. [online] Data.worldbank.org. Available at:
http://data.worldbank.org/country/ [Accessed 16 Aug. 2017].
Downes, P.M., Hanslow, K. and Tulip, P., 2014. The effect of the mining boom on the
Australian economy.
Kelsey, J., 2015. Reclaiming the future: New Zealand and the global economy. Bridget Williams
Books.
News.com.au (2017). Three things that make New Zealand better than Australia. [online]
NewsComAu. Available at: http://www.news.com.au/finance/economy/three-things-that-make-
new-zealand-better/news-story/efb745fbae40c0dd14e444cdeb60b3fd [Accessed 16 Aug. 2017].
Pitt.edu (2017). Bernanke - Chap. 8 -- Economic Growth. [online] Pitt.edu. Available at:
http://www.pitt.edu/~mgahagan/Bern8.htm [Accessed 16 Aug. 2017].
Reinalda, B. ed., 2013. Routledge handbook of international organization. Routledge.
⊘ This is a preview!⊘
Do you want full access?
Subscribe today to unlock all pages.

Trusted by 1+ million students worldwide
1 out of 6
Related Documents
Your All-in-One AI-Powered Toolkit for Academic Success.
+13062052269
info@desklib.com
Available 24*7 on WhatsApp / Email
Unlock your academic potential
Copyright © 2020–2025 A2Z Services. All Rights Reserved. Developed and managed by ZUCOL.


