Comparative Financial Analysis of Next plc and H&M: A Finance Report

Verified

Added on  2020/02/05

|20
|3753
|51
Report
AI Summary
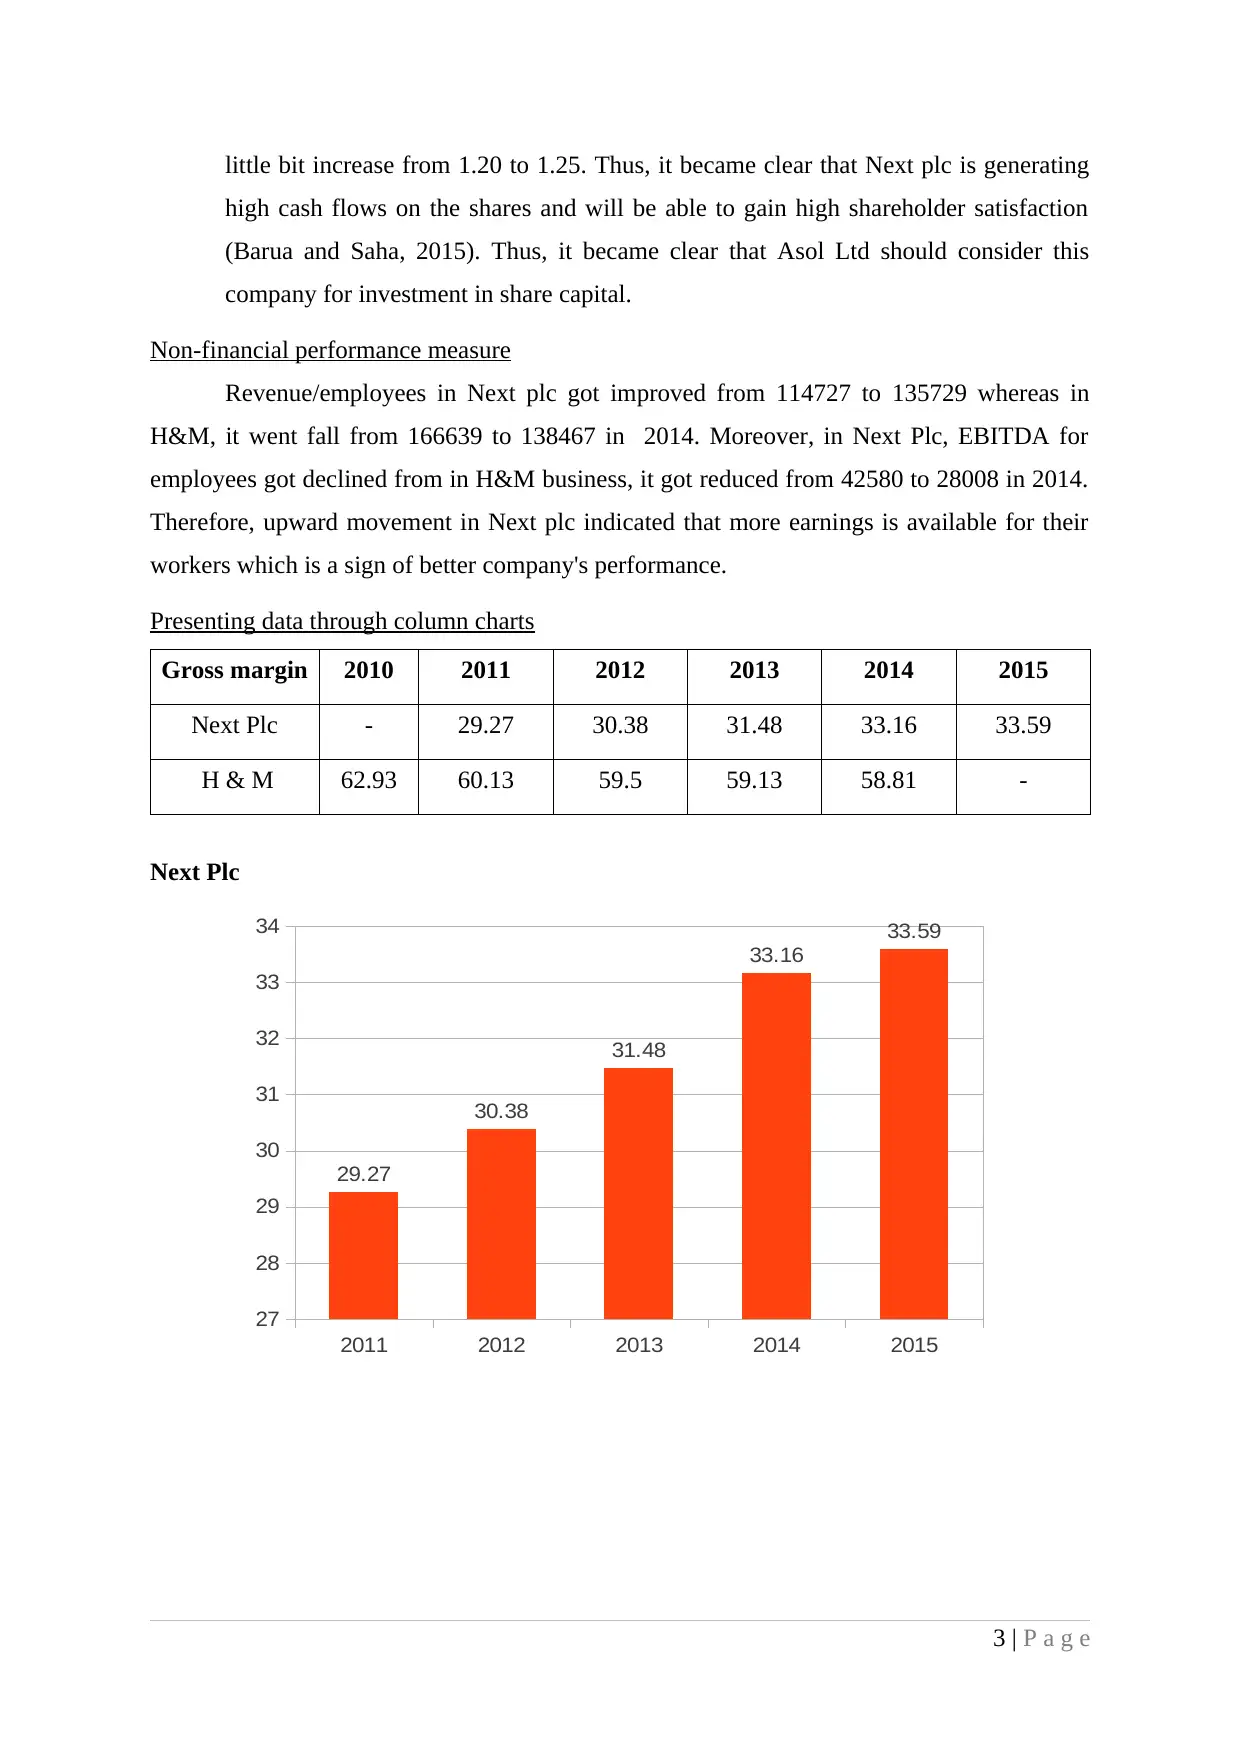
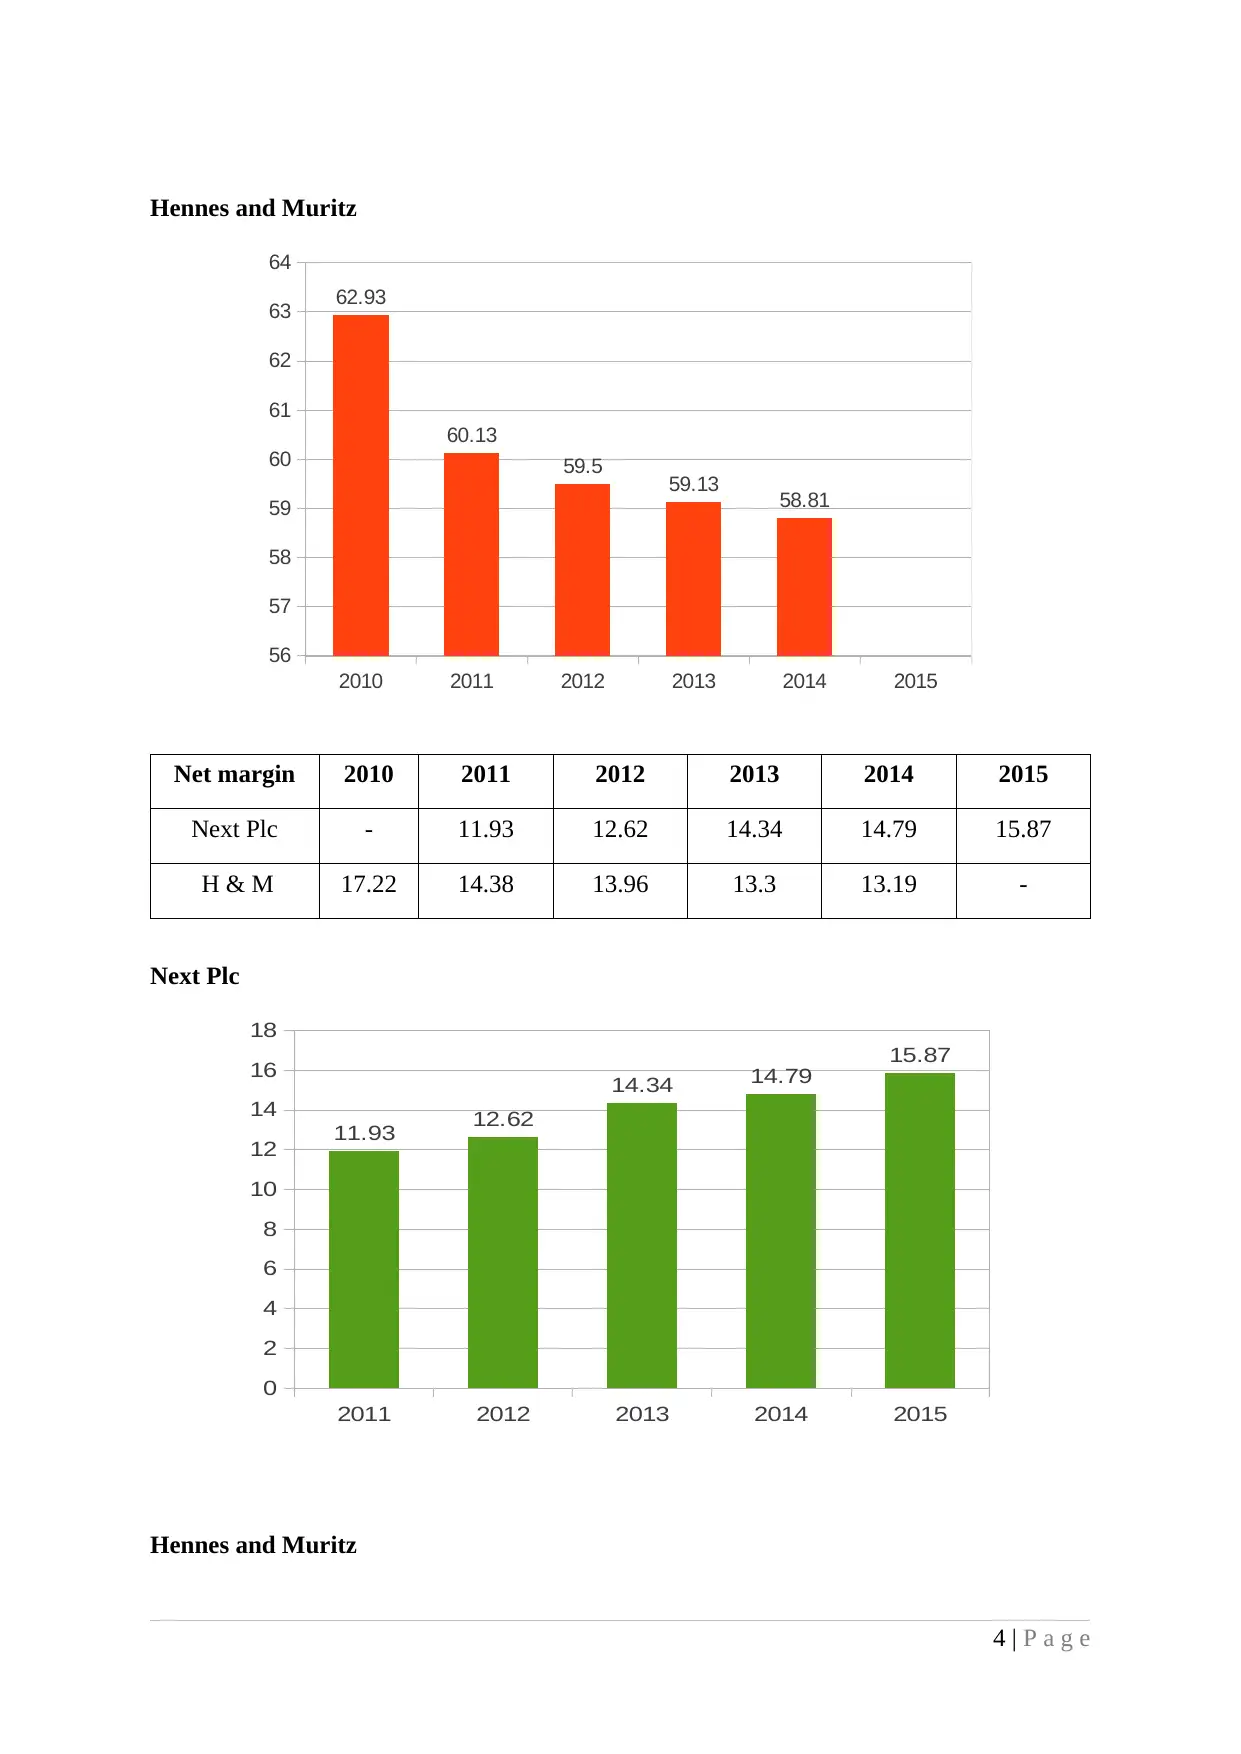
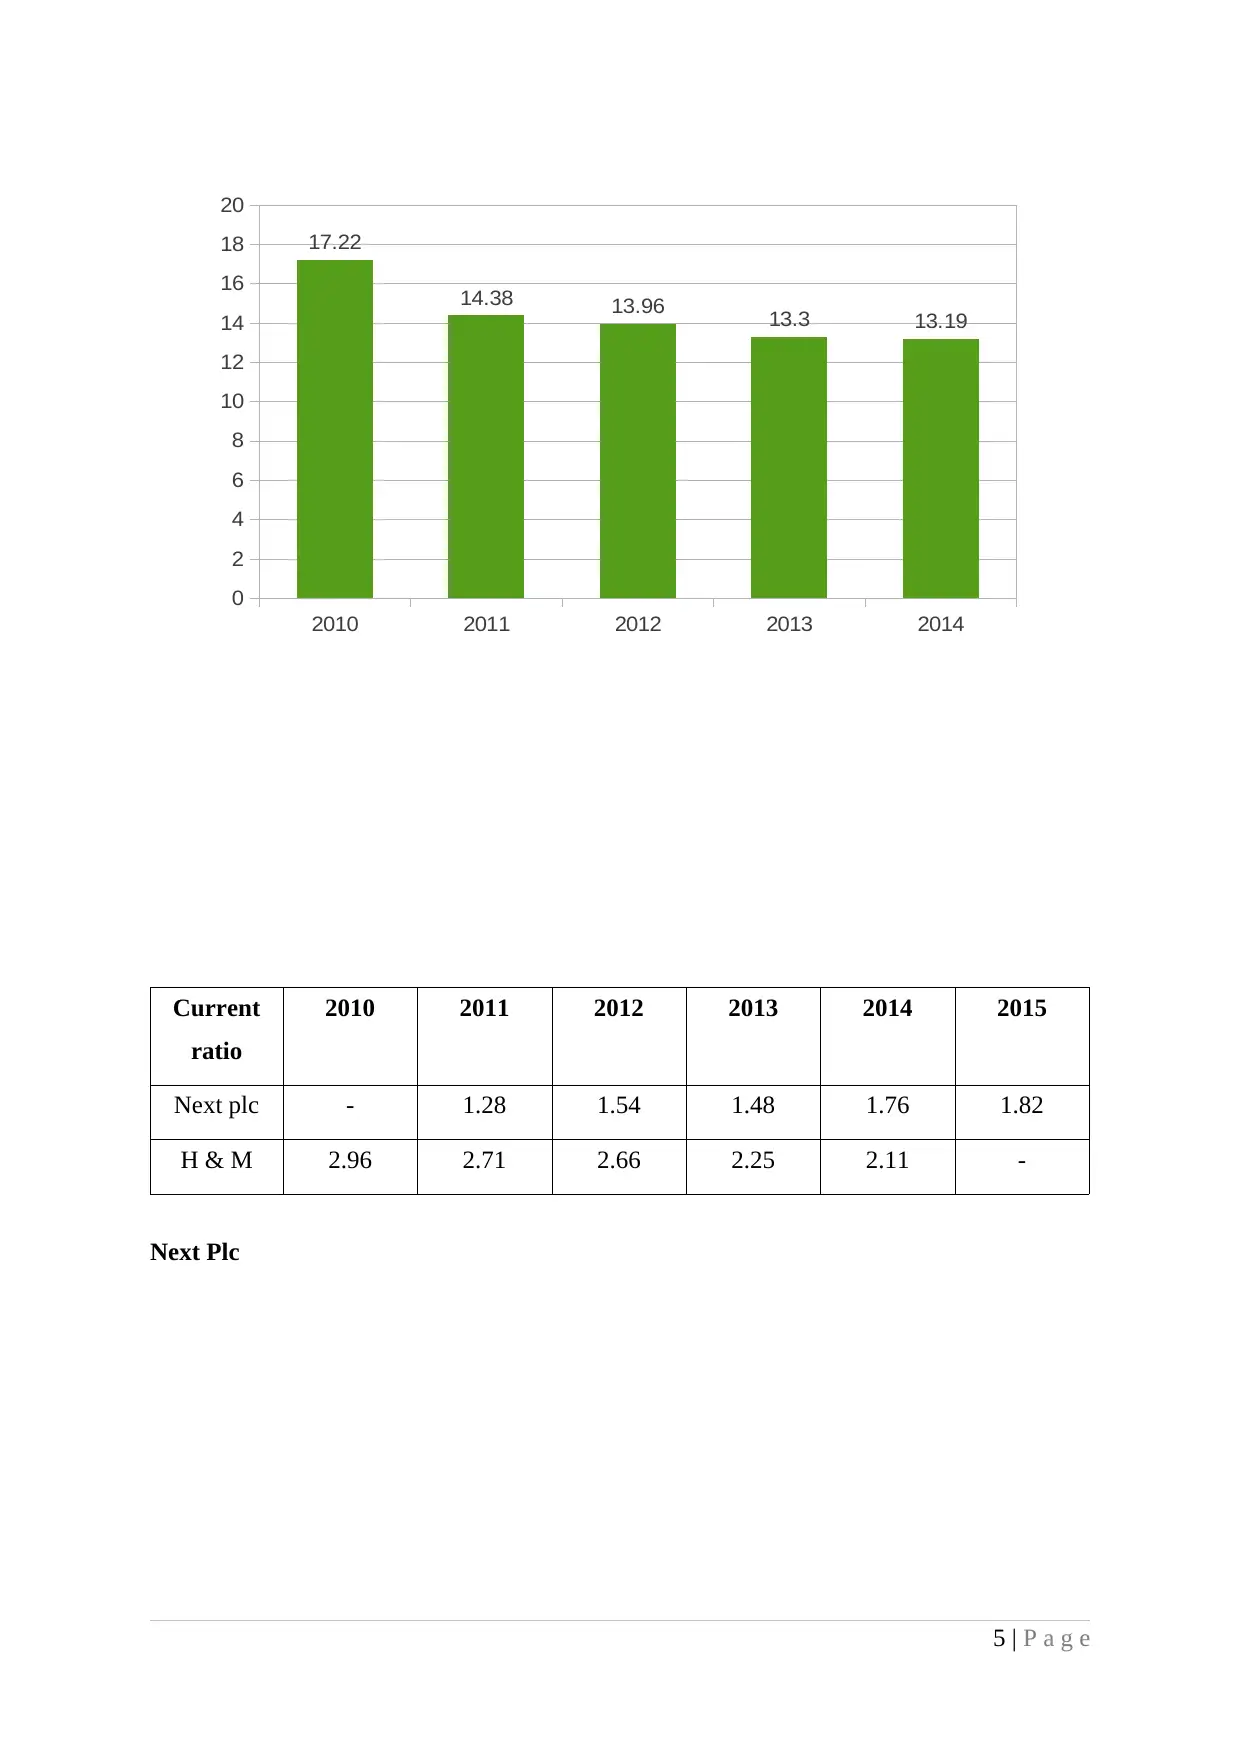
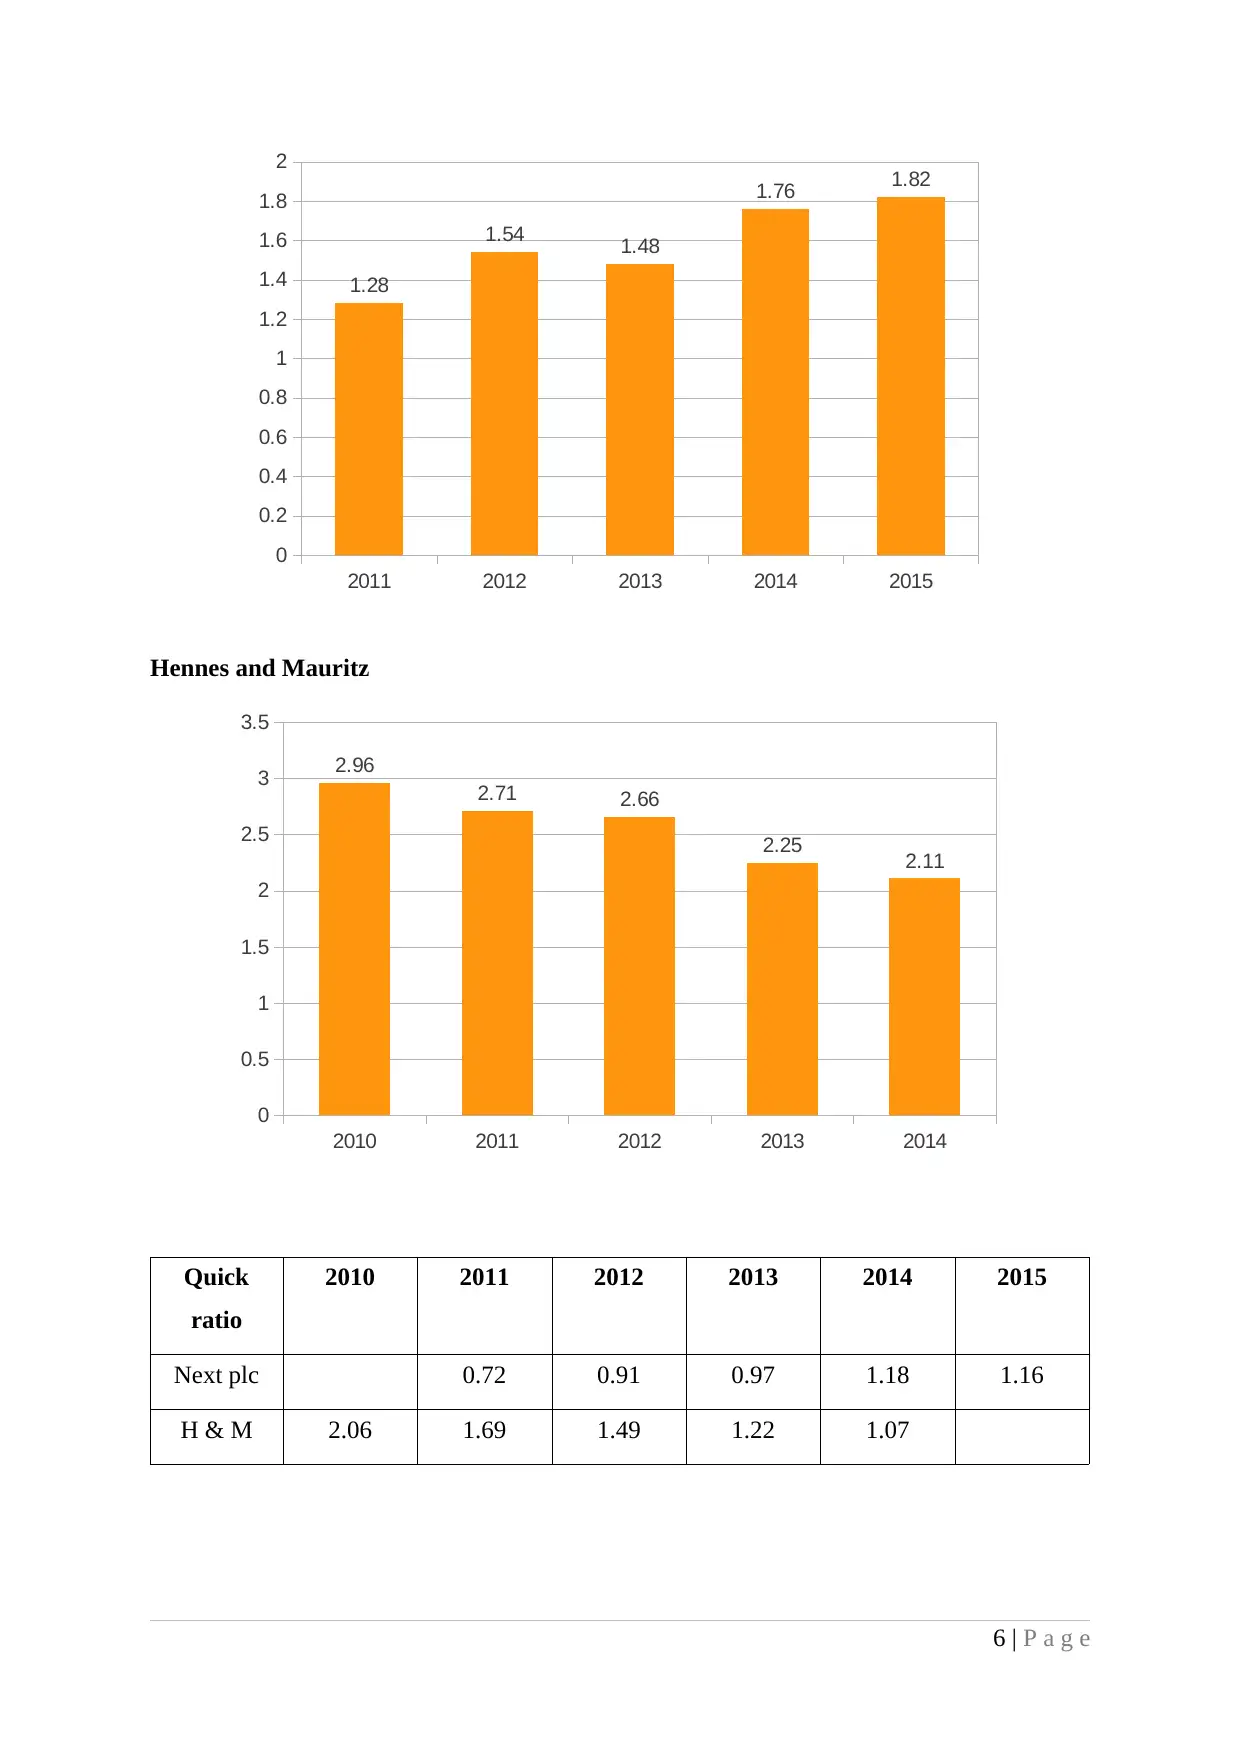
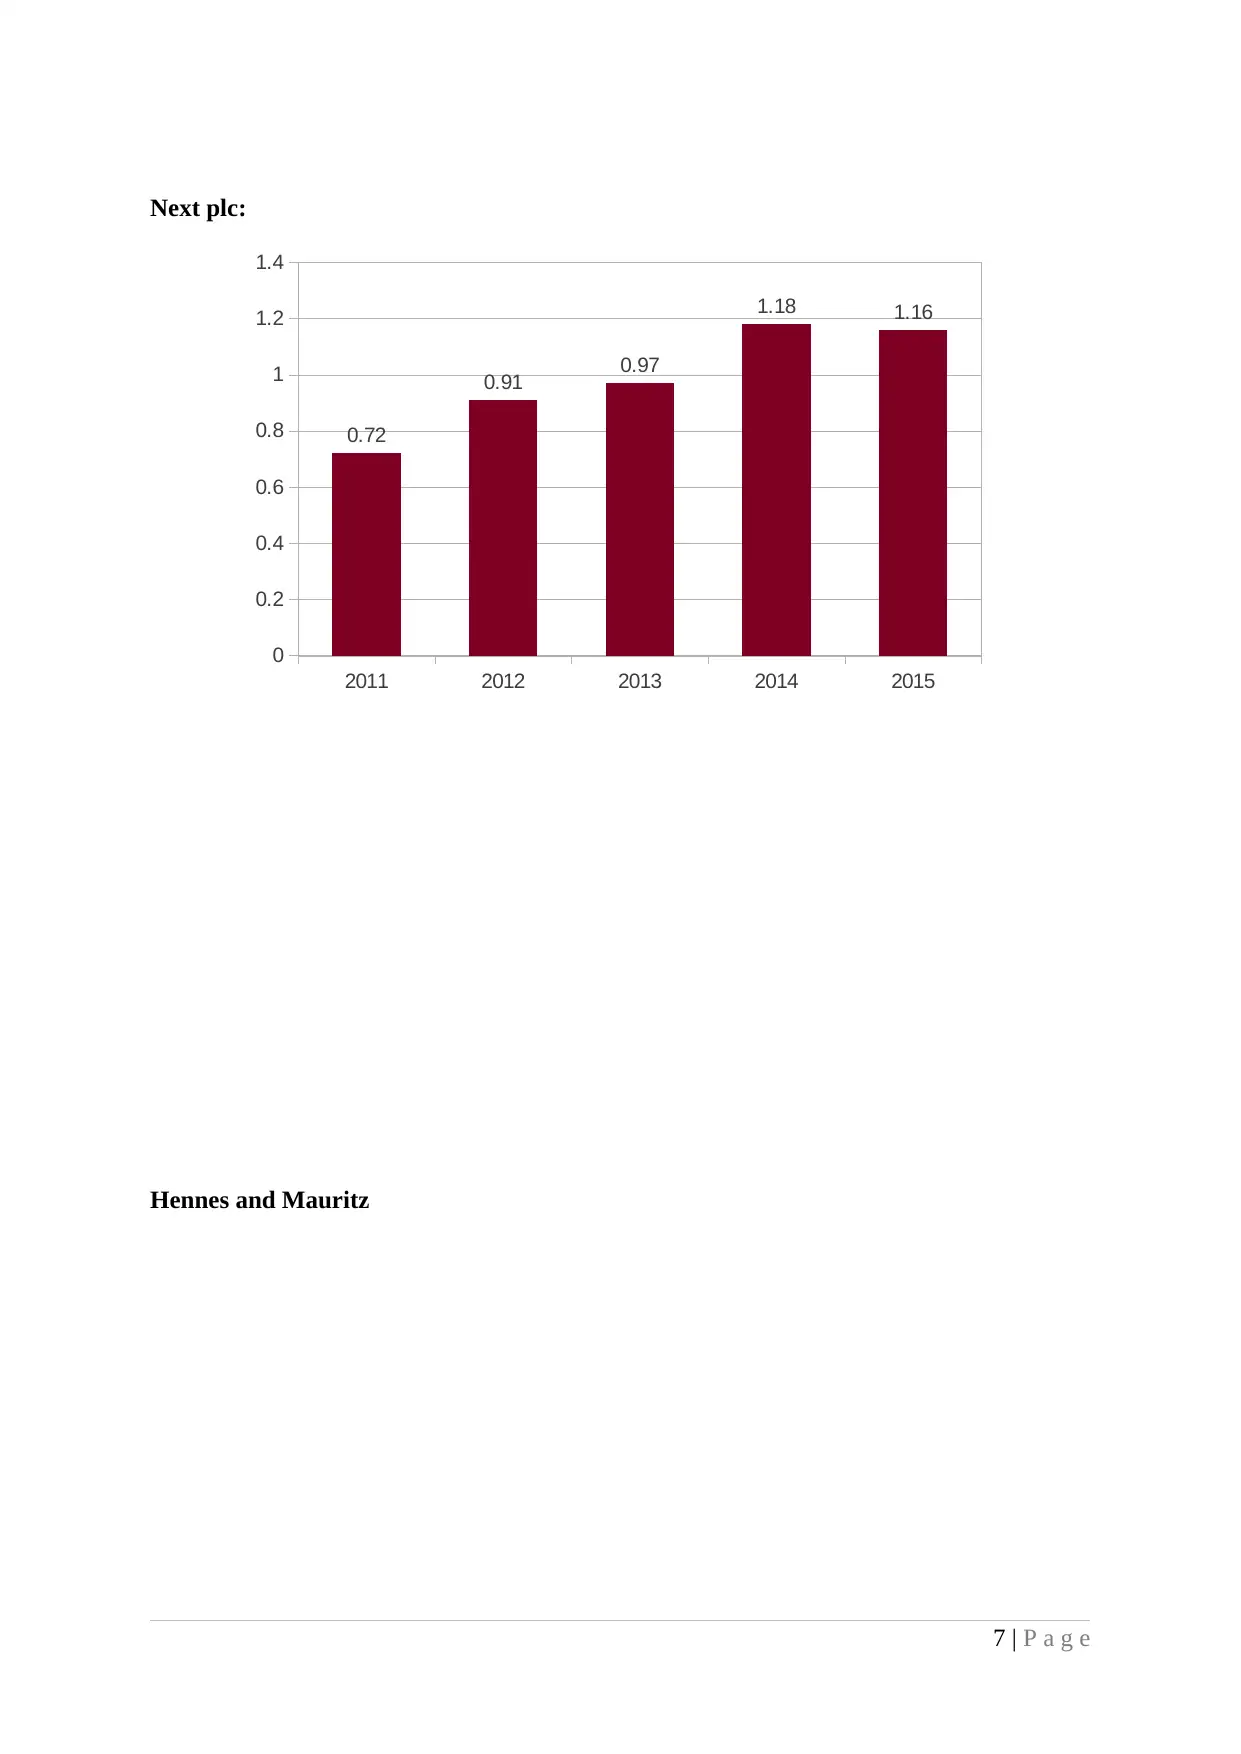
This report presents a comparative analysis of the financial and non-financial performance of Next plc and Hennes and Mauritz (H&M) to aid investment decisions. The analysis encompasses profitability ratios, management effectiveness, financial strength, efficiency ratios, and valuation ratios. The report recommends that Asol Ltd's CFO consider purchasing shares of Next plc based on its superior financial metrics. Furthermore, it uses capital budgeting techniques to evaluate investment opportunities for Hilltop Ltd. The report also discusses the limitations of financial ratios and provides recommendations for H&M to improve its operational performance, including enhancing profitability, strengthening financial status, and improving inventory turnover. The report concludes with a detailed discussion on the net cash flows, payback period, net present value (NPV), and accounting rate of return (ARR) for a potential investment project, along with a discussion of the limitations of investment appraisal techniques.
Document Page
ACCOUNTING AND
FINANCE
tabler-icon-diamond-filled.svg

Paraphrase This Document

Need a fresh take? Get an instant paraphrase of this document with our AI Paraphraser
Document Page
Table of Contents
INTRODUCTION......................................................................................................................1
Q.1. Comparative analysis..........................................................................................................1
Financial performance......................................................................................................1
Non-financial performance measure.................................................................................3
Presenting data through column charts.............................................................................3
Recommendation to Asol Ltd. CFO.................................................................................8
Recommendation to Hennes and Mauritz.........................................................................8
Limitation of financial ratios............................................................................................9
Q.2. Uses of Capital Investment Appraisal Techniques.............................................................9
2a................................................................................................................................................9
Net Cash Flows of the project.........................................................................................10
Payback period................................................................................................................11
Project NPV....................................................................................................................11
Project ARR....................................................................................................................12
2b..............................................................................................................................................12
Limitations of Investment appraisal techniques.............................................................12
CONCLUSION........................................................................................................................13
REFERENCES.........................................................................................................................14
..................................................................................................................................................16
Document Page
Document Page
tabler-icon-diamond-filled.svg

Paraphrase This Document

Need a fresh take? Get an instant paraphrase of this document with our AI Paraphraser
Document Page
INTRODUCTION
Next plc is a UK cloth, footwear and home products retailer company established in
the year 1864 and headquartered in Enderby, Leicestershire. Hennes and Mauritz, often
known as H & M is the world second largest cloth retailer organization which was found in
the year 1947 in Swedish. Both the organizations have worldwide presence and serve a large
customer base. Currently, Asol ltd being a large fashion retailing firm is choosing these two
well established companies for investing funds in the form of share capital. Henceforth,
comparative analysis of both the financial and non-financial performance will be done for
effective investment decisions. Along with this, capital budgeting tools will be used to assist
senior management of Hilltop Ltd for acquiring new machine for enhancing its total
production. In the present report, both the discounted and non-discounted cash flow methods
will be used for taking strategic decisions.
Q.1. COMPARATIVE ANALYSIS
Financial performance
ï‚· Profitability ratios: The surplus of total sales over the cost is called GM whilst the
excess of GM over total operating expenses is called NM. In 2011, GM of Next plc
was 29.27% while in H & M, it was 62.93% in year 2010, and thus, it was higher in H
& M business. However, in 2015, Next Plc GM went up by 33.59% whereas in H &
M, it got reduced to 58.81% in 2014. Thus, upward trend of Next plc business is a
good sign of its performance (Khan and Khokhar, 2015). Moreover, NM of Next Plc
turned out from 11.93% to 15.87% in 2015. On the contrary, H & M generated less
NM from 17.22% to 13.19%. Thus, it can be said that although H & M is a good
profit earning organization but still its declined trend is not good so there is a great
chance of lowering potential operational performance in the future period (Hosseini
and Mehregan, 2015). This in turn, it can be concluded that Next Plc will be more
suitable for share acquisition by Asol Ltd.
ï‚· Management effectiveness: Return on assets and return on equity measure the
manager’s efficiency to earn profits. In Next Plc, ROA has been increased from
22.55% to 28.68% whilst in H & M; it has been dropped from 32.91% to 28.28% in
2014. However, Next Plc ROE got reduced from 214.98% to 208.75% whereas in H
& M it has been declined from 44.07% to 41.27%. Thus, ROE in Next plc is
approximately 5 times higher than H & M. On the other hand, ROA is witnessing an
upward movement due to high profitability. Thus, it became clear that manger's
1 | P a g e
Document Page
effectiveness is good in Next Plc business which indicates that Asol Ltd's CFO should
purchase this company's shares (Sharma, Sharma and Arif, 2015).
ï‚· Financial strength: Current ratio and acid test ratio are the indicators of business
liquidity (Perinpanathan, 2015.). Next Plc CR shows an increasing trend as it got risen
from 1.28 to 1.82 in 2015 on contrary, in H &M, it prevails an declined from 2.96 to
2.11. Therefore, high WC is available in Next plc for doing its daily functions. In
2011, It was 234400 got improved to 729400 in 2015 whereas in H & M, it shows an
significantly decreases as it got reduced from 2472996 to 1915437 in 2014. Moreover,
QR in Next plc is 1.16 while in H & M it is 1.07 in 2014. Thus, it can be said that
Next Plc is managing its liquidity position and pay-off their short term obligations in
an effective manner (Ibrahim, 2015). However, declined trend in H & M business will
impact its operating functions adversely.
Moreover, debt equity ratio in Next Plc shows an little bit increases from 2.57 to 2.61.
However, in H&M, debt/equity ratio is nil because it is funding itself through using
only the equity capital. Debt funds is unavailable in the firm hence, it will affect
organization in an adverse manner because business will not be able to take the
advantageous of trading on equity (Lewis and Tan, 2016). Furthermore, excessive use
of equity capital will diversify its control in the hand of shareholders so that it can be
said that capital structure is well designed in Next Plc.
ï‚· Efficiency ratio: Inventory turnover ratio indicate the time period in which stock will
be converted into cash (Lee, Zhou and Hsu, 2015). In Next Plc, it went fall from 6.89
to 6.62 in 2015 on the other hand, in H&M, it got reduced from 3.70 to 3.46 in 2014.
Stock using efficiency prevails an declined in both the firms however, in Next Plc, it
is almost 2 times greater than H & M. Thus, it can be concluded that Next Plc is
quickly converting its inventory into sales for cash collection purpose. Furthermore,
inventory days in Next Plc is 55.13 however, in H &M, it is 105.63 which indicate
that H&M is stuck its cash in stock for longer time period. On contrary, in Next plc, it
is approximately half to 55.13 conclude that it is using inventory in more efficient
manner.
ï‚· Valuation ratios: FCF/share in Next plc got improved from 1.83 to 4.14. However,
in H&M, it got reduced from 0.93 to 0.76. On the other hand, operating cash
flow/share got enhanced from 2.49 to 4.86 in Next Plc whereas in H&M, it shows an
2 | P a g e
Document Page
little bit increase from 1.20 to 1.25. Thus, it became clear that Next plc is generating
high cash flows on the shares and will be able to gain high shareholder satisfaction
(Barua and Saha, 2015). Thus, it became clear that Asol Ltd should consider this
company for investment in share capital.
Non-financial performance measure
Revenue/employees in Next plc got improved from 114727 to 135729 whereas in
H&M, it went fall from 166639 to 138467 in 2014. Moreover, in Next Plc, EBITDA for
employees got declined from in H&M business, it got reduced from 42580 to 28008 in 2014.
Therefore, upward movement in Next plc indicated that more earnings is available for their
workers which is a sign of better company's performance.
Presenting data through column charts
Gross margin 2010 2011 2012 2013 2014 2015
Next Plc - 29.27 30.38 31.48 33.16 33.59
H & M 62.93 60.13 59.5 59.13 58.81 -
Next Plc
3 | P a g e
2011 2012 2013 2014 2015
27
28
29
30
31
32
33
34
29.27
30.38
31.48
33.16
33.59
tabler-icon-diamond-filled.svg

Paraphrase This Document

Need a fresh take? Get an instant paraphrase of this document with our AI Paraphraser
Document Page
Hennes and Muritz
Net margin 2010 2011 2012 2013 2014 2015
Next Plc - 11.93 12.62 14.34 14.79 15.87
H & M 17.22 14.38 13.96 13.3 13.19 -
Next Plc
Hennes and Muritz
4 | P a g e
2010 2011 2012 2013 2014 2015
56
57
58
59
60
61
62
63
64
62.93
60.13
59.5 59.13 58.81
2011 2012 2013 2014 2015
0
2
4
6
8
10
12
14
16
18
11.93 12.62
14.34 14.79
15.87
Document Page
Current
ratio
2010 2011 2012 2013 2014 2015
Next plc - 1.28 1.54 1.48 1.76 1.82
H & M 2.96 2.71 2.66 2.25 2.11 -
Next Plc
5 | P a g e
2010 2011 2012 2013 2014
0
2
4
6
8
10
12
14
16
18
20
17.22
14.38 13.96 13.3 13.19
Document Page
Hennes and Mauritz
Quick
ratio
2010 2011 2012 2013 2014 2015
Next plc 0.72 0.91 0.97 1.18 1.16
H & M 2.06 1.69 1.49 1.22 1.07
6 | P a g e
2011 2012 2013 2014 2015
0
0.2
0.4
0.6
0.8
1
1.2
1.4
1.6
1.8
2
1.28
1.54 1.48
1.76 1.82
2010 2011 2012 2013 2014
0
0.5
1
1.5
2
2.5
3
3.5
2.96
2.71 2.66
2.25 2.11
tabler-icon-diamond-filled.svg

Paraphrase This Document

Need a fresh take? Get an instant paraphrase of this document with our AI Paraphraser
Document Page
Next plc:
Hennes and Mauritz
7 | P a g e
2011 2012 2013 2014 2015
0
0.2
0.4
0.6
0.8
1
1.2
1.4
0.72
0.91 0.97
1.18 1.16
Document Page
Recommendation to Asol Ltd. CFO
On the basis of above analysis, it can be recommended to CFO of Asol Ltd that he
should make purchase of Next Plc shares. This is because its financial strength is
comparatively better than H&M business. High profit margin, better liquidity position, high
stock turnover ratio, good working capital management, well-designed capital structure,
improved managers effectiveness and high cash flow on shares interpreted that Next Plc
business will be more worthy for Asol ltd for investment objectives (Campbell, Galpin and
Johnson, 2015). Moreover, non-financial measure also presents that Next plc is performing
well and generate high revenues for the employees. Therefore, through investing money in
Next Plc, Asol Ltd can generate more yield and return on their investment.
Recommendation to Hennes and Mauritz
To
The directors of H & M
On the basis of financial analysis, it has been derived that operational performance of
the company is got reduced over the period. Therefore, managers need to pay focus on
improving their profitability. It can be done through maximizing revenues and minimizing
spendings. It will also assist to enhance return on assets and equity. Moreover, to strengthen
its financial status, management has to ensure better working capital management through
improving their liquid availability in the business. It can be done through receiving their
receivables quickly and paying delayed to the suppliers. Another, company has to improve
their inventory turnover ratios which make firm able to increase their cash inflows. It
provide assistance to operate effectively and remove operational difficulties. Furthermore,
8 | P a g e
2010 2011 2012 2013 2014
0
0.5
1
1.5
2
2.5
2.06
1.69
1.49
1.22
1.07
chevron_up_icon
1 out of 20
circle_padding
hide_on_mobile
zoom_out_icon
[object Object]