Financial Analysis Report: Marshall Motor Holdings PLC vs Lookers PLC
VerifiedAdded on  2020/04/15
|9
|2297
|257
Report
AI Summary
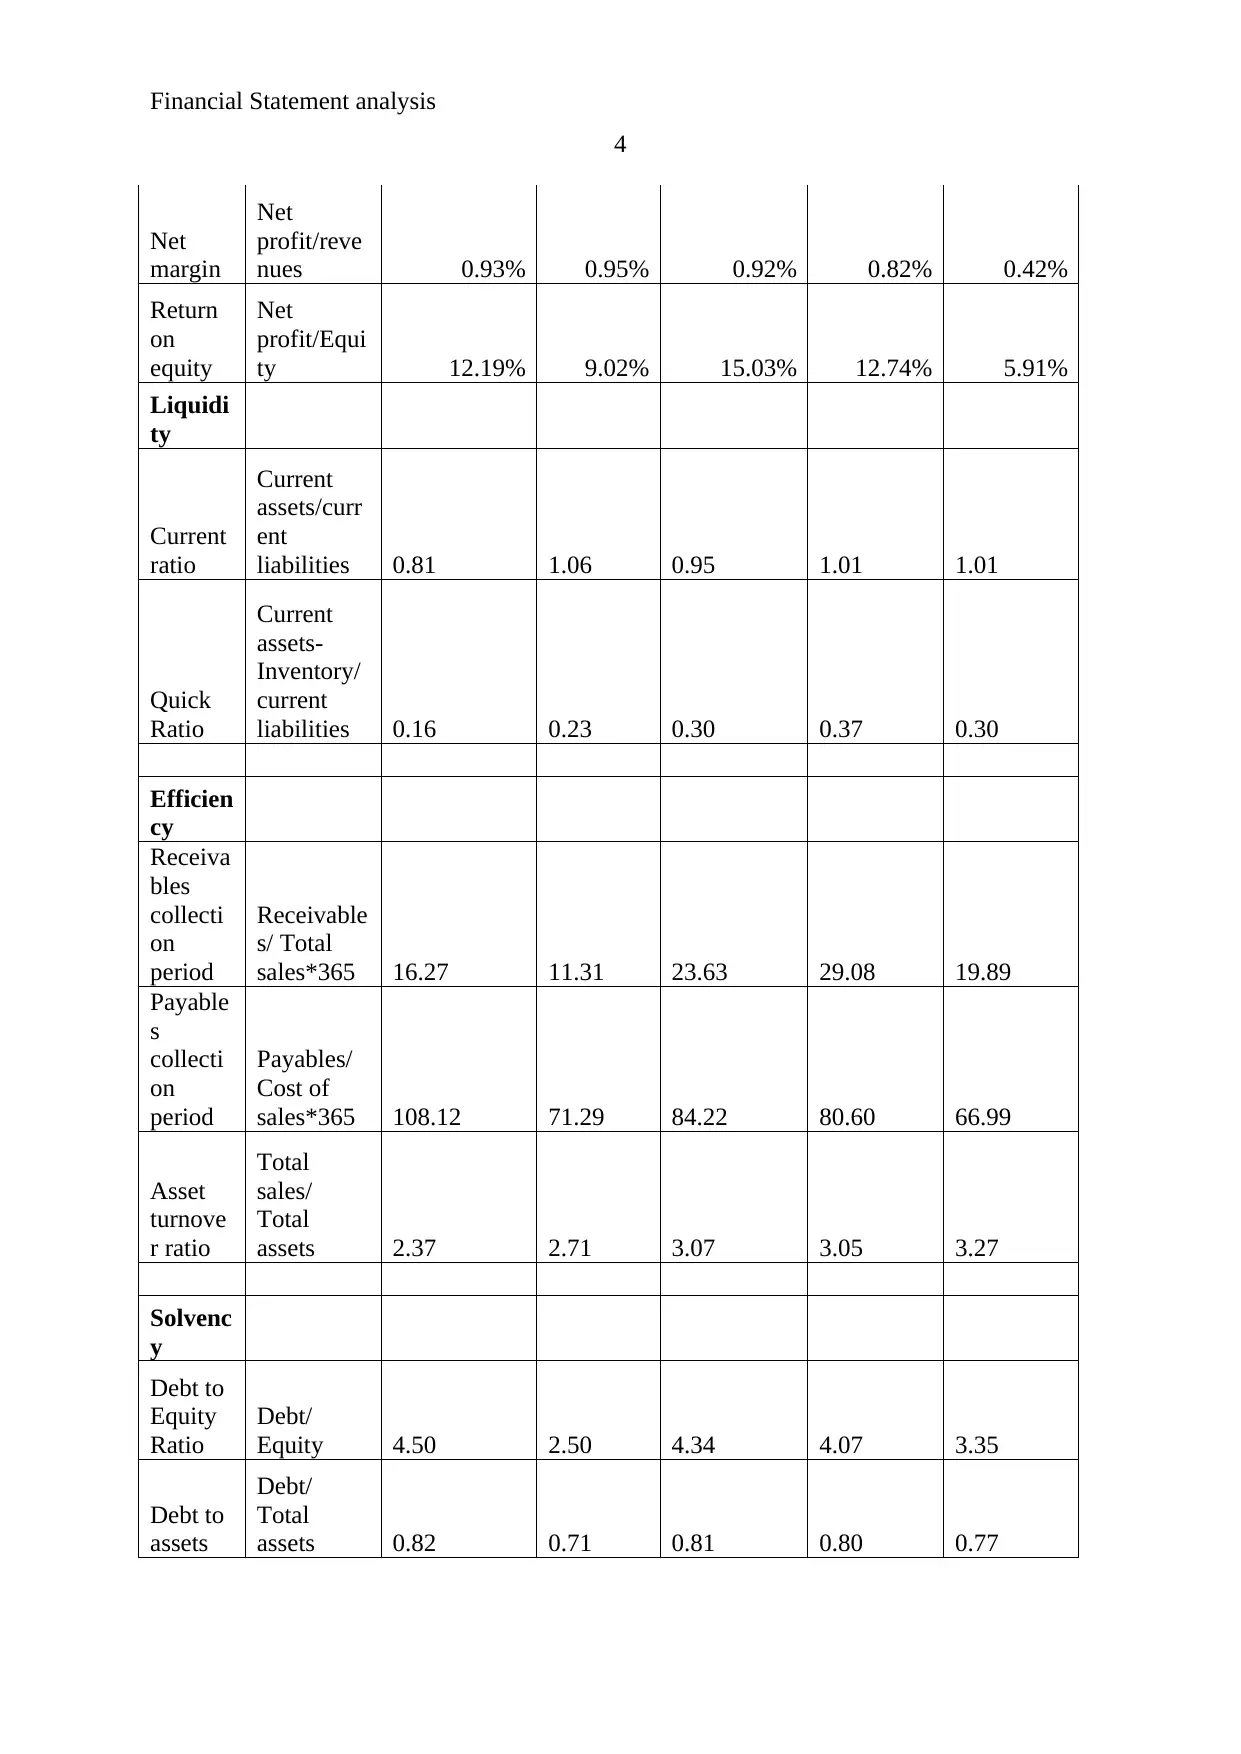
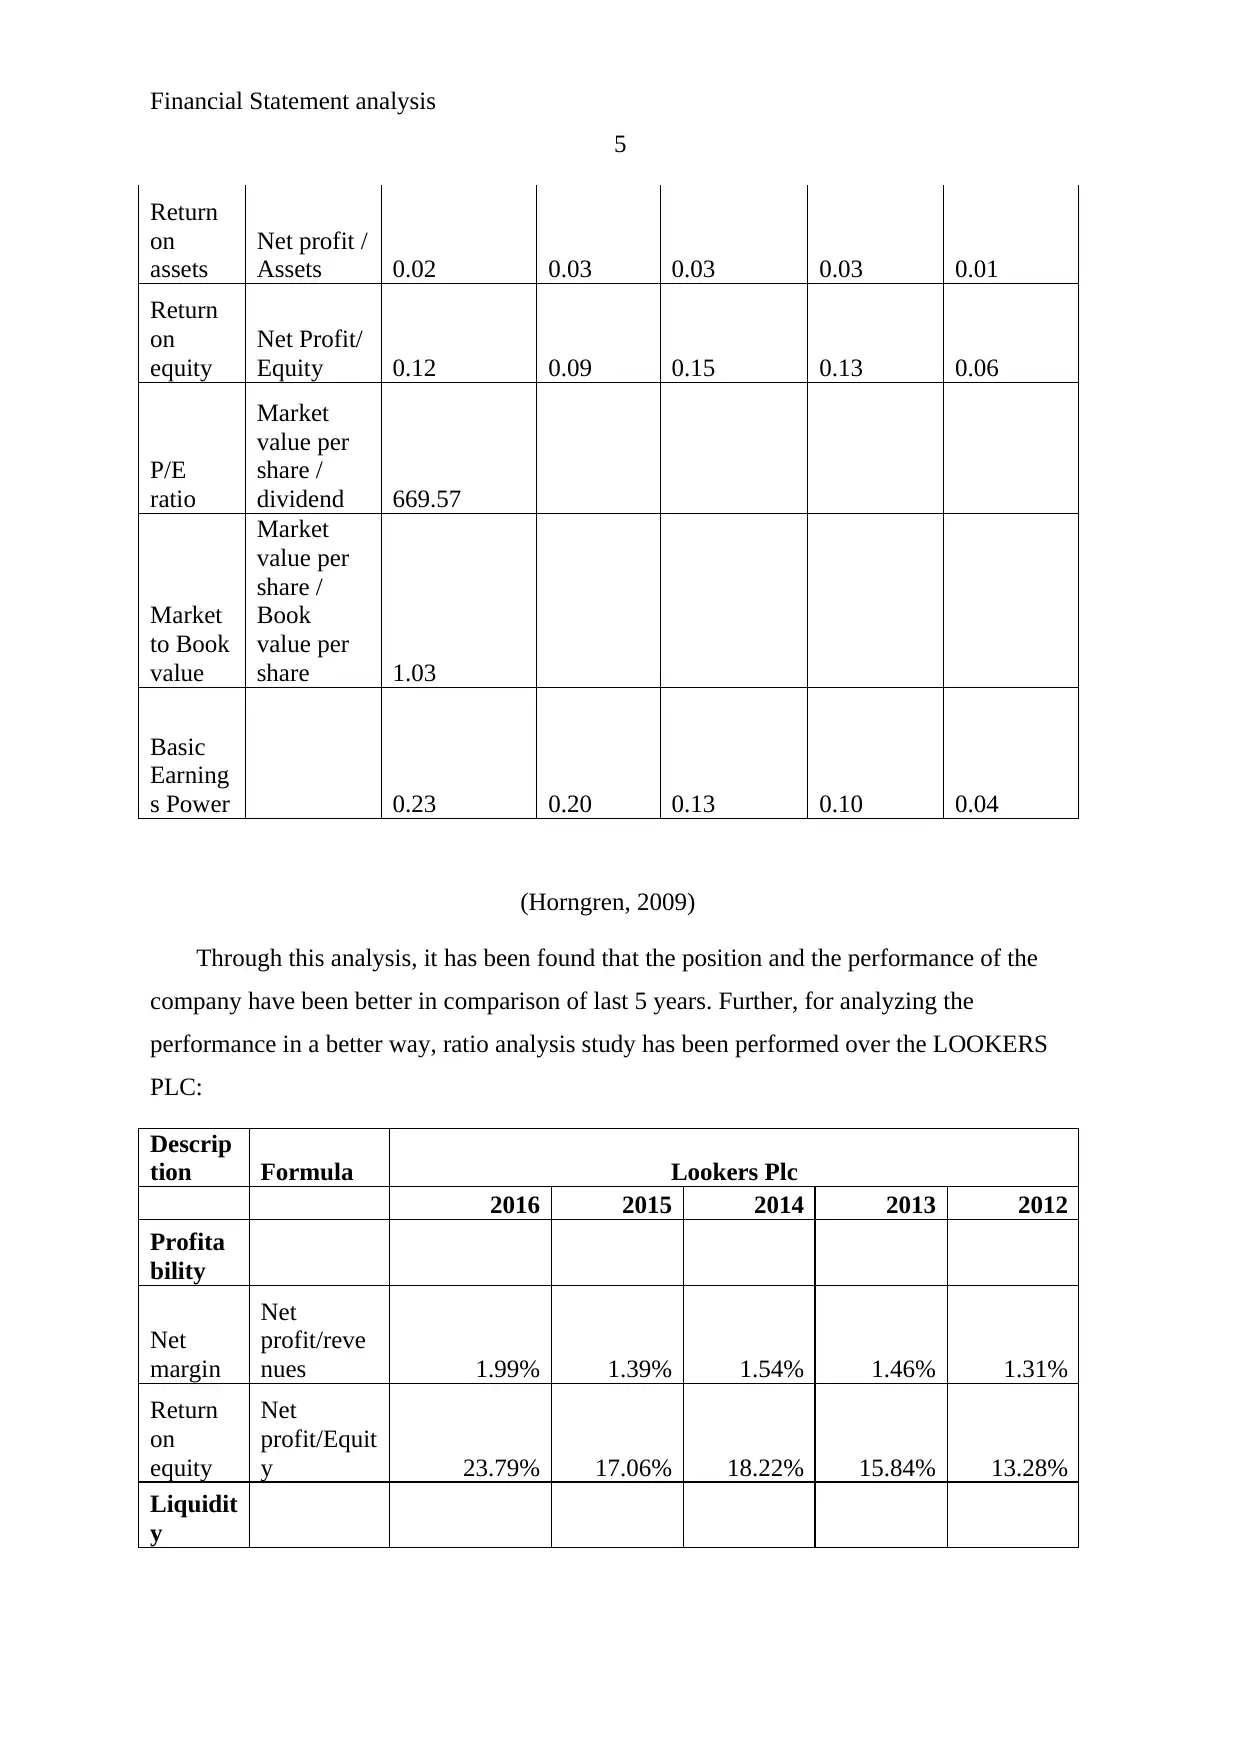
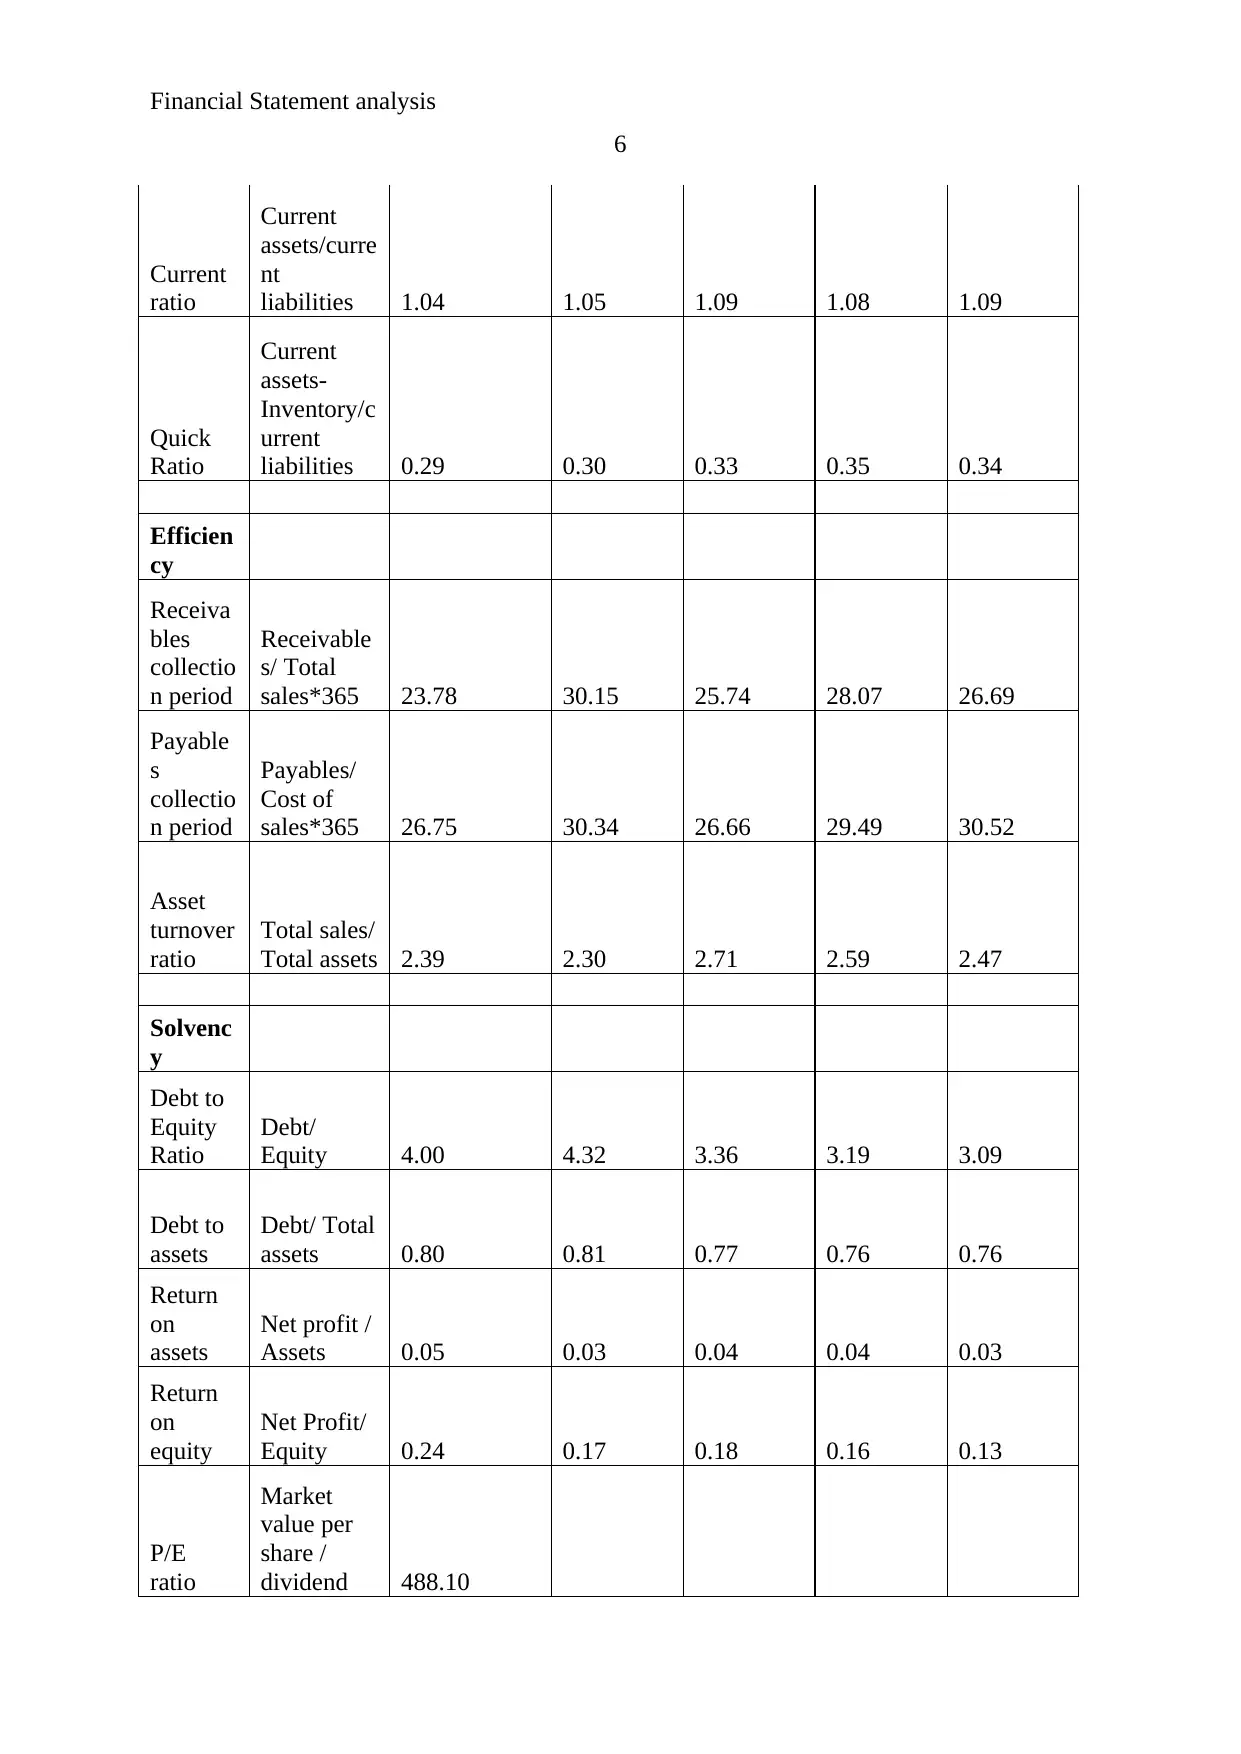
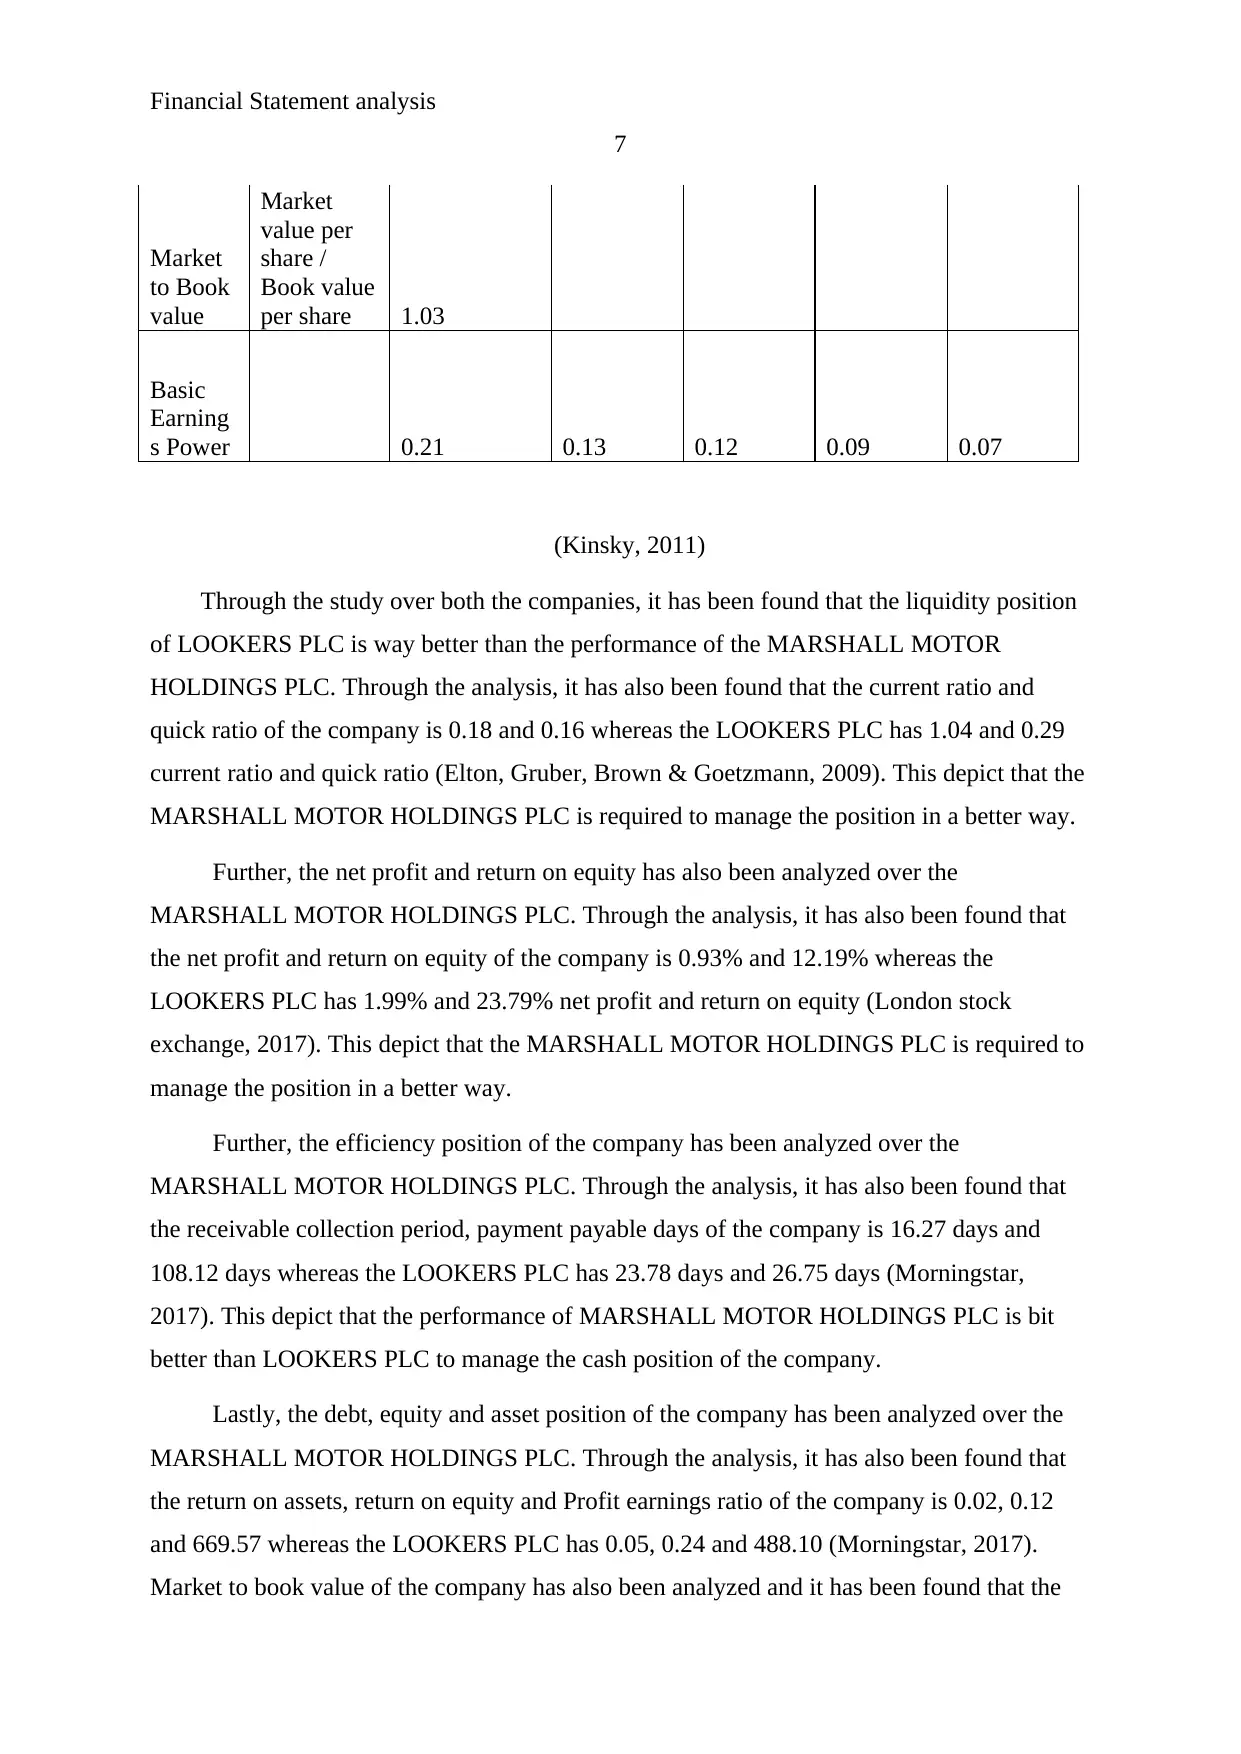
This report presents a comprehensive financial statement analysis of Marshall Motor Holdings PLC, a prominent international company in the automotive industry, and compares its performance with its competitor, Lookers PLC. The analysis focuses on key financial ratios, including profitability (net margin, return on equity), liquidity (current ratio, quick ratio), efficiency (receivables collection period, payable collection period, asset turnover), and solvency (debt-to-equity, debt-to-assets). The report utilizes data from 2012 to 2016 to assess the financial health of both companies, highlighting Marshall Motor Holdings PLC's improvements over the past five years while also pointing out areas for improvement. The study reveals that Lookers PLC generally has a stronger liquidity position. The report concludes with recommendations for Marshall Motor Holdings PLC to enhance its financial performance and maintain a competitive edge in the automotive market. The analysis is supported by references from financial resources like the London Stock Exchange and Morningstar.

Running Head: Financial Statement analysis
1
Project Report: Financial Statement analysis
1
Project Report: Financial Statement analysis
Paraphrase This Document
Need a fresh take? Get an instant paraphrase of this document with our AI Paraphraser

Financial Statement analysis
2
Contents
Introduction.......................................................................................................................3
Company overview...........................................................................................................3
Ratio analysis....................................................................................................................3
Recommendation and Conclusion....................................................................................7
References.........................................................................................................................8

Financial Statement analysis
3
Introduction:
Analysis over financial statements of a company is crucial; for all the stakeholders of
the company. This analysis assists a stakeholder to make a better decision regarding the
performance and the position of the company. Through this analysis, it has been found that
the various tactics are available for the financial statement analyst to perform a better study
over the financial statement of the company. In this report, ratio analysis study has been
performed over the MARSHALL MOTOR HOLDINGS PLC to analyze the performance of
the company and for better analysis, competitive company which is LOOKERS PLC also
have been analyzed.
Company overview:
MARSHALL MOTOR HOLDINGS PLC is an international company which has its
branches and subsidiary companies in around 27 countries. Further, it has been analyzed that
the position of the company has been enhanced due to various changes into the financial
position of the company. This company is operating its business in automotive industry. The
main competition of the company is from LOOKERS PLC. This company designs and
transports the commercial and public vehicle in the market (Home, 2017). Currently, this
company has a contract with 25 brands of supplying their vehicles in the market.
For this report, ratio analysis study has been performed over MARSHALL MOTOR
HOLDINGS PLC and LOOKERS PLC to make a better analysis study over the financial
performance and the position of the company. Further, the recommendation and conclusion
has been given according to the analysis over ratio analysis of both the companies.
Ratio analysis:
Ratio analysis is a method of financial analysis which depict about the position of a
company on various level such as profitability position, solvency position, efficiency
position, liquidity position etc. (Hansen, Mowen & Madison, 2010). Following are the ratio
analysis study of MARSHALL MOTOR HOLDINGS PLC:
Descrip
tion Formula Marshall Holdings plc
2016 2015 2014 2013 2012
Profita
bility
⊘ This is a preview!⊘
Do you want full access?
Subscribe today to unlock all pages.

Trusted by 1+ million students worldwide

Financial Statement analysis
4
Net
margin
Net
profit/reve
nues 0.93% 0.95% 0.92% 0.82% 0.42%
Return
on
equity
Net
profit/Equi
ty 12.19% 9.02% 15.03% 12.74% 5.91%
Liquidi
ty
Current
ratio
Current
assets/curr
ent
liabilities 0.81 1.06 0.95 1.01 1.01
Quick
Ratio
Current
assets-
Inventory/
current
liabilities 0.16 0.23 0.30 0.37 0.30
Efficien
cy
Receiva
bles
collecti
on
period
Receivable
s/ Total
sales*365 16.27 11.31 23.63 29.08 19.89
Payable
s
collecti
on
period
Payables/
Cost of
sales*365 108.12 71.29 84.22 80.60 66.99
Asset
turnove
r ratio
Total
sales/
Total
assets 2.37 2.71 3.07 3.05 3.27
Solvenc
y
Debt to
Equity
Ratio
Debt/
Equity 4.50 2.50 4.34 4.07 3.35
Debt to
assets
Debt/
Total
assets 0.82 0.71 0.81 0.80 0.77
Paraphrase This Document
Need a fresh take? Get an instant paraphrase of this document with our AI Paraphraser

Financial Statement analysis
5
Return
on
assets
Net profit /
Assets 0.02 0.03 0.03 0.03 0.01
Return
on
equity
Net Profit/
Equity 0.12 0.09 0.15 0.13 0.06
P/E
ratio
Market
value per
share /
dividend 669.57
Market
to Book
value
Market
value per
share /
Book
value per
share 1.03
Basic
Earning
s Power 0.23 0.20 0.13 0.10 0.04
(Horngren, 2009)
Through this analysis, it has been found that the position and the performance of the
company have been better in comparison of last 5 years. Further, for analyzing the
performance in a better way, ratio analysis study has been performed over the LOOKERS
PLC:
Descrip
tion Formula Lookers Plc
2016 2015 2014 2013 2012
Profita
bility
Net
margin
Net
profit/reve
nues 1.99% 1.39% 1.54% 1.46% 1.31%
Return
on
equity
Net
profit/Equit
y 23.79% 17.06% 18.22% 15.84% 13.28%
Liquidit
y

Financial Statement analysis
6
Current
ratio
Current
assets/curre
nt
liabilities 1.04 1.05 1.09 1.08 1.09
Quick
Ratio
Current
assets-
Inventory/c
urrent
liabilities 0.29 0.30 0.33 0.35 0.34
Efficien
cy
Receiva
bles
collectio
n period
Receivable
s/ Total
sales*365 23.78 30.15 25.74 28.07 26.69
Payable
s
collectio
n period
Payables/
Cost of
sales*365 26.75 30.34 26.66 29.49 30.52
Asset
turnover
ratio
Total sales/
Total assets 2.39 2.30 2.71 2.59 2.47
Solvenc
y
Debt to
Equity
Ratio
Debt/
Equity 4.00 4.32 3.36 3.19 3.09
Debt to
assets
Debt/ Total
assets 0.80 0.81 0.77 0.76 0.76
Return
on
assets
Net profit /
Assets 0.05 0.03 0.04 0.04 0.03
Return
on
equity
Net Profit/
Equity 0.24 0.17 0.18 0.16 0.13
P/E
ratio
Market
value per
share /
dividend 488.10
⊘ This is a preview!⊘
Do you want full access?
Subscribe today to unlock all pages.

Trusted by 1+ million students worldwide

Financial Statement analysis
7
Market
to Book
value
Market
value per
share /
Book value
per share 1.03
Basic
Earning
s Power 0.21 0.13 0.12 0.09 0.07
(Kinsky, 2011)
Through the study over both the companies, it has been found that the liquidity position
of LOOKERS PLC is way better than the performance of the MARSHALL MOTOR
HOLDINGS PLC. Through the analysis, it has also been found that the current ratio and
quick ratio of the company is 0.18 and 0.16 whereas the LOOKERS PLC has 1.04 and 0.29
current ratio and quick ratio (Elton, Gruber, Brown & Goetzmann, 2009). This depict that the
MARSHALL MOTOR HOLDINGS PLC is required to manage the position in a better way.
Further, the net profit and return on equity has also been analyzed over the
MARSHALL MOTOR HOLDINGS PLC. Through the analysis, it has also been found that
the net profit and return on equity of the company is 0.93% and 12.19% whereas the
LOOKERS PLC has 1.99% and 23.79% net profit and return on equity (London stock
exchange, 2017). This depict that the MARSHALL MOTOR HOLDINGS PLC is required to
manage the position in a better way.
Further, the efficiency position of the company has been analyzed over the
MARSHALL MOTOR HOLDINGS PLC. Through the analysis, it has also been found that
the receivable collection period, payment payable days of the company is 16.27 days and
108.12 days whereas the LOOKERS PLC has 23.78 days and 26.75 days (Morningstar,
2017). This depict that the performance of MARSHALL MOTOR HOLDINGS PLC is bit
better than LOOKERS PLC to manage the cash position of the company.
Lastly, the debt, equity and asset position of the company has been analyzed over the
MARSHALL MOTOR HOLDINGS PLC. Through the analysis, it has also been found that
the return on assets, return on equity and Profit earnings ratio of the company is 0.02, 0.12
and 669.57 whereas the LOOKERS PLC has 0.05, 0.24 and 488.10 (Morningstar, 2017).
Market to book value of the company has also been analyzed and it has been found that the
Paraphrase This Document
Need a fresh take? Get an instant paraphrase of this document with our AI Paraphraser

Financial Statement analysis
8
value of MARSHALL MOTOR HOLDINGS PLC is way better. This depict that the
performance of MARSHALL MOTOR HOLDINGS PLC is quite bad than LOOKERS PLC
to manage the capital structure position of the company.
Further, through the above analysis, it has been found that the position of the company
in the market is bit better (Baker & Nofsinger, 2010). But for becoming the best and leader in
the market, company is required to make various changes into the position and the
performance of the company.
Recommendation and Conclusion:
Through the above study, it has been found that the financial analysis of
MARSHALL MOTOR HOLDINGS PLC depicts that various changes have taken place into
the stability and profitability position in last 5 years. Further, it has also been found that the
position of the company in the market is bit better. This company is one of the largest
companies in automotive industry. But the analysis over LOOKERS PLC depict that this
company has managed the better performance of the financial data of the company. But for
becoming the best and leader in the market, company is required to make various changes
into the position and the performance of the company.

Financial Statement analysis
9
References:
London stock exchange. (2017). Marshall Motor holdings plc. Retrieved from
http://www.londonstockexchange.com/exchange/prices-and-markets/stocks/summary/
company-summary/GB00BVYB2Q58GBGBXASQ1.html available as on 26th Nov
2017
Morningstar. (2017). Marshall Motor holdings plc. Retrieved from
http://financials.morningstar.com/ratios/r.html?t=MSLH available as on 26th Nov 2017
Lookers plc. (2017). Home. Retrieved from http://www.lookersplc.com/ available as on 26th
Nov 2017
Morningstar. (2017). Lookers plc. Retrieved from
http://financials.morningstar.com/ratios/r.html?t=LO6A available as on 26th Nov 2017
Baker, H.K. & Nofsinger, J.R. (2010). Behavioral Finance: Investors, Corporations, and
Markets. John Wiley and Sons.
Elton, E.J., Gruber, M.J., Brown, S.J., & Goetzmann, W.N. (2009). Modern Portfolio Theory
and Investment Analysis. John Wiley and Sons.
Hansen, D. R., Mowen, M. M. & Madison, T. (2010). Cornerstones of cost accounting. Issues
in Accounting Education, 25(4), 790-791.
Horngren, C. T. (2009). Cost accounting: A managerial emphasis, 13/e. Pearson Education
India.
Kinsky, R. (2011). Charting Made Simple: A Beginner's Guide to Technical Analysis. John
Wiley and Sons.
⊘ This is a preview!⊘
Do you want full access?
Subscribe today to unlock all pages.

Trusted by 1+ million students worldwide
1 out of 9
Related Documents

Your All-in-One AI-Powered Toolkit for Academic Success.
 +13062052269
info@desklib.com
Available 24*7 on WhatsApp / Email
Unlock your academic potential
Copyright © 2020–2025 A2Z Services. All Rights Reserved. Developed and managed by ZUCOL.