Comparative Financial Analysis of Aldar and Emaar Properties PJSC
VerifiedAdded on 2022/10/14
|20
|6046
|141
Report
AI Summary
This report presents a comparative financial analysis of Aldar Properties PJSC and Emaar Properties PJSC, two prominent real estate developers in the UAE. The analysis encompasses a detailed examination of their financial statements, focusing on profitability, liquidity, management efficiency, and debt effectiveness. The report employs horizontal, vertical, trend, and ratio analyses to provide a comprehensive understanding of the companies' financial performance. It evaluates key financial indicators, including revenue, net income, assets, liabilities, cash flow, and various financial ratios, to assess their strengths, weaknesses, and overall financial health. The analysis considers the economic and market overview of the UAE real estate sector, including SWOT analysis for Aldar. The report provides insights into the companies' performance over time, comparing key metrics and highlighting trends. Furthermore, the report offers valuable insights into the financial performance of both companies and offers a comprehensive understanding of their financial positions.
Overview
The current report is aimed at analyzing Aldar’s financial statements and
its comparison to figures of the chosen benchmark company, namely Emaar
Properties PJSC. The analysis part of the report covers the profitability, liquidity,
management efficiency, and debt effectiveness of the company. In order to
describe the mentioned four areas of the company in a holistic and concise
manner, horizontal, vertical, trend, and ratio analyses will be used.
Aldar Properties PJSC is one of the leading developers of real estate in
Abu Dhabi. The company is one of the most recognized real estate developers
in the United Arab Emirates and the wider Middle East region.
The company was founded in 2005. The company continues to design and
build the high-qualitative real estate in Abu Dhabi and other regions of the
United Arab Emirates. The company’s stocks are traded on the Abu Dhabi
Securities Exchange. According to Aldar’s official website, its vision is to “be the
most trusted and recognized real estate lifestyle developer in Abu Dhabi and
beyond” (About Aldar 2019). On the other hand, the company’s mission is to
maximize the value of its stakeholders by creating a qualitative real estate.
In addition, Aldar is focused on following its values, including team spirit,
ambition, commitment, diversity. Team spirit emphasizes the company’s trust in
each employee and is aimed at achieving great results done together. Ambition
is one of the most important preconditions of any success. Therefore, the
company tries to be accountable and be responsible for all its actions. Diversity
implies the company’s respect for different opinions, cultures, and people.
Economic and Market Overview
The United Arab Emirates is a country with high rates of economic growth,
due to rich natural resources and its previous development. For example, the
country’s GDP average growth rate was 5.2% during 2011-2015. However, the
rate of GDP growth dropped to 3% in 2016 and 0.5% in 2017. During the last
year, the country’s GDP raised by 1.7%. As it is evident from these data, rate of
the country’s economic growth is much lesser, than it was before 2016. As it is
known, the country’s GDP may be computed by summarizing the total
expenditures of all economic subjects, or total income of the same subjects.
Thus, declining the rates of economic growth indicates lesser rates of income
per capita growth. In such a situation, the demand of all economic subjects
decreases.
The dynamics of the UAE’s GDP per capita only approves the made
above conclusion. The country’s GDP per capita increased from 40276 in 2015
to $41045 in 2016, but it declined to $40819 in 2017 and $40782 in 2018. The
unemployment rate within the country also showed a negative dynamics, since
it raised from 1.64% in 2016 to 2.57% in 2018.
1
Paraphrase This Document
Need a fresh take? Get an instant paraphrase of this document with our AI Paraphraser
The country’s budget was also faced with the slowing down of the economic
growth. The budget surplus of 10.4% in 2013 changed to 5% in 2014. Since
2015, there was a budget deficit. “The United Arab Emirates recorded a
Government Budget deficit equal to 1.80 percent of the country's Gross
Domestic Product in 2018” (United Arab Emirates Government Budget 2019).
The country’s debt to GDP ratio also showed a negative trend, since it
increased from 15.5% in 2014 to 18.6% in 2018. However, despite negative
dynamics, this value of this indicator is much lesser than the critical 60%.
However, we expect a positive trend, due to increasing of the ADX General
since the beginning of 2016 year. Since July 2014, the UAE’s real estate price
index dropped by 32%.
The SWOT analysis is a procedure for expert diagnostics of the
environment, which allows describing the main trends of its development,
formulating the basic hypotheses about the prospects of the organization, and
determining the field of alternative directions for its further development.
Analyzing Aldar’s internal and external environment, its SWOT-analysis is
presented below.
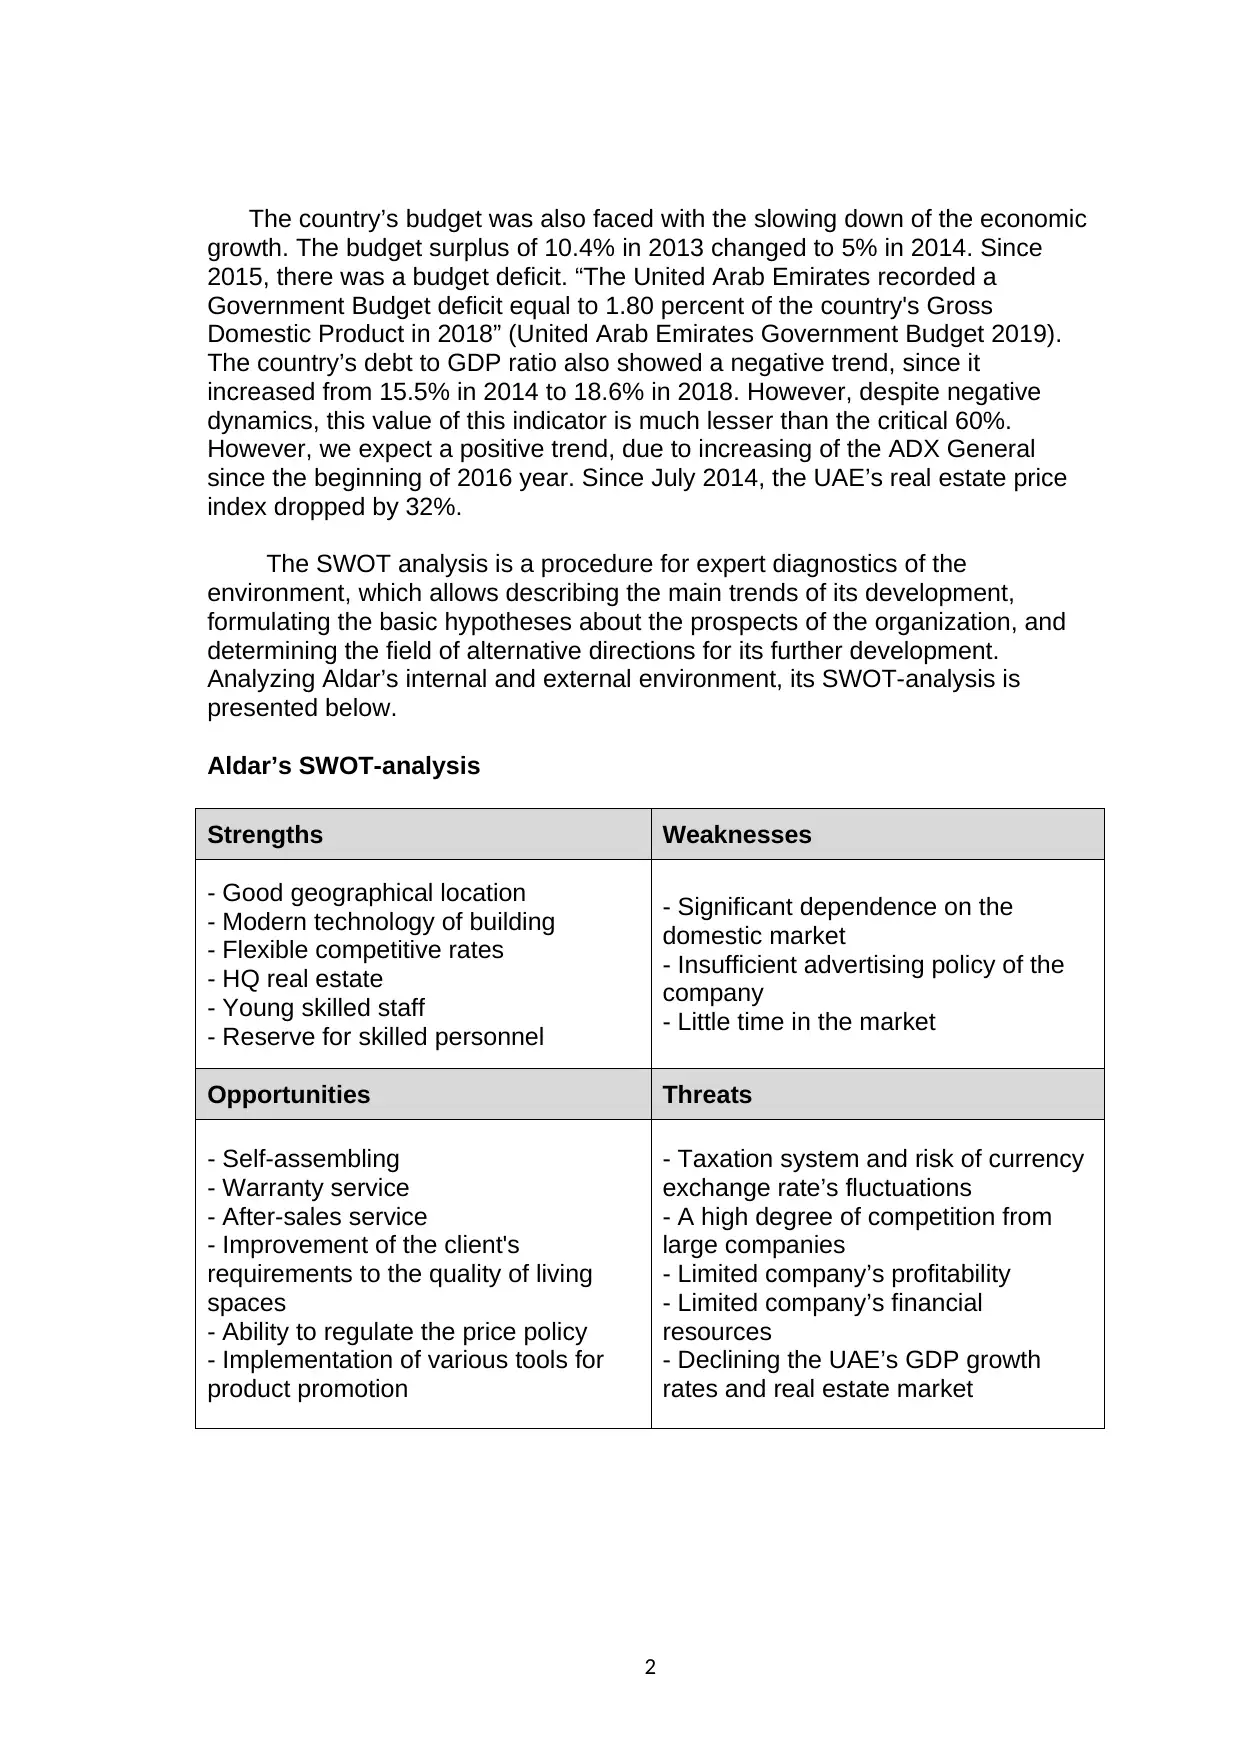
Aldar’s SWOT-analysis
Strengths Weaknesses
- Good geographical location
- Modern technology of building
- Flexible competitive rates
- HQ real estate
- Young skilled staff
- Reserve for skilled personnel
- Significant dependence on the
domestic market
- Insufficient advertising policy of the
company
- Little time in the market
Opportunities Threats
- Self-assembling
- Warranty service
- After-sales service
- Improvement of the client's
requirements to the quality of living
spaces
- Ability to regulate the price policy
- Implementation of various tools for
product promotion
- Taxation system and risk of currency
exchange rate’s fluctuations
- A high degree of competition from
large companies
- Limited company’s profitability
- Limited company’s financial
resources
- Declining the UAE’s GDP growth
rates and real estate market
2
growth. The budget surplus of 10.4% in 2013 changed to 5% in 2014. Since
2015, there was a budget deficit. “The United Arab Emirates recorded a
Government Budget deficit equal to 1.80 percent of the country's Gross
Domestic Product in 2018” (United Arab Emirates Government Budget 2019).
The country’s debt to GDP ratio also showed a negative trend, since it
increased from 15.5% in 2014 to 18.6% in 2018. However, despite negative
dynamics, this value of this indicator is much lesser than the critical 60%.
However, we expect a positive trend, due to increasing of the ADX General
since the beginning of 2016 year. Since July 2014, the UAE’s real estate price
index dropped by 32%.
The SWOT analysis is a procedure for expert diagnostics of the
environment, which allows describing the main trends of its development,
formulating the basic hypotheses about the prospects of the organization, and
determining the field of alternative directions for its further development.
Analyzing Aldar’s internal and external environment, its SWOT-analysis is
presented below.
Aldar’s SWOT-analysis
Strengths Weaknesses
- Good geographical location
- Modern technology of building
- Flexible competitive rates
- HQ real estate
- Young skilled staff
- Reserve for skilled personnel
- Significant dependence on the
domestic market
- Insufficient advertising policy of the
company
- Little time in the market
Opportunities Threats
- Self-assembling
- Warranty service
- After-sales service
- Improvement of the client's
requirements to the quality of living
spaces
- Ability to regulate the price policy
- Implementation of various tools for
product promotion
- Taxation system and risk of currency
exchange rate’s fluctuations
- A high degree of competition from
large companies
- Limited company’s profitability
- Limited company’s financial
resources
- Declining the UAE’s GDP growth
rates and real estate market
2
Financial analysis
Horizontal analysis
Horizontal analysis is a tool used to analyze the company’s financial
report. Horizontal analysis focuses on calculating the growth rates of many
indicators this knowledge creates an opportunity to analyze the financial reports
in dynamics.
According to numbers provided in 1, Aldar’s total revenue increased only
by 1.715 in 2018 as compared to the previous year. It should be also
emphasized that the company’s revenue was fluctuating at around AED 6200
million. On the other hand, the cost of revenue increased more than the
revenue indicating that the company’s net income, as well as its efficiency and
profitability, decreased.
This decrease in the company’s net income by 7.5% in 2018 as compared to
the 2017 fiscal year only proves the previously made assumption.
As it is seen in the calculations provided in table 1, Aldar’s total assets and
current assets increased by 5.9% and 6.0%, respectively. On the other hand,
cash and its equivalents dropped in 2018 as compared to 2017 by 27.1%,
implying the worsened structure of the company’s liquid assets. Taking into
account the fact that Aldar’s current assets increased by 6% in 2018 as
compared to the prior year and its current liabilities declined by 31.3%, the
company’s general liquidity increased.
As it is also seen, Aldar’s total liabilities increased more than the total
shareholder’s equity thus indicating the worsened capital structure. In addition,
the net cash generated by operational activity became negative in 2018, while
net cash from investing activity increased from AED -1718,7 million in 2017 to
AED 792,2 million in 2018. Declined earnings per share indicate the lower
investment attractiveness of the company.
To conclude, despite the fact that most company’s indicators presented in
table 1 increased, the company’s net income declined. Meanwhile, the capital
structure worsened in 2018 as compared to 2017.
Vertical analysis
Vertical analysis is a tool used to analyze the structure of the company’s
financial statements.
3
⊘ This is a preview!⊘
Do you want full access?
Subscribe today to unlock all pages.
Trusted by 1+ million students worldwide
The percentage of cash and its equivalents declined from 18.9% in 2017
to 13.0% in 2018. It is not a good trend since the cash and its equivalents are
the most liquid assets of any company. The percentage of receivables and
current assets did not change during this period.
On the other hand, the percentage of accounts payables declined a bit
from 14.8% in 2017 to 14.2% in 2018. The percentage of current liabilities
declined roughly by 10%. It can be considered a positive trend since a larger
percentage of the company’s capital goes to long-term liabilities. Declining the
percentage of shareholders’ equity by 1% cannot be considered a good trend.
On the other hand, the percentage of total liabilities increased almost by 1%.
Trend analysis
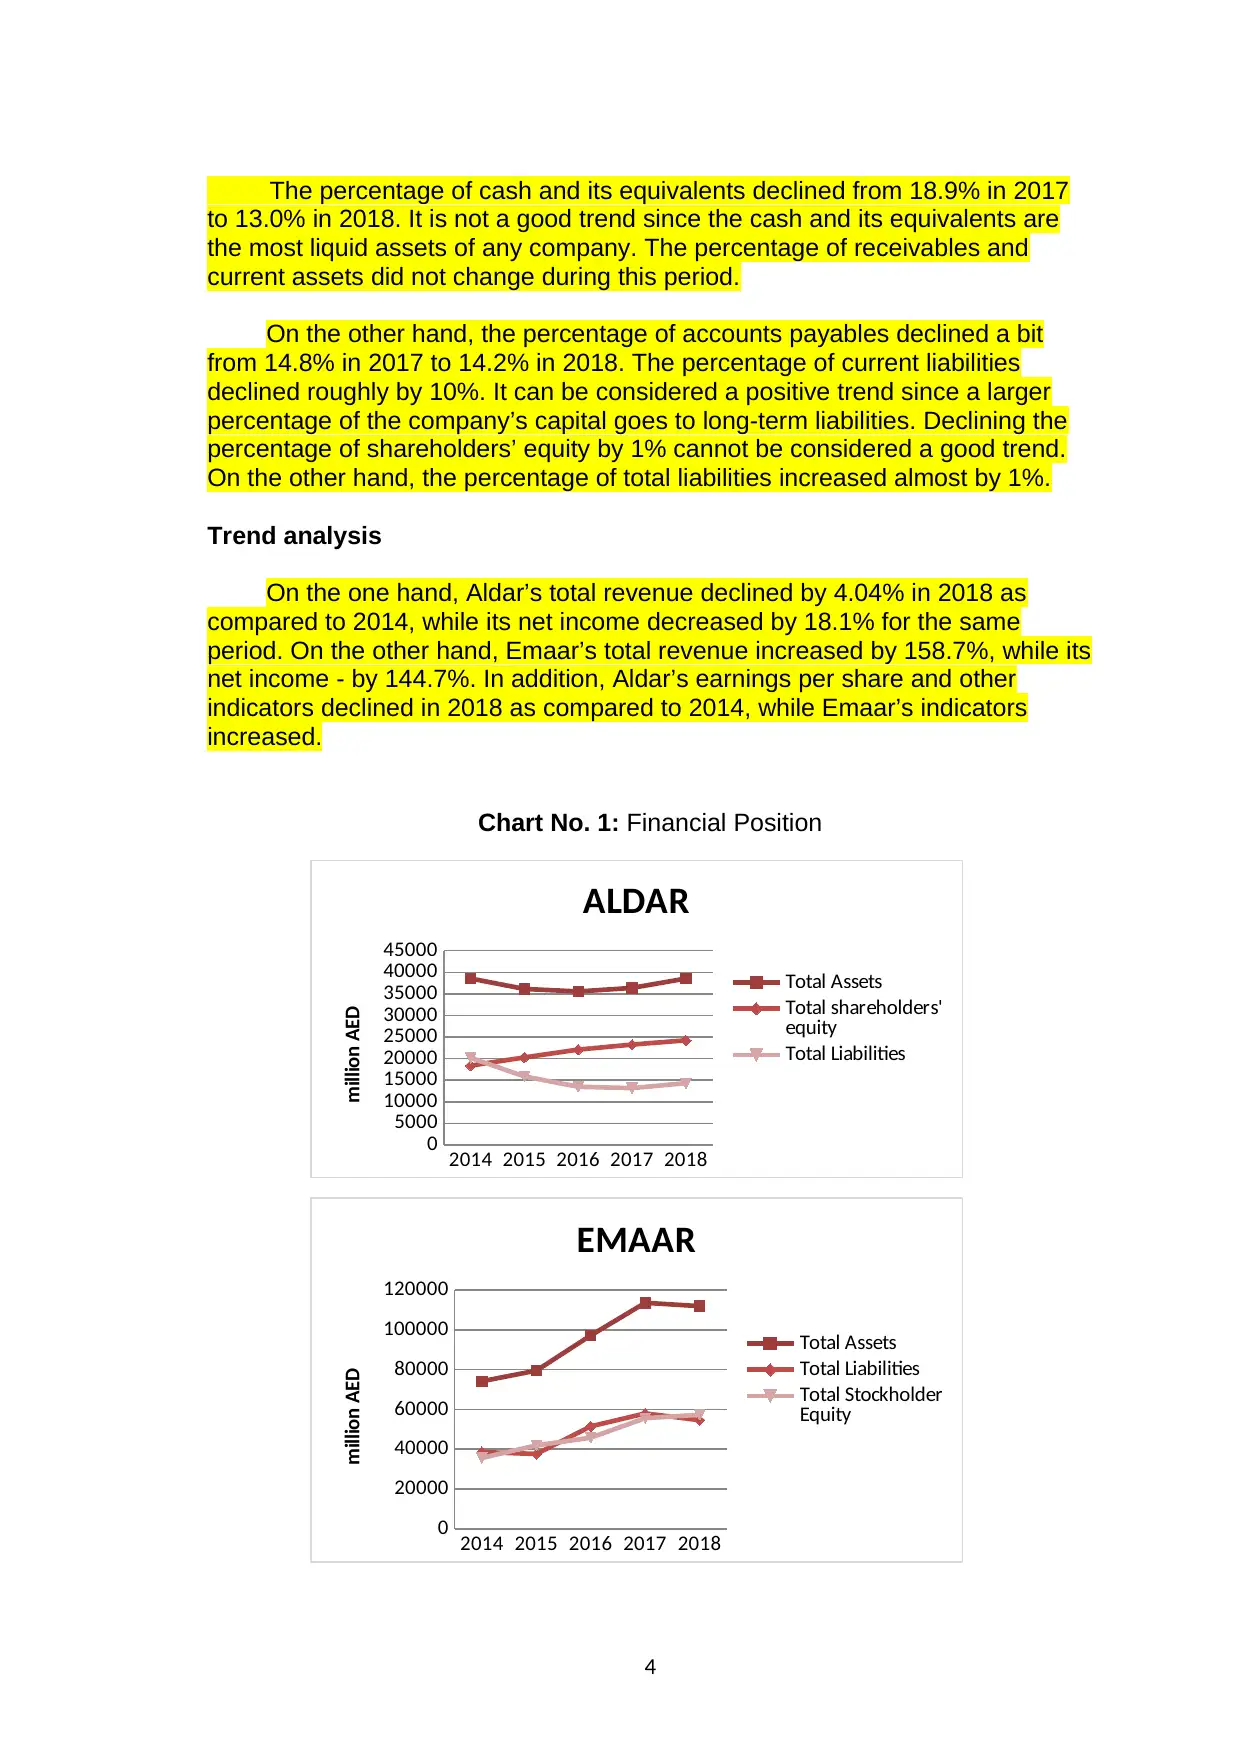
On the one hand, Aldar’s total revenue declined by 4.04% in 2018 as
compared to 2014, while its net income decreased by 18.1% for the same
period. On the other hand, Emaar’s total revenue increased by 158.7%, while its
net income - by 144.7%. In addition, Aldar’s earnings per share and other
indicators declined in 2018 as compared to 2014, while Emaar’s indicators
increased.
Chart No. 1: Financial Position
2014 2015 2016 2017 2018
0
5000
10000
15000
20000
25000
30000
35000
40000
45000
ALDAR
Total Assets
Total shareholders'
equity
Total Liabilities
million AED
2014 2015 2016 2017 2018
0
20000
40000
60000
80000
100000
120000
EMAAR
Total Assets
Total Liabilities
Total Stockholder
Equity
million AED
4
to 13.0% in 2018. It is not a good trend since the cash and its equivalents are
the most liquid assets of any company. The percentage of receivables and
current assets did not change during this period.
On the other hand, the percentage of accounts payables declined a bit
from 14.8% in 2017 to 14.2% in 2018. The percentage of current liabilities
declined roughly by 10%. It can be considered a positive trend since a larger
percentage of the company’s capital goes to long-term liabilities. Declining the
percentage of shareholders’ equity by 1% cannot be considered a good trend.
On the other hand, the percentage of total liabilities increased almost by 1%.
Trend analysis
On the one hand, Aldar’s total revenue declined by 4.04% in 2018 as
compared to 2014, while its net income decreased by 18.1% for the same
period. On the other hand, Emaar’s total revenue increased by 158.7%, while its
net income - by 144.7%. In addition, Aldar’s earnings per share and other
indicators declined in 2018 as compared to 2014, while Emaar’s indicators
increased.
Chart No. 1: Financial Position
2014 2015 2016 2017 2018
0
5000
10000
15000
20000
25000
30000
35000
40000
45000
ALDAR
Total Assets
Total shareholders'
equity
Total Liabilities
million AED
2014 2015 2016 2017 2018
0
20000
40000
60000
80000
100000
120000
EMAAR
Total Assets
Total Liabilities
Total Stockholder
Equity
million AED
4
Paraphrase This Document
Need a fresh take? Get an instant paraphrase of this document with our AI Paraphraser
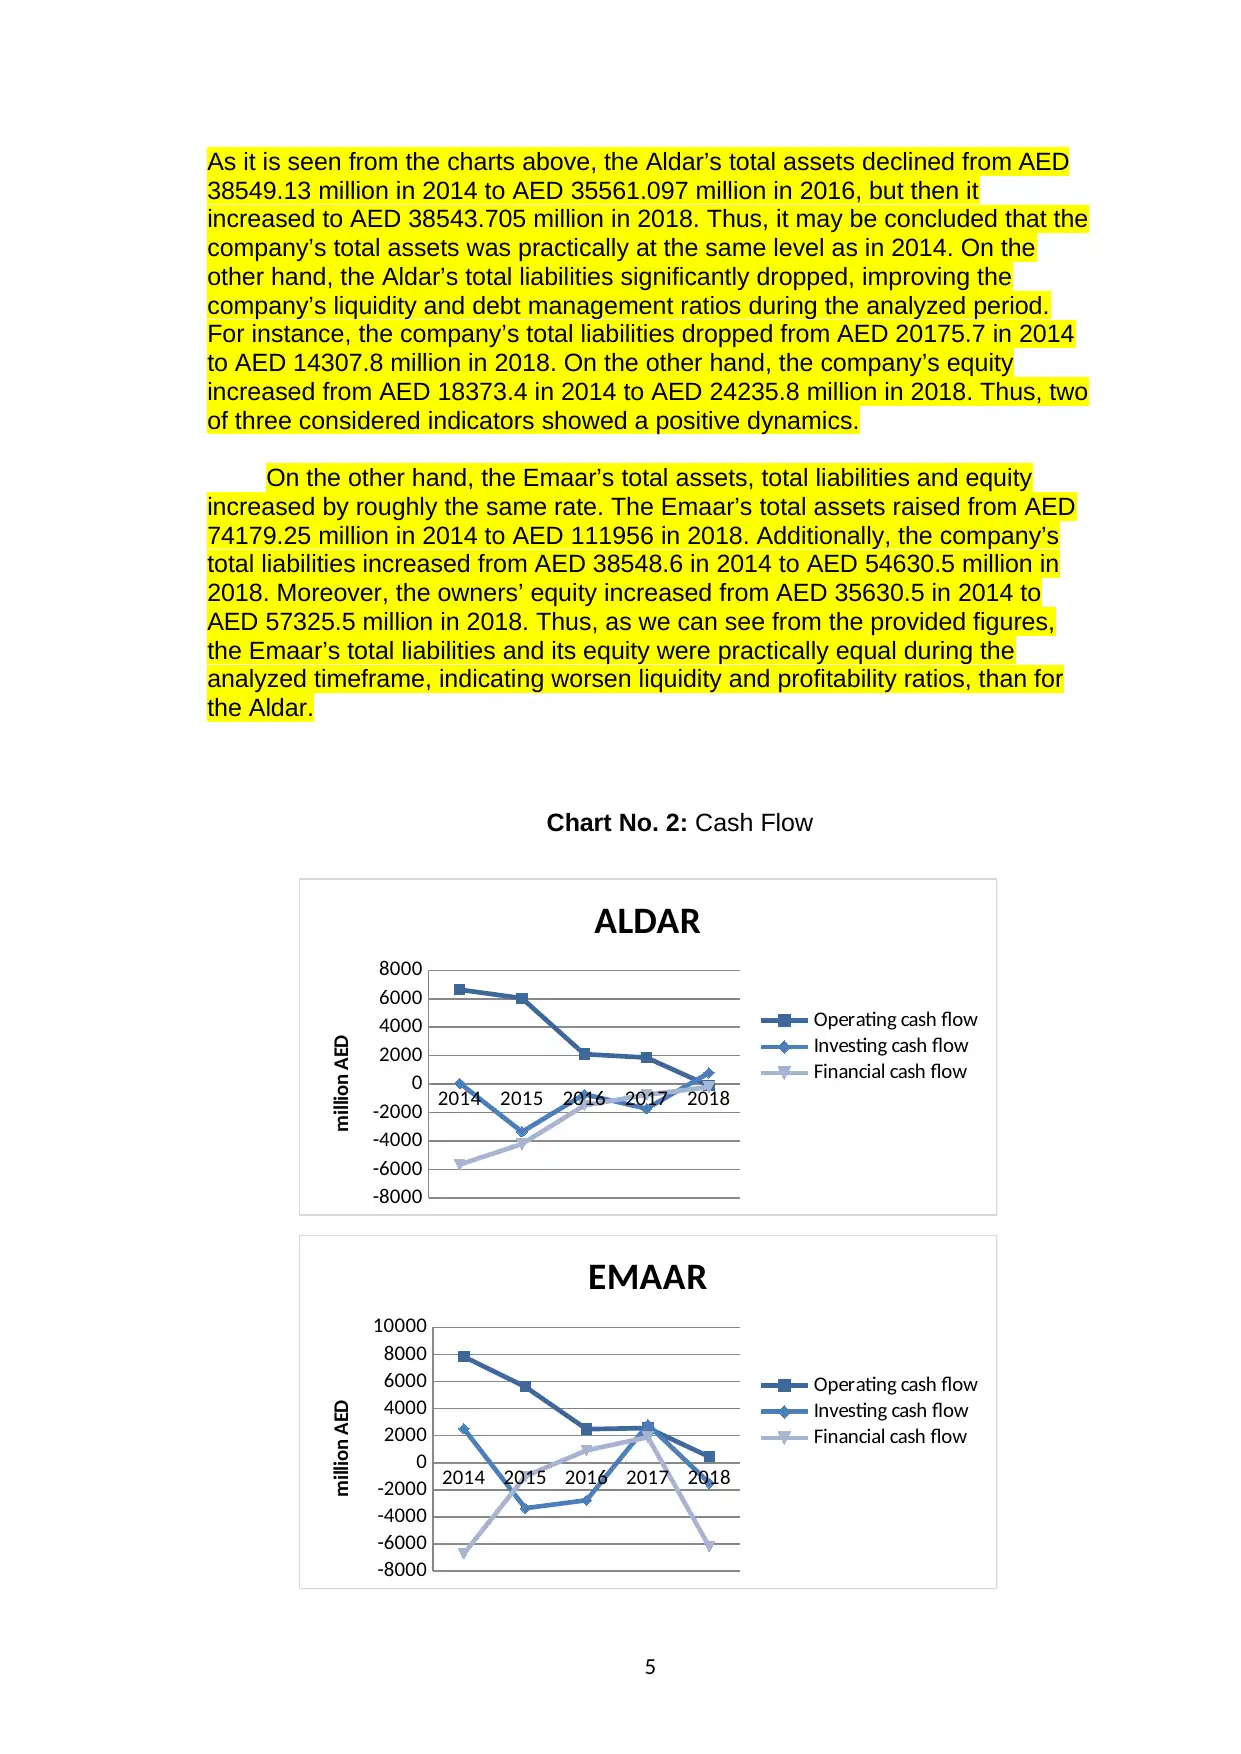
As it is seen from the charts above, the Aldar’s total assets declined from AED
38549.13 million in 2014 to AED 35561.097 million in 2016, but then it
increased to AED 38543.705 million in 2018. Thus, it may be concluded that the
company’s total assets was practically at the same level as in 2014. On the
other hand, the Aldar’s total liabilities significantly dropped, improving the
company’s liquidity and debt management ratios during the analyzed period.
For instance, the company’s total liabilities dropped from AED 20175.7 in 2014
to AED 14307.8 million in 2018. On the other hand, the company’s equity
increased from AED 18373.4 in 2014 to AED 24235.8 million in 2018. Thus, two
of three considered indicators showed a positive dynamics.
On the other hand, the Emaar’s total assets, total liabilities and equity
increased by roughly the same rate. The Emaar’s total assets raised from AED
74179.25 million in 2014 to AED 111956 in 2018. Additionally, the company’s
total liabilities increased from AED 38548.6 in 2014 to AED 54630.5 million in
2018. Moreover, the owners’ equity increased from AED 35630.5 in 2014 to
AED 57325.5 million in 2018. Thus, as we can see from the provided figures,
the Emaar’s total liabilities and its equity were practically equal during the
analyzed timeframe, indicating worsen liquidity and profitability ratios, than for
the Aldar.
Chart No. 2: Cash Flow
2014 2015 2016 2017 2018
-8000
-6000
-4000
-2000
0
2000
4000
6000
8000
10000
EMAAR
Operating cash flow
Investing cash flow
Financial cash flow
million AED
2014 2015 2016 2017 2018
-8000
-6000
-4000
-2000
0
2000
4000
6000
8000
ALDAR
Operating cash flow
Investing cash flow
Financial cash flow
million AED
5
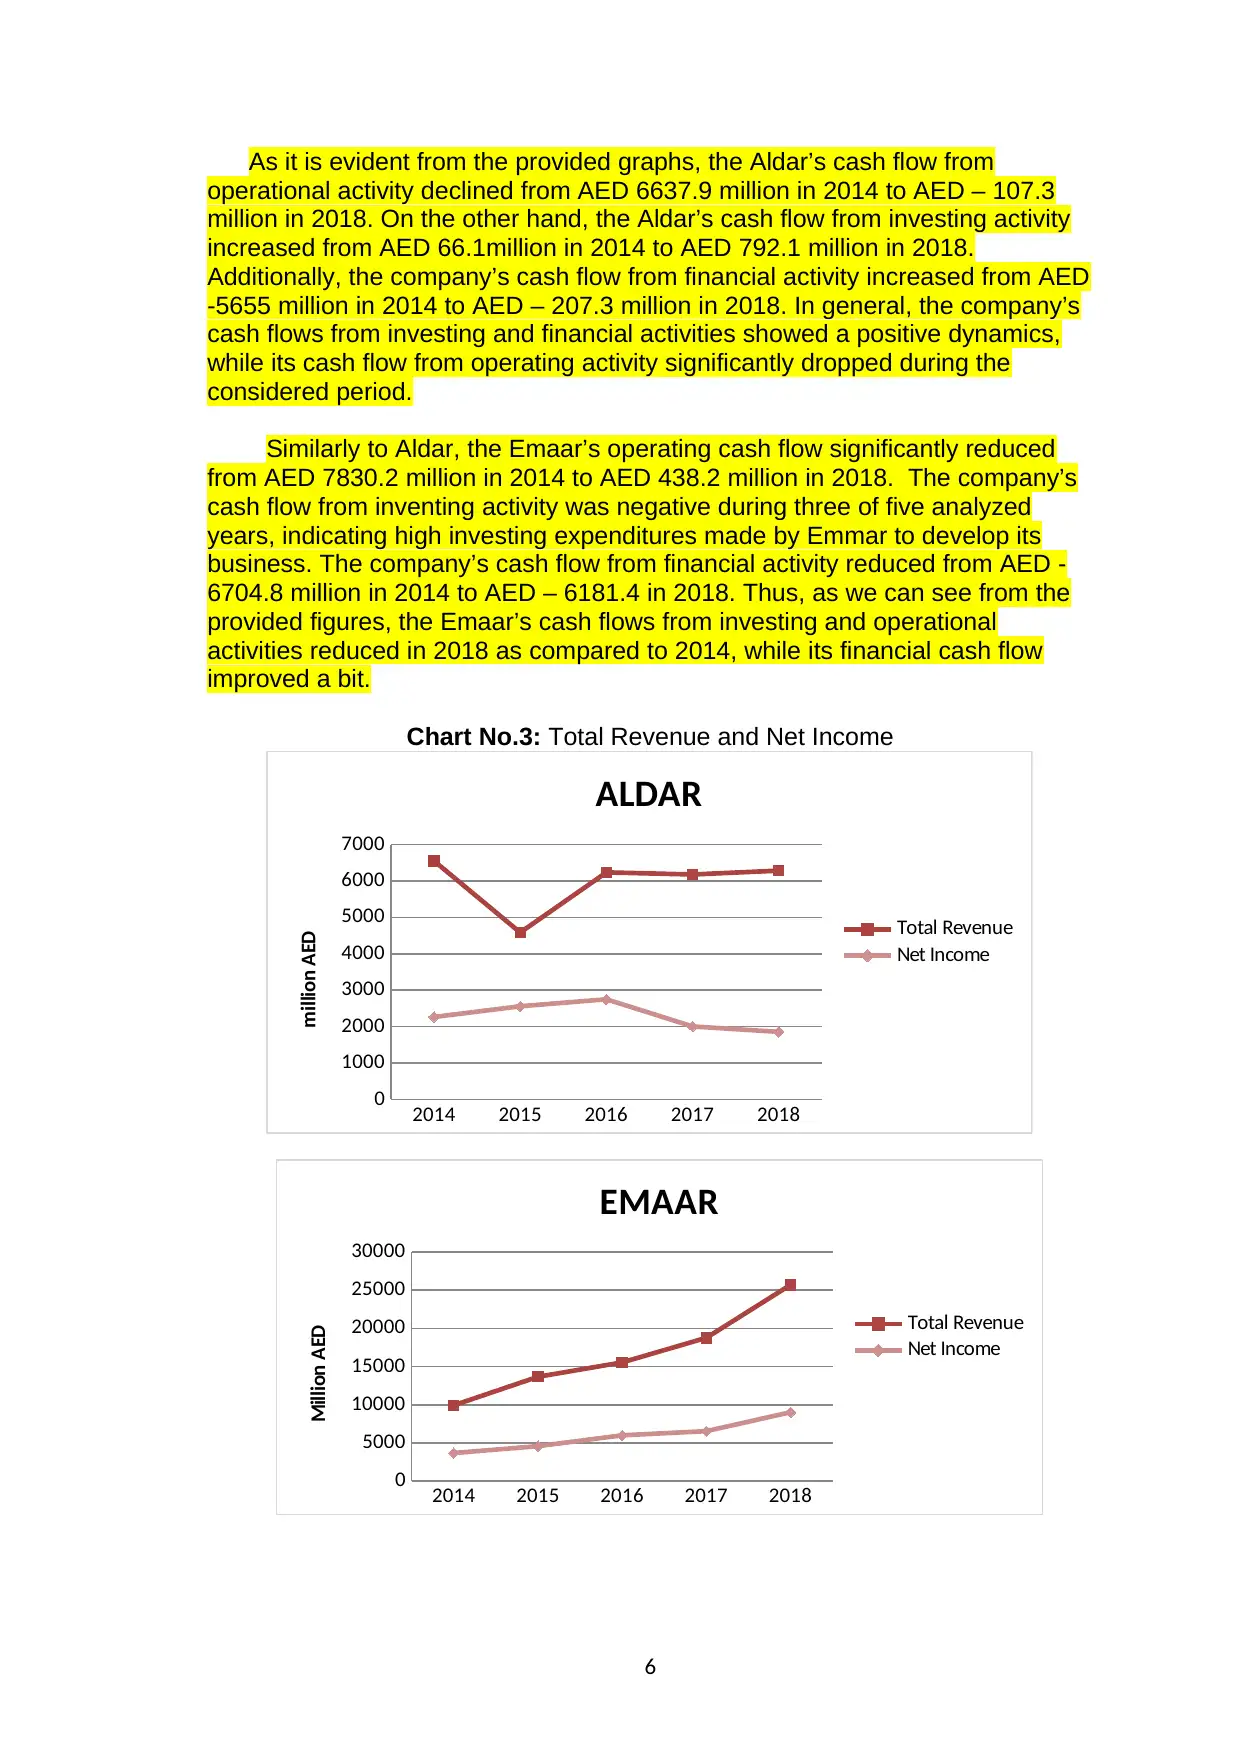
As it is evident from the provided graphs, the Aldar’s cash flow from
operational activity declined from AED 6637.9 million in 2014 to AED – 107.3
million in 2018. On the other hand, the Aldar’s cash flow from investing activity
increased from AED 66.1million in 2014 to AED 792.1 million in 2018.
Additionally, the company’s cash flow from financial activity increased from AED
-5655 million in 2014 to AED – 207.3 million in 2018. In general, the company’s
cash flows from investing and financial activities showed a positive dynamics,
while its cash flow from operating activity significantly dropped during the
considered period.
Similarly to Aldar, the Emaar’s operating cash flow significantly reduced
from AED 7830.2 million in 2014 to AED 438.2 million in 2018. The company’s
cash flow from inventing activity was negative during three of five analyzed
years, indicating high investing expenditures made by Emmar to develop its
business. The company’s cash flow from financial activity reduced from AED -
6704.8 million in 2014 to AED – 6181.4 in 2018. Thus, as we can see from the
provided figures, the Emaar’s cash flows from investing and operational
activities reduced in 2018 as compared to 2014, while its financial cash flow
improved a bit.
Chart No.3: Total Revenue and Net Income
2014 2015 2016 2017 2018
0
1000
2000
3000
4000
5000
6000
7000
ALDAR
Total Revenue
Net Income
million AED
2014 2015 2016 2017 2018
0
5000
10000
15000
20000
25000
30000
EMAAR
Total Revenue
Net Income
Million AED
6
⊘ This is a preview!⊘
Do you want full access?
Subscribe today to unlock all pages.
Trusted by 1+ million students worldwide
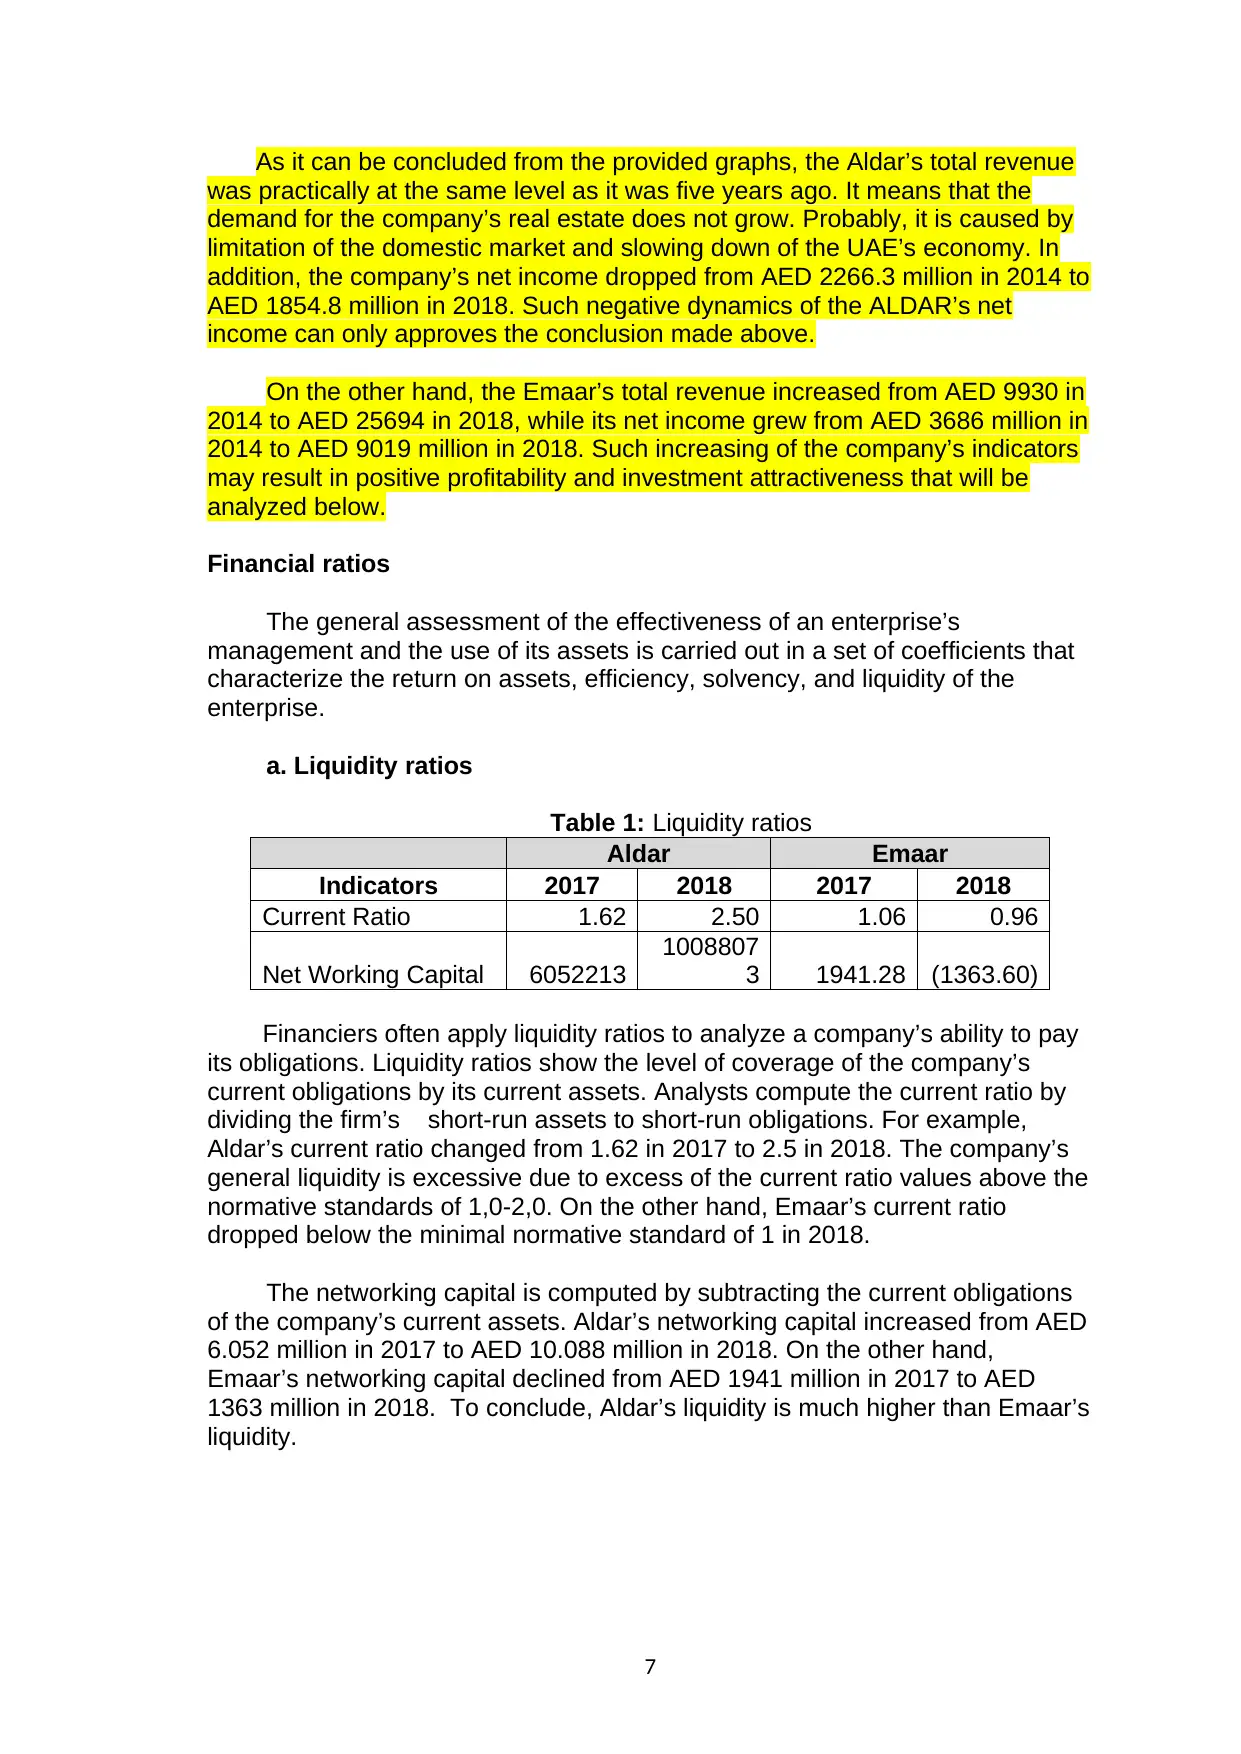
As it can be concluded from the provided graphs, the Aldar’s total revenue
was practically at the same level as it was five years ago. It means that the
demand for the company’s real estate does not grow. Probably, it is caused by
limitation of the domestic market and slowing down of the UAE’s economy. In
addition, the company’s net income dropped from AED 2266.3 million in 2014 to
AED 1854.8 million in 2018. Such negative dynamics of the ALDAR’s net
income can only approves the conclusion made above.
On the other hand, the Emaar’s total revenue increased from AED 9930 in
2014 to AED 25694 in 2018, while its net income grew from AED 3686 million in
2014 to AED 9019 million in 2018. Such increasing of the company’s indicators
may result in positive profitability and investment attractiveness that will be
analyzed below.
Financial ratios
The general assessment of the effectiveness of an enterprise’s
management and the use of its assets is carried out in a set of coefficients that
characterize the return on assets, efficiency, solvency, and liquidity of the
enterprise.
a. Liquidity ratios
Table 1: Liquidity ratios
Aldar Emaar
Indicators 2017 2018 2017 2018
Current Ratio 1.62 2.50 1.06 0.96
Net Working Capital 6052213
1008807
3 1941.28 (1363.60)
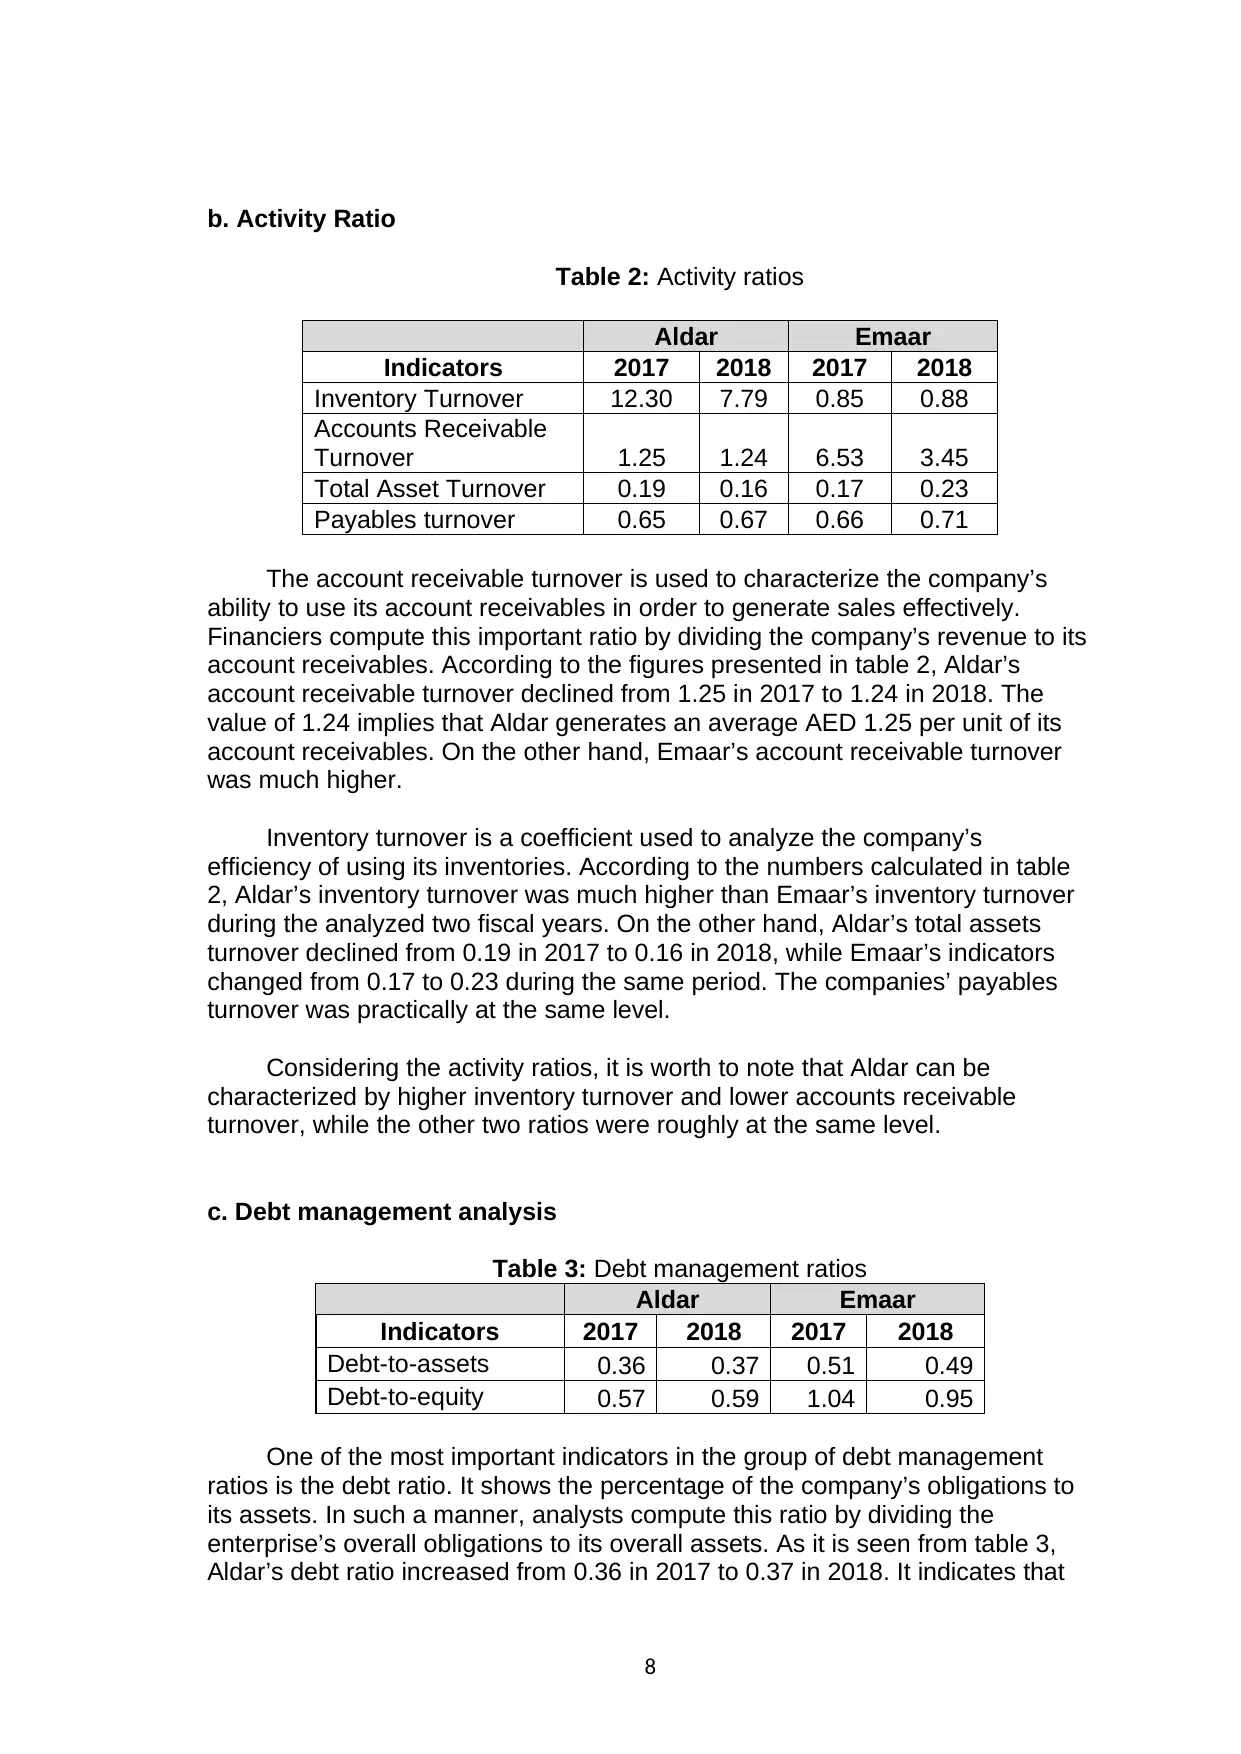
Financiers often apply liquidity ratios to analyze a company’s ability to pay
its obligations. Liquidity ratios show the level of coverage of the company’s
current obligations by its current assets. Analysts compute the current ratio by
dividing the firm’s short-run assets to short-run obligations. For example,
Aldar’s current ratio changed from 1.62 in 2017 to 2.5 in 2018. The company’s
general liquidity is excessive due to excess of the current ratio values above the
normative standards of 1,0-2,0. On the other hand, Emaar’s current ratio
dropped below the minimal normative standard of 1 in 2018.
The networking capital is computed by subtracting the current obligations
of the company’s current assets. Aldar’s networking capital increased from AED
6.052 million in 2017 to AED 10.088 million in 2018. On the other hand,
Emaar’s networking capital declined from AED 1941 million in 2017 to AED
1363 million in 2018. To conclude, Aldar’s liquidity is much higher than Emaar’s
liquidity.
7
was practically at the same level as it was five years ago. It means that the
demand for the company’s real estate does not grow. Probably, it is caused by
limitation of the domestic market and slowing down of the UAE’s economy. In
addition, the company’s net income dropped from AED 2266.3 million in 2014 to
AED 1854.8 million in 2018. Such negative dynamics of the ALDAR’s net
income can only approves the conclusion made above.
On the other hand, the Emaar’s total revenue increased from AED 9930 in
2014 to AED 25694 in 2018, while its net income grew from AED 3686 million in
2014 to AED 9019 million in 2018. Such increasing of the company’s indicators
may result in positive profitability and investment attractiveness that will be
analyzed below.
Financial ratios
The general assessment of the effectiveness of an enterprise’s
management and the use of its assets is carried out in a set of coefficients that
characterize the return on assets, efficiency, solvency, and liquidity of the
enterprise.
a. Liquidity ratios
Table 1: Liquidity ratios
Aldar Emaar
Indicators 2017 2018 2017 2018
Current Ratio 1.62 2.50 1.06 0.96
Net Working Capital 6052213
1008807
3 1941.28 (1363.60)
Financiers often apply liquidity ratios to analyze a company’s ability to pay
its obligations. Liquidity ratios show the level of coverage of the company’s
current obligations by its current assets. Analysts compute the current ratio by
dividing the firm’s short-run assets to short-run obligations. For example,
Aldar’s current ratio changed from 1.62 in 2017 to 2.5 in 2018. The company’s
general liquidity is excessive due to excess of the current ratio values above the
normative standards of 1,0-2,0. On the other hand, Emaar’s current ratio
dropped below the minimal normative standard of 1 in 2018.
The networking capital is computed by subtracting the current obligations
of the company’s current assets. Aldar’s networking capital increased from AED
6.052 million in 2017 to AED 10.088 million in 2018. On the other hand,
Emaar’s networking capital declined from AED 1941 million in 2017 to AED
1363 million in 2018. To conclude, Aldar’s liquidity is much higher than Emaar’s
liquidity.
7
Paraphrase This Document
Need a fresh take? Get an instant paraphrase of this document with our AI Paraphraser
b. Activity Ratio
Table 2: Activity ratios
Aldar Emaar
Indicators 2017 2018 2017 2018
Inventory Turnover 12.30 7.79 0.85 0.88
Accounts Receivable
Turnover 1.25 1.24 6.53 3.45
Total Asset Turnover 0.19 0.16 0.17 0.23
Payables turnover 0.65 0.67 0.66 0.71
The account receivable turnover is used to characterize the company’s
ability to use its account receivables in order to generate sales effectively.
Financiers compute this important ratio by dividing the company’s revenue to its
account receivables. According to the figures presented in table 2, Aldar’s
account receivable turnover declined from 1.25 in 2017 to 1.24 in 2018. The
value of 1.24 implies that Aldar generates an average AED 1.25 per unit of its
account receivables. On the other hand, Emaar’s account receivable turnover
was much higher.
Inventory turnover is a coefficient used to analyze the company’s
efficiency of using its inventories. According to the numbers calculated in table
2, Aldar’s inventory turnover was much higher than Emaar’s inventory turnover
during the analyzed two fiscal years. On the other hand, Aldar’s total assets
turnover declined from 0.19 in 2017 to 0.16 in 2018, while Emaar’s indicators
changed from 0.17 to 0.23 during the same period. The companies’ payables
turnover was practically at the same level.
Considering the activity ratios, it is worth to note that Aldar can be
characterized by higher inventory turnover and lower accounts receivable
turnover, while the other two ratios were roughly at the same level.
c. Debt management analysis
Table 3: Debt management ratios
Aldar Emaar
Indicators 2017 2018 2017 2018
Debt-to-assets 0.36 0.37 0.51 0.49
Debt-to-equity 0.57 0.59 1.04 0.95
One of the most important indicators in the group of debt management
ratios is the debt ratio. It shows the percentage of the company’s obligations to
its assets. In such a manner, analysts compute this ratio by dividing the
enterprise’s overall obligations to its overall assets. As it is seen from table 3,
Aldar’s debt ratio increased from 0.36 in 2017 to 0.37 in 2018. It indicates that
8
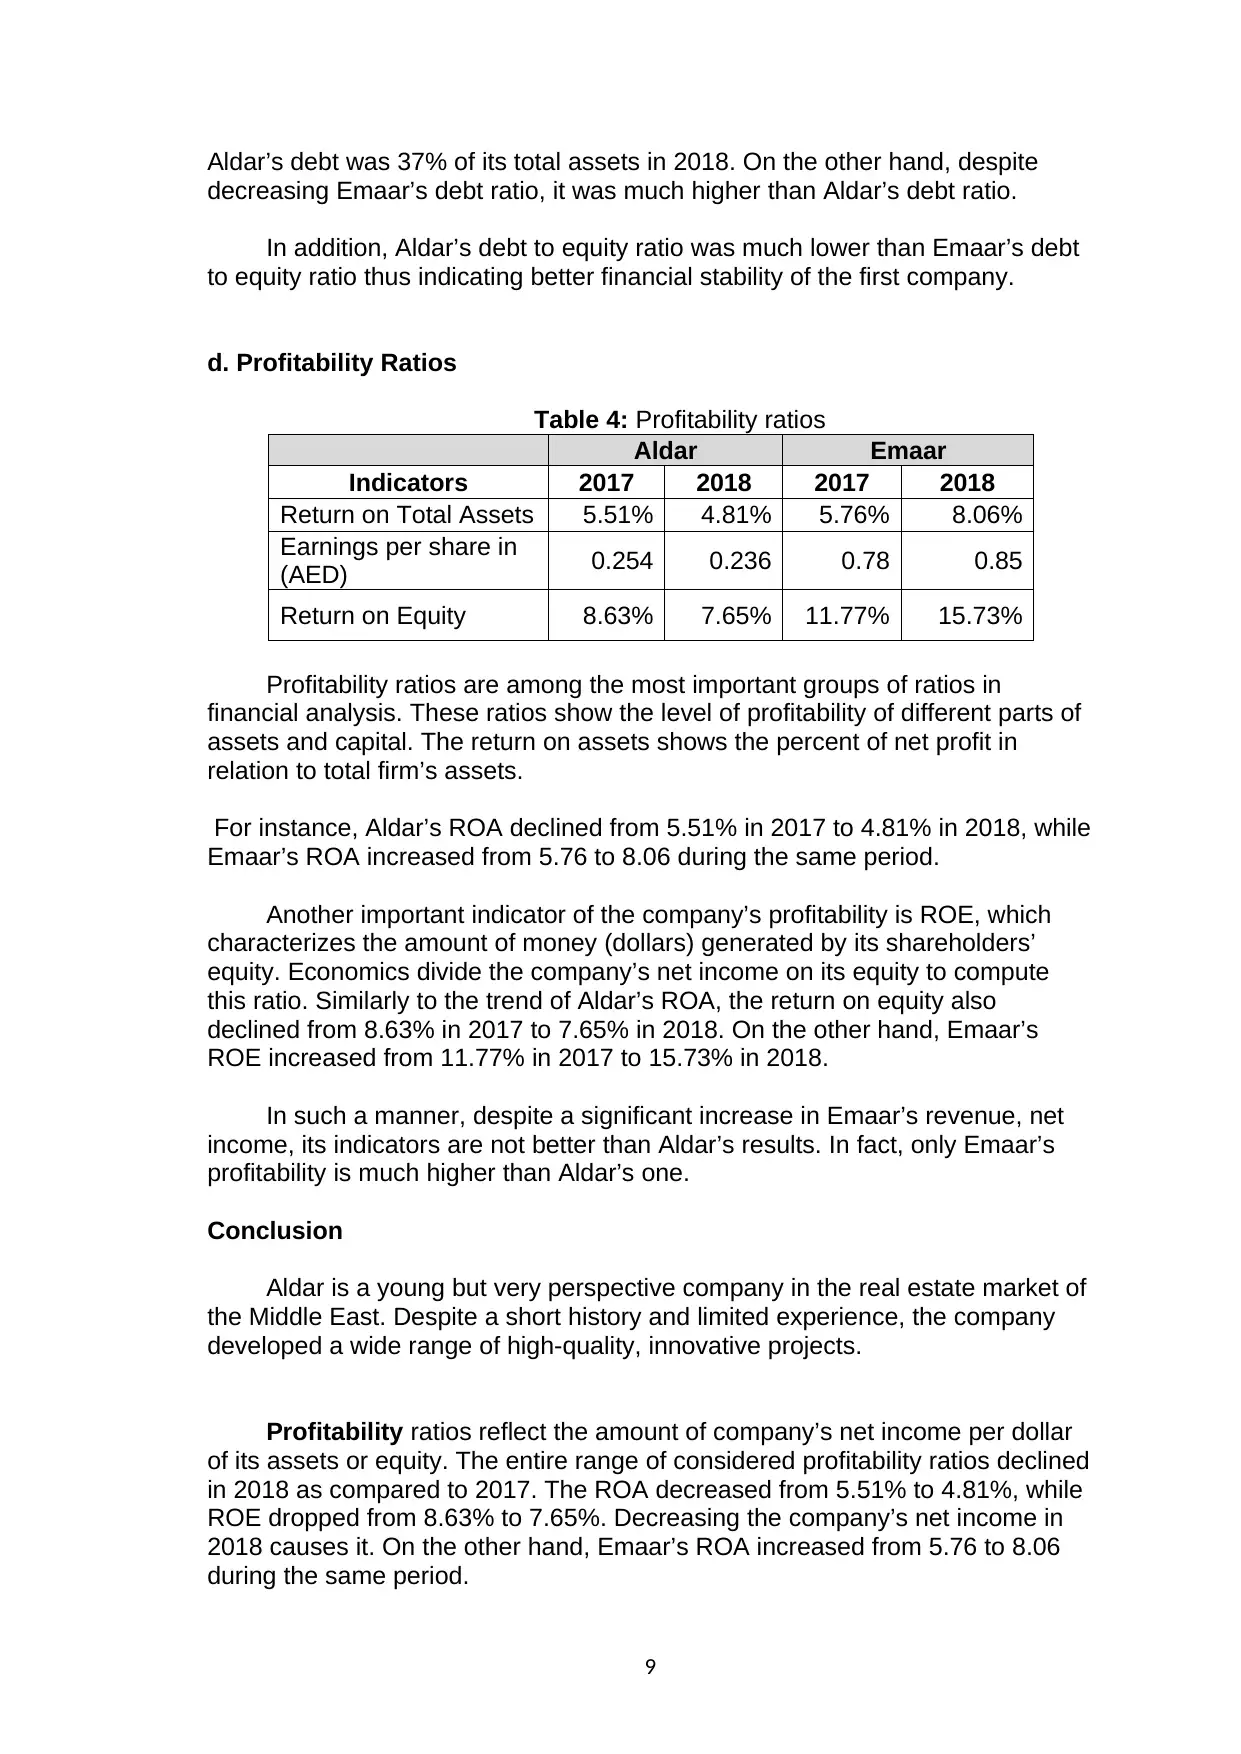
Aldar’s debt was 37% of its total assets in 2018. On the other hand, despite
decreasing Emaar’s debt ratio, it was much higher than Aldar’s debt ratio.
In addition, Aldar’s debt to equity ratio was much lower than Emaar’s debt
to equity ratio thus indicating better financial stability of the first company.
d. Profitability Ratios
Table 4: Profitability ratios
Aldar Emaar
Indicators 2017 2018 2017 2018
Return on Total Assets 5.51% 4.81% 5.76% 8.06%
Earnings per share in
(AED) 0.254 0.236 0.78 0.85
Return on Equity 8.63% 7.65% 11.77% 15.73%
Profitability ratios are among the most important groups of ratios in
financial analysis. These ratios show the level of profitability of different parts of
assets and capital. The return on assets shows the percent of net profit in
relation to total firm’s assets.
For instance, Aldar’s ROA declined from 5.51% in 2017 to 4.81% in 2018, while
Emaar’s ROA increased from 5.76 to 8.06 during the same period.
Another important indicator of the company’s profitability is ROE, which
characterizes the amount of money (dollars) generated by its shareholders’
equity. Economics divide the company’s net income on its equity to compute
this ratio. Similarly to the trend of Aldar’s ROA, the return on equity also
declined from 8.63% in 2017 to 7.65% in 2018. On the other hand, Emaar’s
ROE increased from 11.77% in 2017 to 15.73% in 2018.
In such a manner, despite a significant increase in Emaar’s revenue, net
income, its indicators are not better than Aldar’s results. In fact, only Emaar’s
profitability is much higher than Aldar’s one.
Conclusion
Aldar is a young but very perspective company in the real estate market of
the Middle East. Despite a short history and limited experience, the company
developed a wide range of high-quality, innovative projects.
Profitability ratios reflect the amount of company’s net income per dollar
of its assets or equity. The entire range of considered profitability ratios declined
in 2018 as compared to 2017. The ROA decreased from 5.51% to 4.81%, while
ROE dropped from 8.63% to 7.65%. Decreasing the company’s net income in
2018 causes it. On the other hand, Emaar’s ROA increased from 5.76 to 8.06
during the same period.
9
⊘ This is a preview!⊘
Do you want full access?
Subscribe today to unlock all pages.
Trusted by 1+ million students worldwide
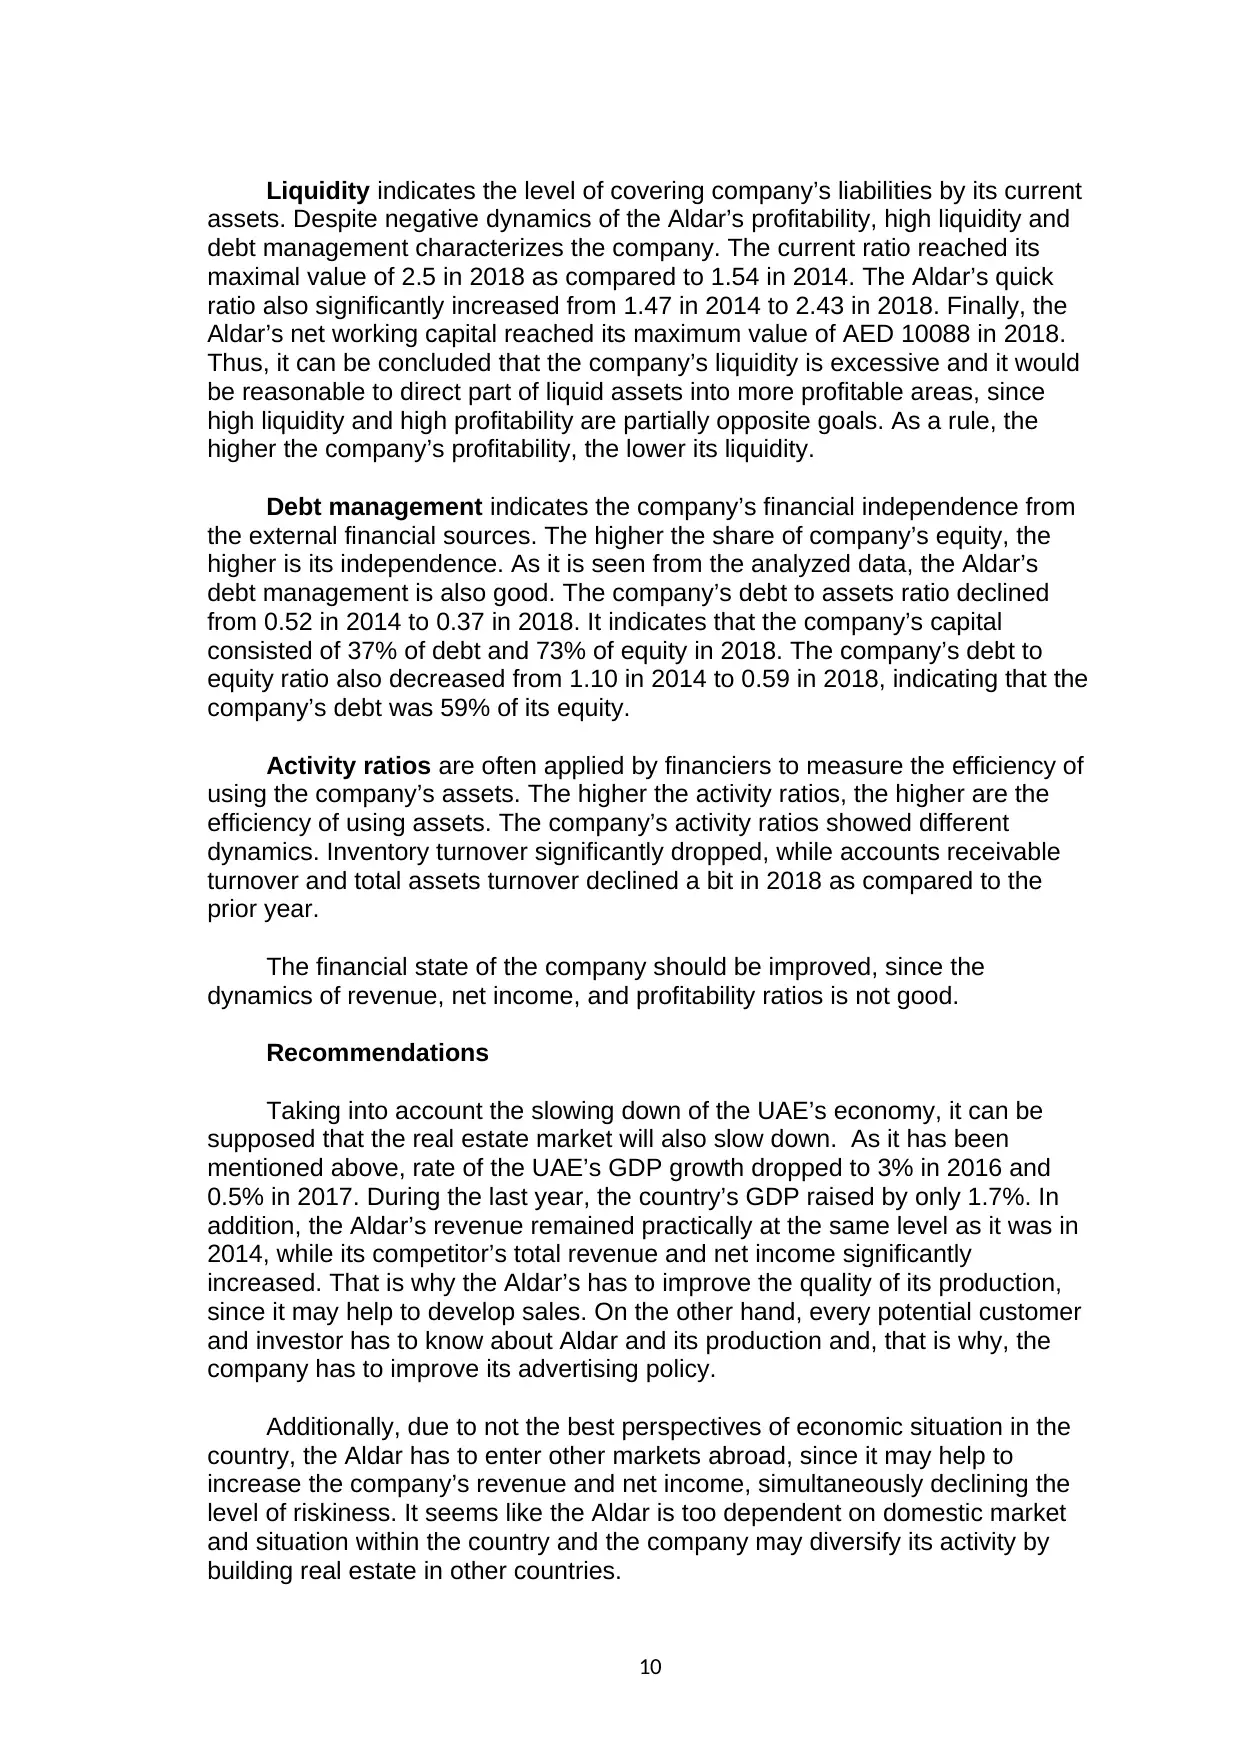
Liquidity indicates the level of covering company’s liabilities by its current
assets. Despite negative dynamics of the Aldar’s profitability, high liquidity and
debt management characterizes the company. The current ratio reached its
maximal value of 2.5 in 2018 as compared to 1.54 in 2014. The Aldar’s quick
ratio also significantly increased from 1.47 in 2014 to 2.43 in 2018. Finally, the
Aldar’s net working capital reached its maximum value of AED 10088 in 2018.
Thus, it can be concluded that the company’s liquidity is excessive and it would
be reasonable to direct part of liquid assets into more profitable areas, since
high liquidity and high profitability are partially opposite goals. As a rule, the
higher the company’s profitability, the lower its liquidity.
Debt management indicates the company’s financial independence from
the external financial sources. The higher the share of company’s equity, the
higher is its independence. As it is seen from the analyzed data, the Aldar’s
debt management is also good. The company’s debt to assets ratio declined
from 0.52 in 2014 to 0.37 in 2018. It indicates that the company’s capital
consisted of 37% of debt and 73% of equity in 2018. The company’s debt to
equity ratio also decreased from 1.10 in 2014 to 0.59 in 2018, indicating that the
company’s debt was 59% of its equity.
Activity ratios are often applied by financiers to measure the efficiency of
using the company’s assets. The higher the activity ratios, the higher are the
efficiency of using assets. The company’s activity ratios showed different
dynamics. Inventory turnover significantly dropped, while accounts receivable
turnover and total assets turnover declined a bit in 2018 as compared to the
prior year.
The financial state of the company should be improved, since the
dynamics of revenue, net income, and profitability ratios is not good.
Recommendations
Taking into account the slowing down of the UAE’s economy, it can be
supposed that the real estate market will also slow down. As it has been
mentioned above, rate of the UAE’s GDP growth dropped to 3% in 2016 and
0.5% in 2017. During the last year, the country’s GDP raised by only 1.7%. In
addition, the Aldar’s revenue remained practically at the same level as it was in
2014, while its competitor’s total revenue and net income significantly
increased. That is why the Aldar’s has to improve the quality of its production,
since it may help to develop sales. On the other hand, every potential customer
and investor has to know about Aldar and its production and, that is why, the
company has to improve its advertising policy.
Additionally, due to not the best perspectives of economic situation in the
country, the Aldar has to enter other markets abroad, since it may help to
increase the company’s revenue and net income, simultaneously declining the
level of riskiness. It seems like the Aldar is too dependent on domestic market
and situation within the country and the company may diversify its activity by
building real estate in other countries.
10
Paraphrase This Document
Need a fresh take? Get an instant paraphrase of this document with our AI Paraphraser
Taking into account the declining of the Aldar’s net income, the company
has to restructure its expenditures, maximizing the profitability. In addition, the
control over the entire range of activities should be improved, since the
company’s cash flows from investing and financial activities showed a positive
dynamics, while its cash flow from operating activity significantly dropped during
the considered period.
In order to improve its perspectives, the company has to invest in new
technologies and qualitative materials applied in building. In addition, the
modern customers are often quite strict and, that is why, the best designers
should be invited to help the company to improve its real estate from qualitative
and aesthetic points of view.
11
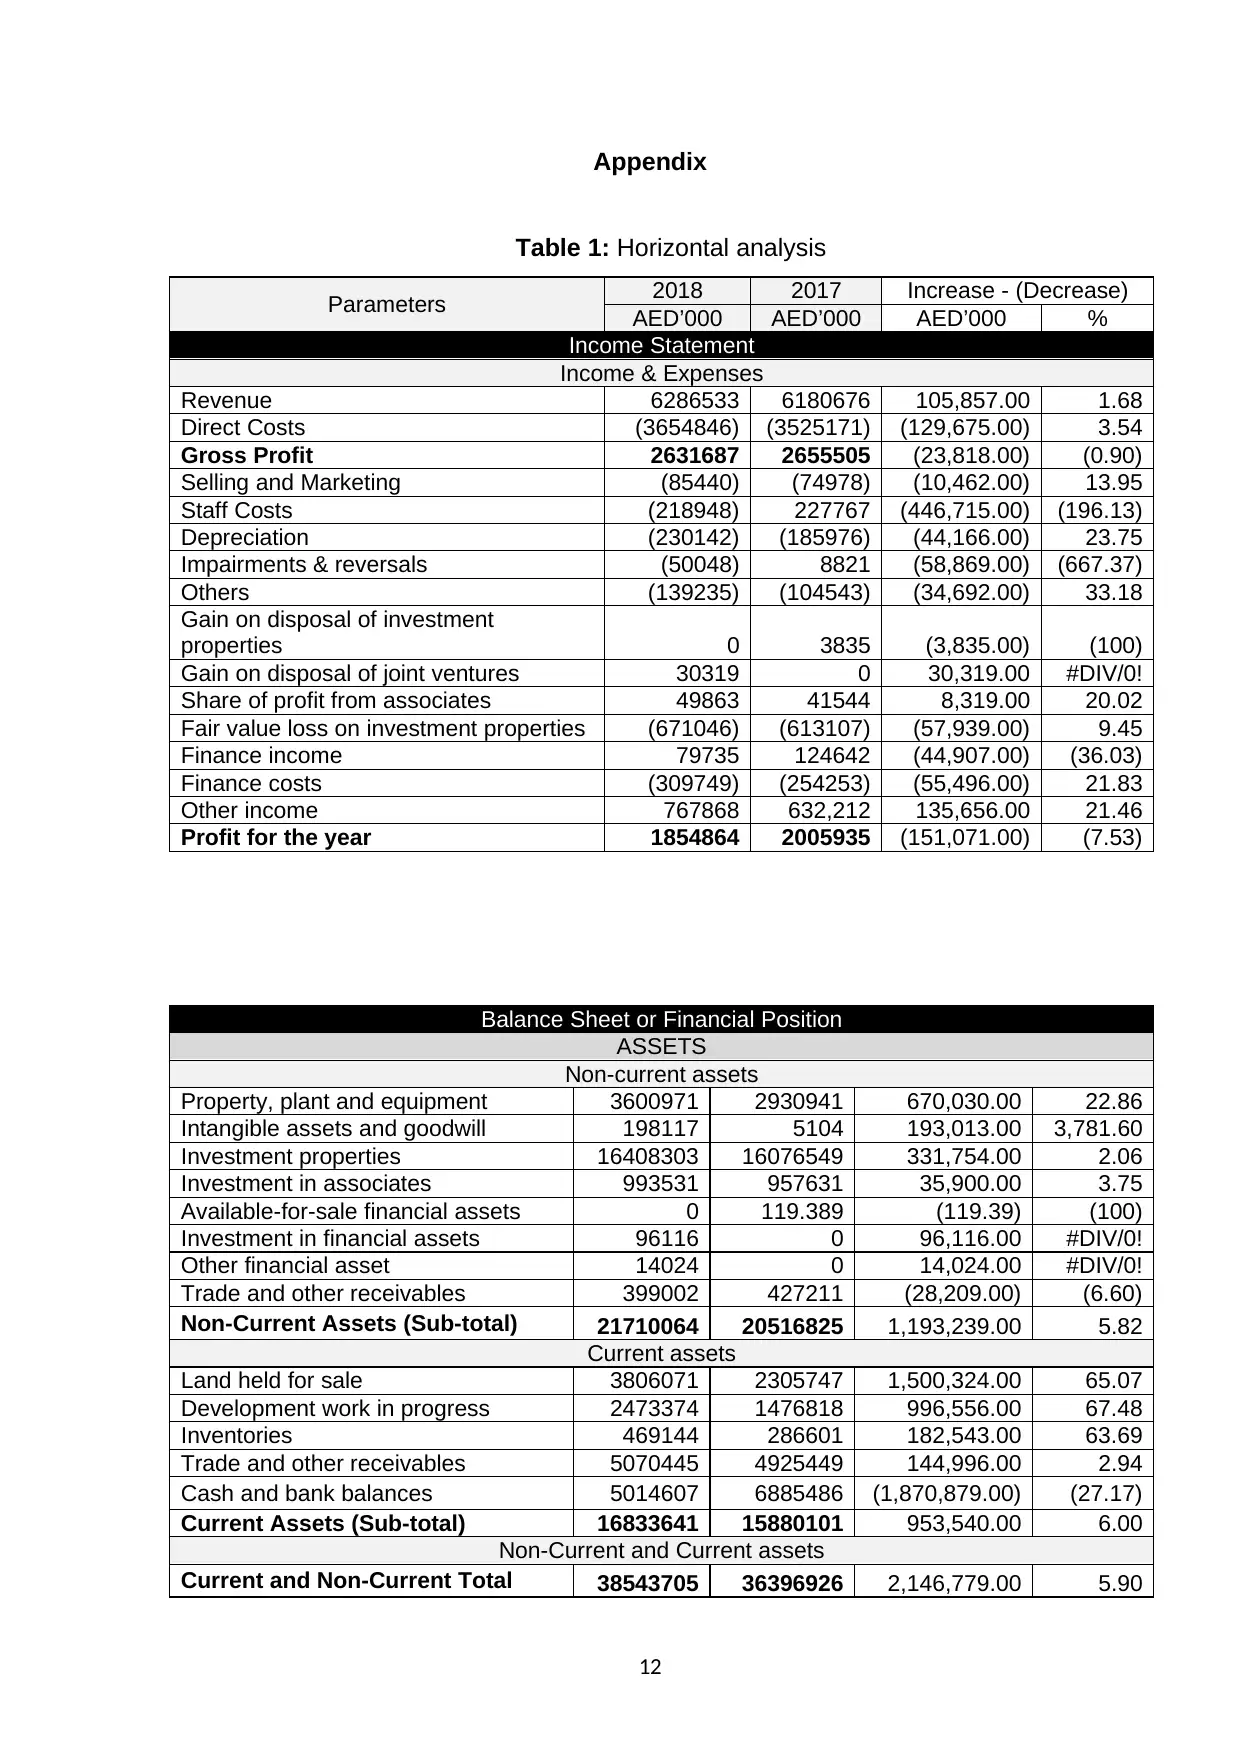
Appendix
Table 1: Horizontal analysis
Parameters 2018 2017 Increase - (Decrease)
AED’000 AED’000 AED’000 %
Income Statement
Income & Expenses
Revenue 6286533 6180676 105,857.00 1.68
Direct Costs (3654846) (3525171) (129,675.00) 3.54
Gross Profit 2631687 2655505 (23,818.00) (0.90)
Selling and Marketing (85440) (74978) (10,462.00) 13.95
Staff Costs (218948) 227767 (446,715.00) (196.13)
Depreciation (230142) (185976) (44,166.00) 23.75
Impairments & reversals (50048) 8821 (58,869.00) (667.37)
Others (139235) (104543) (34,692.00) 33.18
Gain on disposal of investment
properties 0 3835 (3,835.00) (100)
Gain on disposal of joint ventures 30319 0 30,319.00 #DIV/0!
Share of profit from associates 49863 41544 8,319.00 20.02
Fair value loss on investment properties (671046) (613107) (57,939.00) 9.45
Finance income 79735 124642 (44,907.00) (36.03)
Finance costs (309749) (254253) (55,496.00) 21.83
Other income 767868 632,212 135,656.00 21.46
Profit for the year 1854864 2005935 (151,071.00) (7.53)
Balance Sheet or Financial Position
ASSETS
Non-current assets
Property, plant and equipment 3600971 2930941 670,030.00 22.86
Intangible assets and goodwill 198117 5104 193,013.00 3,781.60
Investment properties 16408303 16076549 331,754.00 2.06
Investment in associates 993531 957631 35,900.00 3.75
Available-for-sale financial assets 0 119.389 (119.39) (100)
Investment in financial assets 96116 0 96,116.00 #DIV/0!
Other financial asset 14024 0 14,024.00 #DIV/0!
Trade and other receivables 399002 427211 (28,209.00) (6.60)
Non-Current Assets (Sub-total) 21710064 20516825 1,193,239.00 5.82
Current assets
Land held for sale 3806071 2305747 1,500,324.00 65.07
Development work in progress 2473374 1476818 996,556.00 67.48
Inventories 469144 286601 182,543.00 63.69
Trade and other receivables 5070445 4925449 144,996.00 2.94
Cash and bank balances 5014607 6885486 (1,870,879.00) (27.17)
Current Assets (Sub-total) 16833641 15880101 953,540.00 6.00
Non-Current and Current assets
Current and Non-Current Total 38543705 36396926 2,146,779.00 5.90
12
⊘ This is a preview!⊘
Do you want full access?
Subscribe today to unlock all pages.
Trusted by 1+ million students worldwide
1 out of 20
Related Documents


Your All-in-One AI-Powered Toolkit for Academic Success.
+13062052269
info@desklib.com
Available 24*7 on WhatsApp / Email
![[object Object]](/_next/static/media/star-bottom.7253800d.svg)
Unlock your academic potential
Copyright © 2020–2026 A2Z Services. All Rights Reserved. Developed and managed by ZUCOL.