Financial Reporting Analysis: Sakae Holdings and Soup Restaurant
VerifiedAdded on 2020/05/28
|14
|4227
|58
Report
AI Summary
This report presents a comparative financial analysis of Sakae Holdings and Soup Restaurant, both listed on the Singapore Stock Exchange. The analysis encompasses a two-year review of profitability, liquidity, asset efficiency, and gearing ratios. The report delves into key financial metrics such as gross margin, net margin, return on capital employed, return on equity, current ratio, quick ratio, asset turnover, and earnings per share. The discussion highlights the trends and implications of these ratios for each company, providing insights into their financial health and operational efficiency. The report includes a reflection on the learning journey undertaken during the analysis, offering a comprehensive overview of the financial performance and comparative strengths and weaknesses of the two companies.
Running head: FINANCIAL REPORTING
Financial Reporting of Singapore Telecommunications Limited (Sakae Holdings) and Soup
Restaurant
Name of the University:
Name of the Student:
Authors Note:
Financial Reporting of Singapore Telecommunications Limited (Sakae Holdings) and Soup
Restaurant
Name of the University:
Name of the Student:
Authors Note:
Paraphrase This Document
Need a fresh take? Get an instant paraphrase of this document with our AI Paraphraser
1FINANCIAL REPORTING
Table of Contents
Part 1....................................................................................................................................2
Introduction......................................................................................................................2
Background of Companies..................................................................................................2
Discussion........................................................................................................................2
Profitability Ratios.......................................................................................................2
Liquidity Ratios...........................................................................................................4
Asset Efficiency Ratios................................................................................................5
Gearing Ratios.............................................................................................................7
Conclusion.......................................................................................................................9
Part 2..................................................................................................................................10
Reflection.......................................................................................................................10
References..........................................................................................................................11
2FINANCIAL REPORTING
Part 1
Introduction
The objective of the paper is to conduct a comparative analysis of the selected companies
Sakae Holdings and Soup Restaurant that is listed in Singapore stock exchange. Moreover, a
comparative summary for two years regarding the selected companies’ profitability, liquidity,
asset efficiency and gearing will be provided within the report. Additionally, a reflective
statement associated with the learning journey of the report will also be provided.
Background of Companies
Soup Restaurant is positioned as among the best niche restaurant in Chinatown that offers
herbal soups and home cooked food at affordable costs (Almamy, Aston & Ngwa, 2016). Sakae
Holdings is a renowned restaurant that offers quality dining Sushi, crepes and cream and catering
services. Both these companies are listed in Singapore Exchange Limited.
Discussion
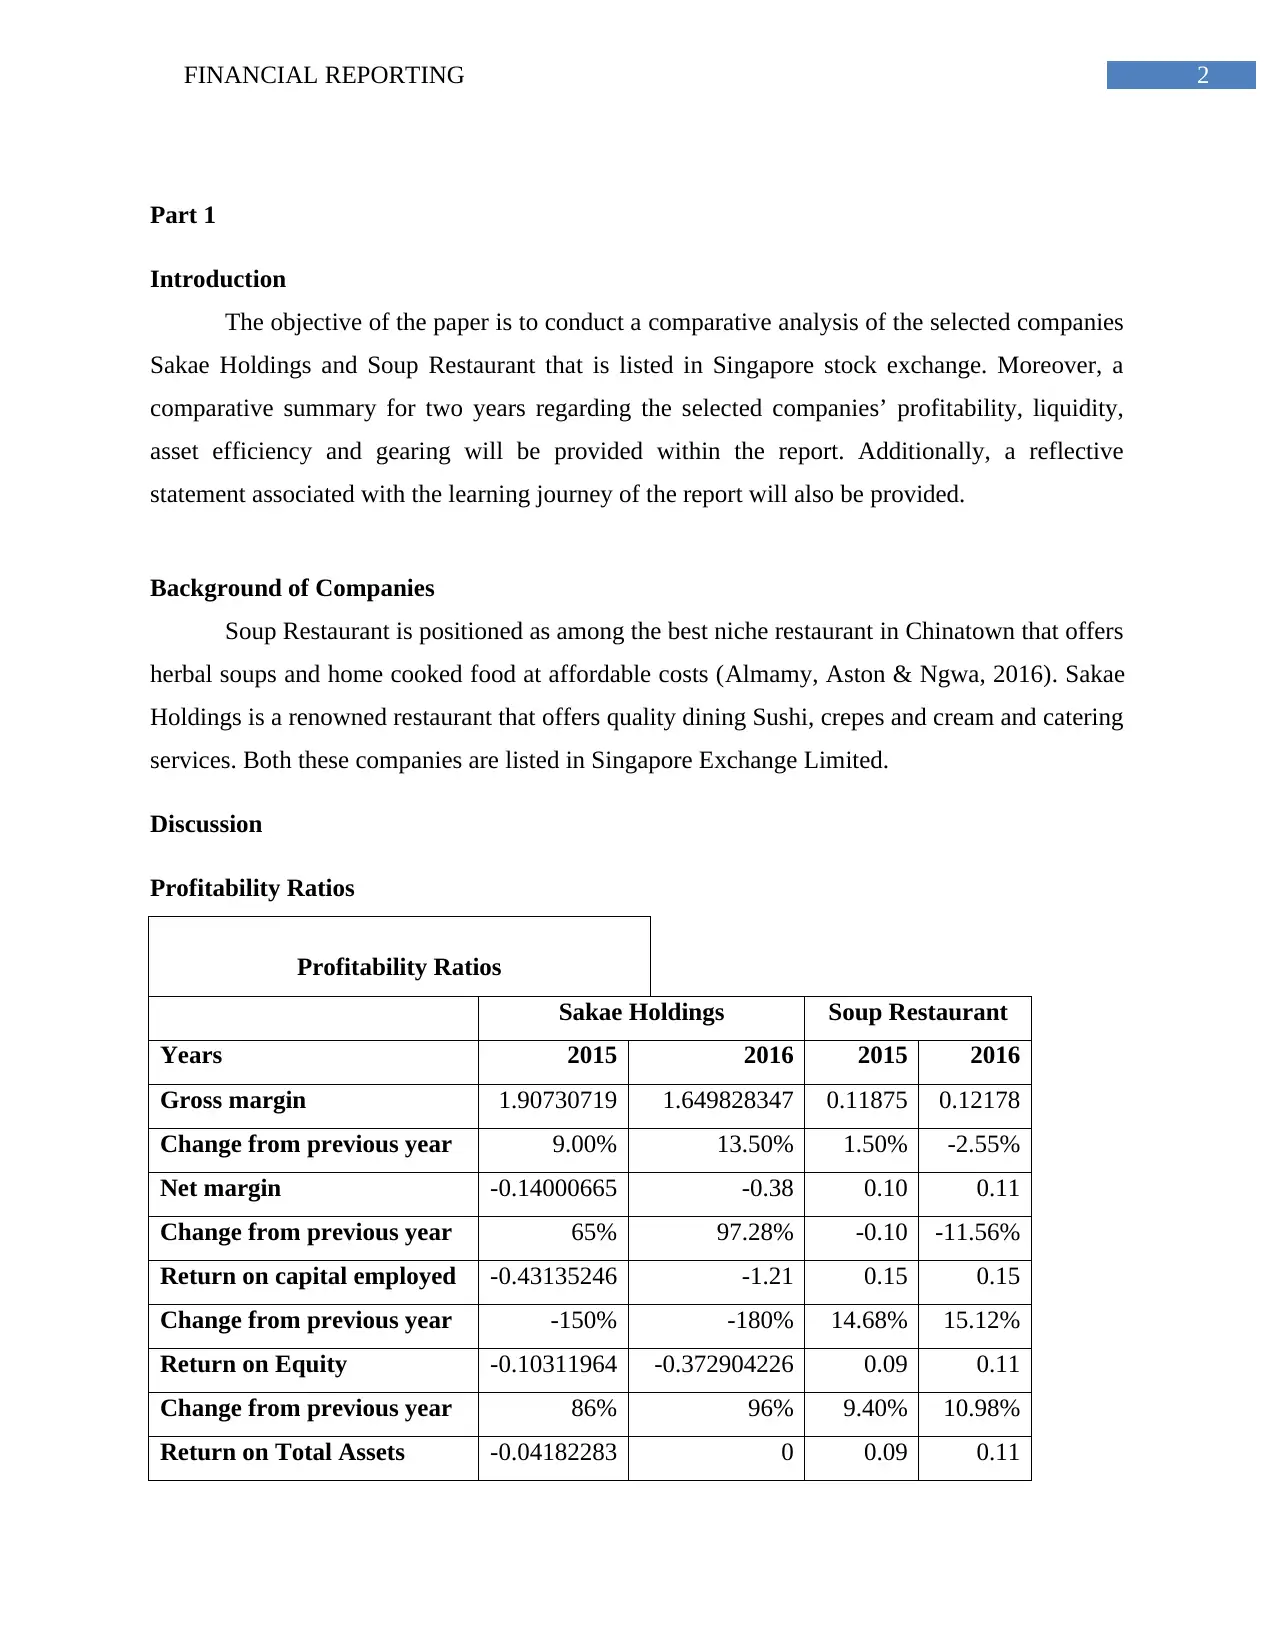
Profitability Ratios
Profitability Ratios
Sakae Holdings Soup Restaurant
Years 2015 2016 2015 2016
Gross margin 1.90730719 1.649828347 0.11875 0.12178
Change from previous year 9.00% 13.50% 1.50% -2.55%
Net margin -0.14000665 -0.38 0.10 0.11
Change from previous year 65% 97.28% -0.10 -11.56%
Return on capital employed -0.43135246 -1.21 0.15 0.15
Change from previous year -150% -180% 14.68% 15.12%
Return on Equity -0.10311964 -0.372904226 0.09 0.11
Change from previous year 86% 96% 9.40% 10.98%
Return on Total Assets -0.04182283 0 0.09 0.11
Part 1
Introduction
The objective of the paper is to conduct a comparative analysis of the selected companies
Sakae Holdings and Soup Restaurant that is listed in Singapore stock exchange. Moreover, a
comparative summary for two years regarding the selected companies’ profitability, liquidity,
asset efficiency and gearing will be provided within the report. Additionally, a reflective
statement associated with the learning journey of the report will also be provided.
Background of Companies
Soup Restaurant is positioned as among the best niche restaurant in Chinatown that offers
herbal soups and home cooked food at affordable costs (Almamy, Aston & Ngwa, 2016). Sakae
Holdings is a renowned restaurant that offers quality dining Sushi, crepes and cream and catering
services. Both these companies are listed in Singapore Exchange Limited.
Discussion
Profitability Ratios
Profitability Ratios
Sakae Holdings Soup Restaurant
Years 2015 2016 2015 2016
Gross margin 1.90730719 1.649828347 0.11875 0.12178
Change from previous year 9.00% 13.50% 1.50% -2.55%
Net margin -0.14000665 -0.38 0.10 0.11
Change from previous year 65% 97.28% -0.10 -11.56%
Return on capital employed -0.43135246 -1.21 0.15 0.15
Change from previous year -150% -180% 14.68% 15.12%
Return on Equity -0.10311964 -0.372904226 0.09 0.11
Change from previous year 86% 96% 9.40% 10.98%
Return on Total Assets -0.04182283 0 0.09 0.11
⊘ This is a preview!⊘
Do you want full access?
Subscribe today to unlock all pages.
Trusted by 1+ million students worldwide
3FINANCIAL REPORTING
Change from previous year 97% 108% 9% 11%
Gross Margin
Gross margin ratio is important in measuring how much efficient will be the companies
in their business operations. Gross margin ratio of Sakae Holdings is observed to decrease by
13.50% in the year 2016 in comparison to Soup Restaurant Company that is observed to increase
from the year 2015 to year 2016 by 2.55% (Altman et al.2017). Such increasing trend of this
ratio indicates that the company retains increased amount on every dollar of its sales in order to
service its debt obligations along with other costs. Sakae Holding’s decreasing percentage
indicates a decrease in competitiveness of the company’s services and products (Sakae Holdings,
2018). It also signifies overall profitability of the company is getting poor each year with
decreased sales of its products.
Net Margin
Net margin ratio is important in indicating profitability of a company. Net margin ratio of
Sakae Holdings Company is observed to decrease by 97% from the year 2015 to year 2016 (Kou,
Peng & Wang, 2014). Such decrease is observed because of the reason that financial health of
the company is poor than Soup Restaurant Company and this signifies the company is proficient
enough in transforming its revenue into profits which is further available for all its shareholders.
It can also be gathered from the results of the company that it has less parentage of revenue left
after all expenses are decreased from the sales and it is extracting less amount of profit after its
total sales. Net margin ratio of Soup Restaurant Company is observed to increase by 11.56%
from the year 2015 to year 2016. This indicates that the company is efficient enough in
converting its revenue into profits. This also signifies the business performance of the company
is not that effective in facilitating it to attain enough net margins.
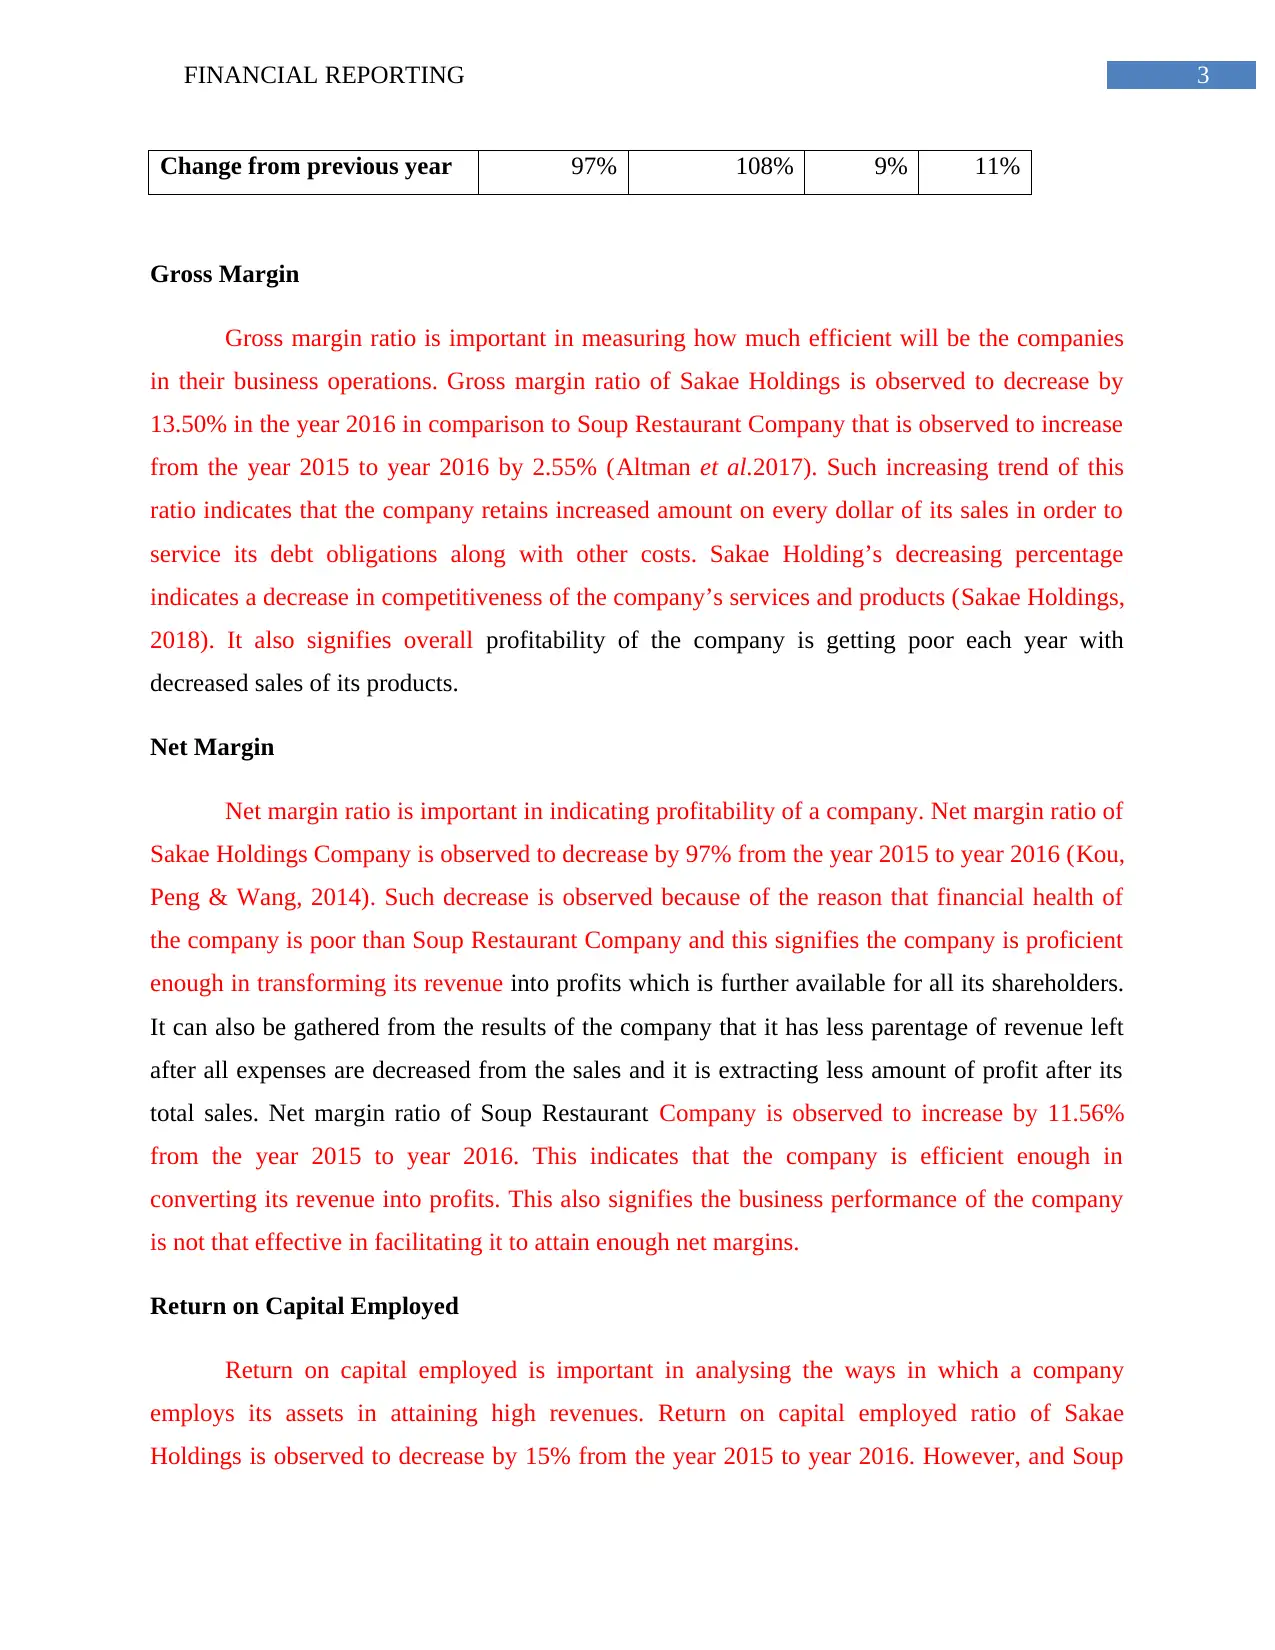
Return on Capital Employed
Return on capital employed is important in analysing the ways in which a company
employs its assets in attaining high revenues. Return on capital employed ratio of Sakae
Holdings is observed to decrease by 15% from the year 2015 to year 2016. However, and Soup
Change from previous year 97% 108% 9% 11%
Gross Margin
Gross margin ratio is important in measuring how much efficient will be the companies
in their business operations. Gross margin ratio of Sakae Holdings is observed to decrease by
13.50% in the year 2016 in comparison to Soup Restaurant Company that is observed to increase
from the year 2015 to year 2016 by 2.55% (Altman et al.2017). Such increasing trend of this
ratio indicates that the company retains increased amount on every dollar of its sales in order to
service its debt obligations along with other costs. Sakae Holding’s decreasing percentage
indicates a decrease in competitiveness of the company’s services and products (Sakae Holdings,
2018). It also signifies overall profitability of the company is getting poor each year with
decreased sales of its products.
Net Margin
Net margin ratio is important in indicating profitability of a company. Net margin ratio of
Sakae Holdings Company is observed to decrease by 97% from the year 2015 to year 2016 (Kou,
Peng & Wang, 2014). Such decrease is observed because of the reason that financial health of
the company is poor than Soup Restaurant Company and this signifies the company is proficient
enough in transforming its revenue into profits which is further available for all its shareholders.
It can also be gathered from the results of the company that it has less parentage of revenue left
after all expenses are decreased from the sales and it is extracting less amount of profit after its
total sales. Net margin ratio of Soup Restaurant Company is observed to increase by 11.56%
from the year 2015 to year 2016. This indicates that the company is efficient enough in
converting its revenue into profits. This also signifies the business performance of the company
is not that effective in facilitating it to attain enough net margins.
Return on Capital Employed
Return on capital employed is important in analysing the ways in which a company
employs its assets in attaining high revenues. Return on capital employed ratio of Sakae
Holdings is observed to decrease by 15% from the year 2015 to year 2016. However, and Soup
Paraphrase This Document
Need a fresh take? Get an instant paraphrase of this document with our AI Paraphraser
4FINANCIAL REPORTING
Restaurant Company has constant ROCE in both 2015 and 2016. Such results indicate that
company’s performance within the capital intensive sectors like the restaurants. This does not
offer a good indication regarding these companies financial performance of the significant debt
(Sakae Holdings, 2018). Moreover, such decreasing and fixed trend of return of capital employed
makes it clear that these companies might occasionally have an inordinate cash amount in hand
but as the cash is not actively used within the business. There are some limitations in using this
ratio as it considers that the companies require increasing this ratio for the reason that the
investors are likely to favour the organizations with stable and increasing return on capital
employed ratio.
Return on Equity
Return in equity facilitates in analysing the company’s capability in attaining profit for
every dollar invested by shareholders. Return on equity of Sakae is observed to decrease over the
years from 2015 to 2016, while the situation is just the opposite for Soup. This is because of the
reason that Sakae Holdings is not that capable in attaining increased profit for every dollar of
common shareholders’ equity (Sakae Holdings, 2018).
Return on Total Assets
Return on total assets of both the companies is observed to decrease for Sakae and
increase for Soup Restaurant over the years from 2015 to 2016. This is because of the reason that
Sakae Company is highly capable to attain increased profit percentage in comparison to its
overall resources that is not same in case of Soup Restaurant because of which it is attaining less
profit (Sakae Holdings, 2018).
Liquidity Ratios
Liquidity Ratios
Sakae Holdings Soup Restaurant
Years 2015 2016 2015 2016
Current ratio 1 0.43 2.45 2.02
Change from previous year 31.00% 33.42% 15% 17.36%
Quick ratio 0.586722962 0.39 2.41 1.99
Change from previous year 58.67% 39.01% 15% -17%
5FINANCIAL REPORTING
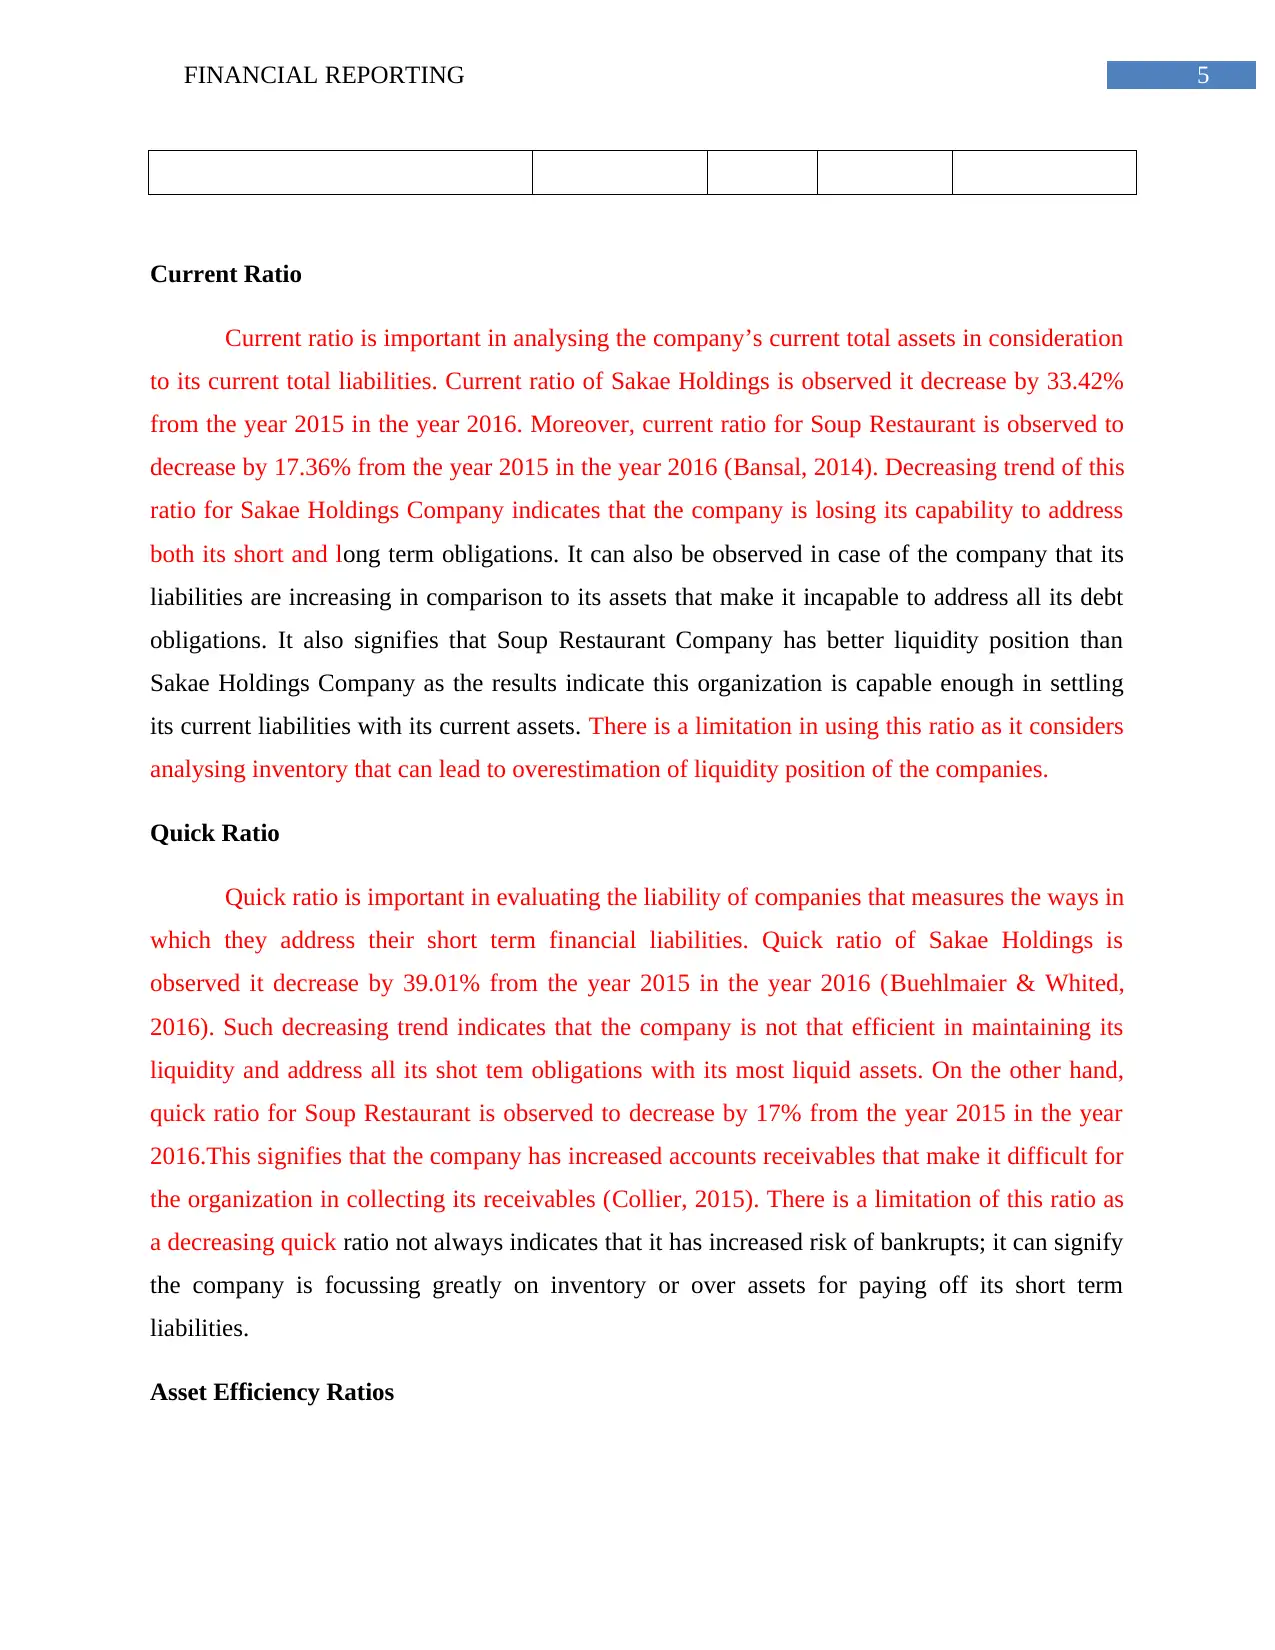
Current Ratio
Current ratio is important in analysing the company’s current total assets in consideration
to its current total liabilities. Current ratio of Sakae Holdings is observed it decrease by 33.42%
from the year 2015 in the year 2016. Moreover, current ratio for Soup Restaurant is observed to
decrease by 17.36% from the year 2015 in the year 2016 (Bansal, 2014). Decreasing trend of this
ratio for Sakae Holdings Company indicates that the company is losing its capability to address
both its short and long term obligations. It can also be observed in case of the company that its
liabilities are increasing in comparison to its assets that make it incapable to address all its debt
obligations. It also signifies that Soup Restaurant Company has better liquidity position than
Sakae Holdings Company as the results indicate this organization is capable enough in settling
its current liabilities with its current assets. There is a limitation in using this ratio as it considers
analysing inventory that can lead to overestimation of liquidity position of the companies.
Quick Ratio
Quick ratio is important in evaluating the liability of companies that measures the ways in
which they address their short term financial liabilities. Quick ratio of Sakae Holdings is
observed it decrease by 39.01% from the year 2015 in the year 2016 (Buehlmaier & Whited,
2016). Such decreasing trend indicates that the company is not that efficient in maintaining its
liquidity and address all its shot tem obligations with its most liquid assets. On the other hand,
quick ratio for Soup Restaurant is observed to decrease by 17% from the year 2015 in the year
2016.This signifies that the company has increased accounts receivables that make it difficult for
the organization in collecting its receivables (Collier, 2015). There is a limitation of this ratio as
a decreasing quick ratio not always indicates that it has increased risk of bankrupts; it can signify
the company is focussing greatly on inventory or over assets for paying off its short term
liabilities.
Asset Efficiency Ratios
⊘ This is a preview!⊘
Do you want full access?
Subscribe today to unlock all pages.
Trusted by 1+ million students worldwide
6FINANCIAL REPORTING
Efficiency Ratios
Sakae Holdings Soup Restaurant
Years
201
5 2016 2015 2016
Average inventory 12 14 46 47
Change from previous year 11% 13% 2% 3%
Asset turnover ratio 0.30 0.30 0.09 0.11
Change from previous year 0 0 15% 17%
Receivables turnover (in days) 9 17 0 0.00
Change from previous year 85% 90% 0 0
Inventory turnover (in days) 12 14 3.06 3.48
Change from previous year 11% 13% 12% 14%
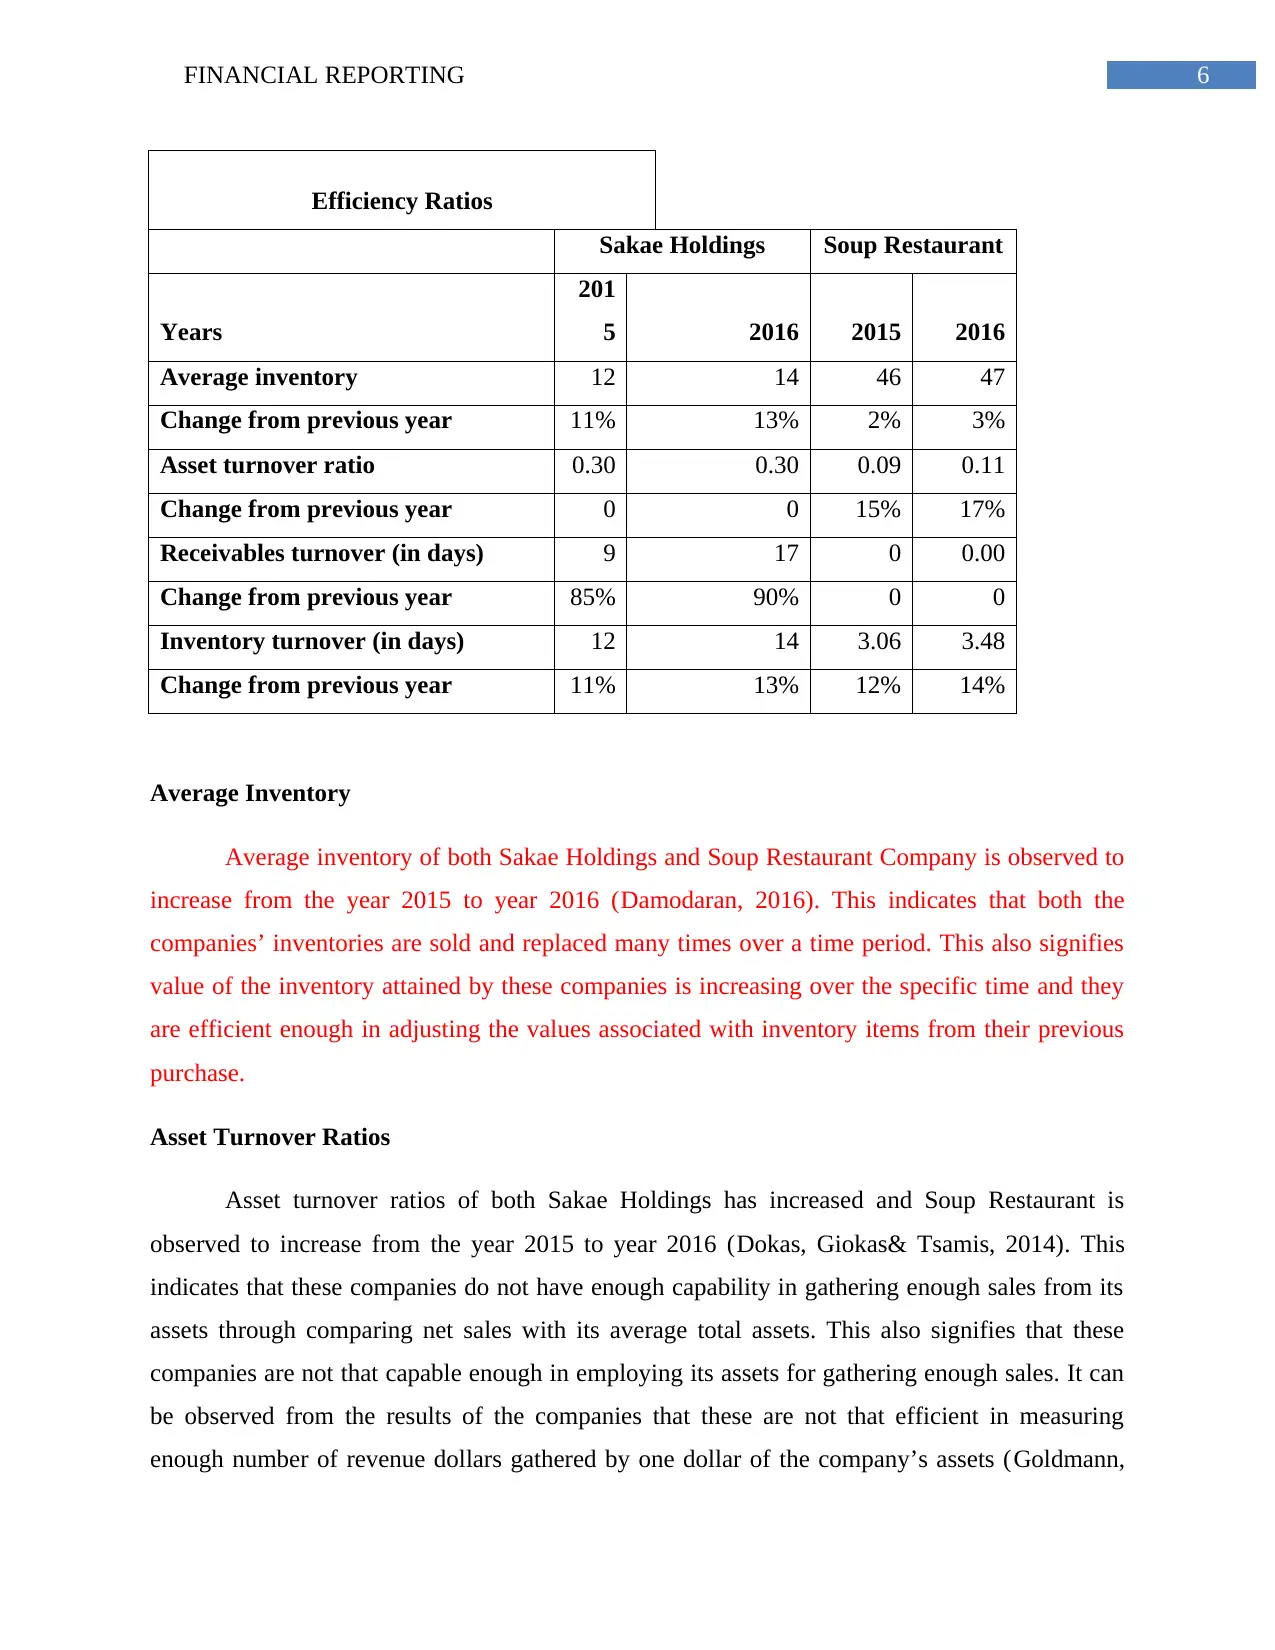
Average Inventory
Average inventory of both Sakae Holdings and Soup Restaurant Company is observed to
increase from the year 2015 to year 2016 (Damodaran, 2016). This indicates that both the
companies’ inventories are sold and replaced many times over a time period. This also signifies
value of the inventory attained by these companies is increasing over the specific time and they
are efficient enough in adjusting the values associated with inventory items from their previous
purchase.
Asset Turnover Ratios
Asset turnover ratios of both Sakae Holdings has increased and Soup Restaurant is
observed to increase from the year 2015 to year 2016 (Dokas, Giokas& Tsamis, 2014). This
indicates that these companies do not have enough capability in gathering enough sales from its
assets through comparing net sales with its average total assets. This also signifies that these
companies are not that capable enough in employing its assets for gathering enough sales. It can
be observed from the results of the companies that these are not that efficient in measuring
enough number of revenue dollars gathered by one dollar of the company’s assets (Goldmann,
Efficiency Ratios
Sakae Holdings Soup Restaurant
Years
201
5 2016 2015 2016
Average inventory 12 14 46 47
Change from previous year 11% 13% 2% 3%
Asset turnover ratio 0.30 0.30 0.09 0.11
Change from previous year 0 0 15% 17%
Receivables turnover (in days) 9 17 0 0.00
Change from previous year 85% 90% 0 0
Inventory turnover (in days) 12 14 3.06 3.48
Change from previous year 11% 13% 12% 14%
Average Inventory
Average inventory of both Sakae Holdings and Soup Restaurant Company is observed to
increase from the year 2015 to year 2016 (Damodaran, 2016). This indicates that both the
companies’ inventories are sold and replaced many times over a time period. This also signifies
value of the inventory attained by these companies is increasing over the specific time and they
are efficient enough in adjusting the values associated with inventory items from their previous
purchase.
Asset Turnover Ratios
Asset turnover ratios of both Sakae Holdings has increased and Soup Restaurant is
observed to increase from the year 2015 to year 2016 (Dokas, Giokas& Tsamis, 2014). This
indicates that these companies do not have enough capability in gathering enough sales from its
assets through comparing net sales with its average total assets. This also signifies that these
companies are not that capable enough in employing its assets for gathering enough sales. It can
be observed from the results of the companies that these are not that efficient in measuring
enough number of revenue dollars gathered by one dollar of the company’s assets (Goldmann,
Paraphrase This Document
Need a fresh take? Get an instant paraphrase of this document with our AI Paraphraser
7FINANCIAL REPORTING
2017). The value of these companies’ sales and revenues gathered in comparison to its assets
value is deemed to be lesser as signified by lower asset turnover ratio of these companies.
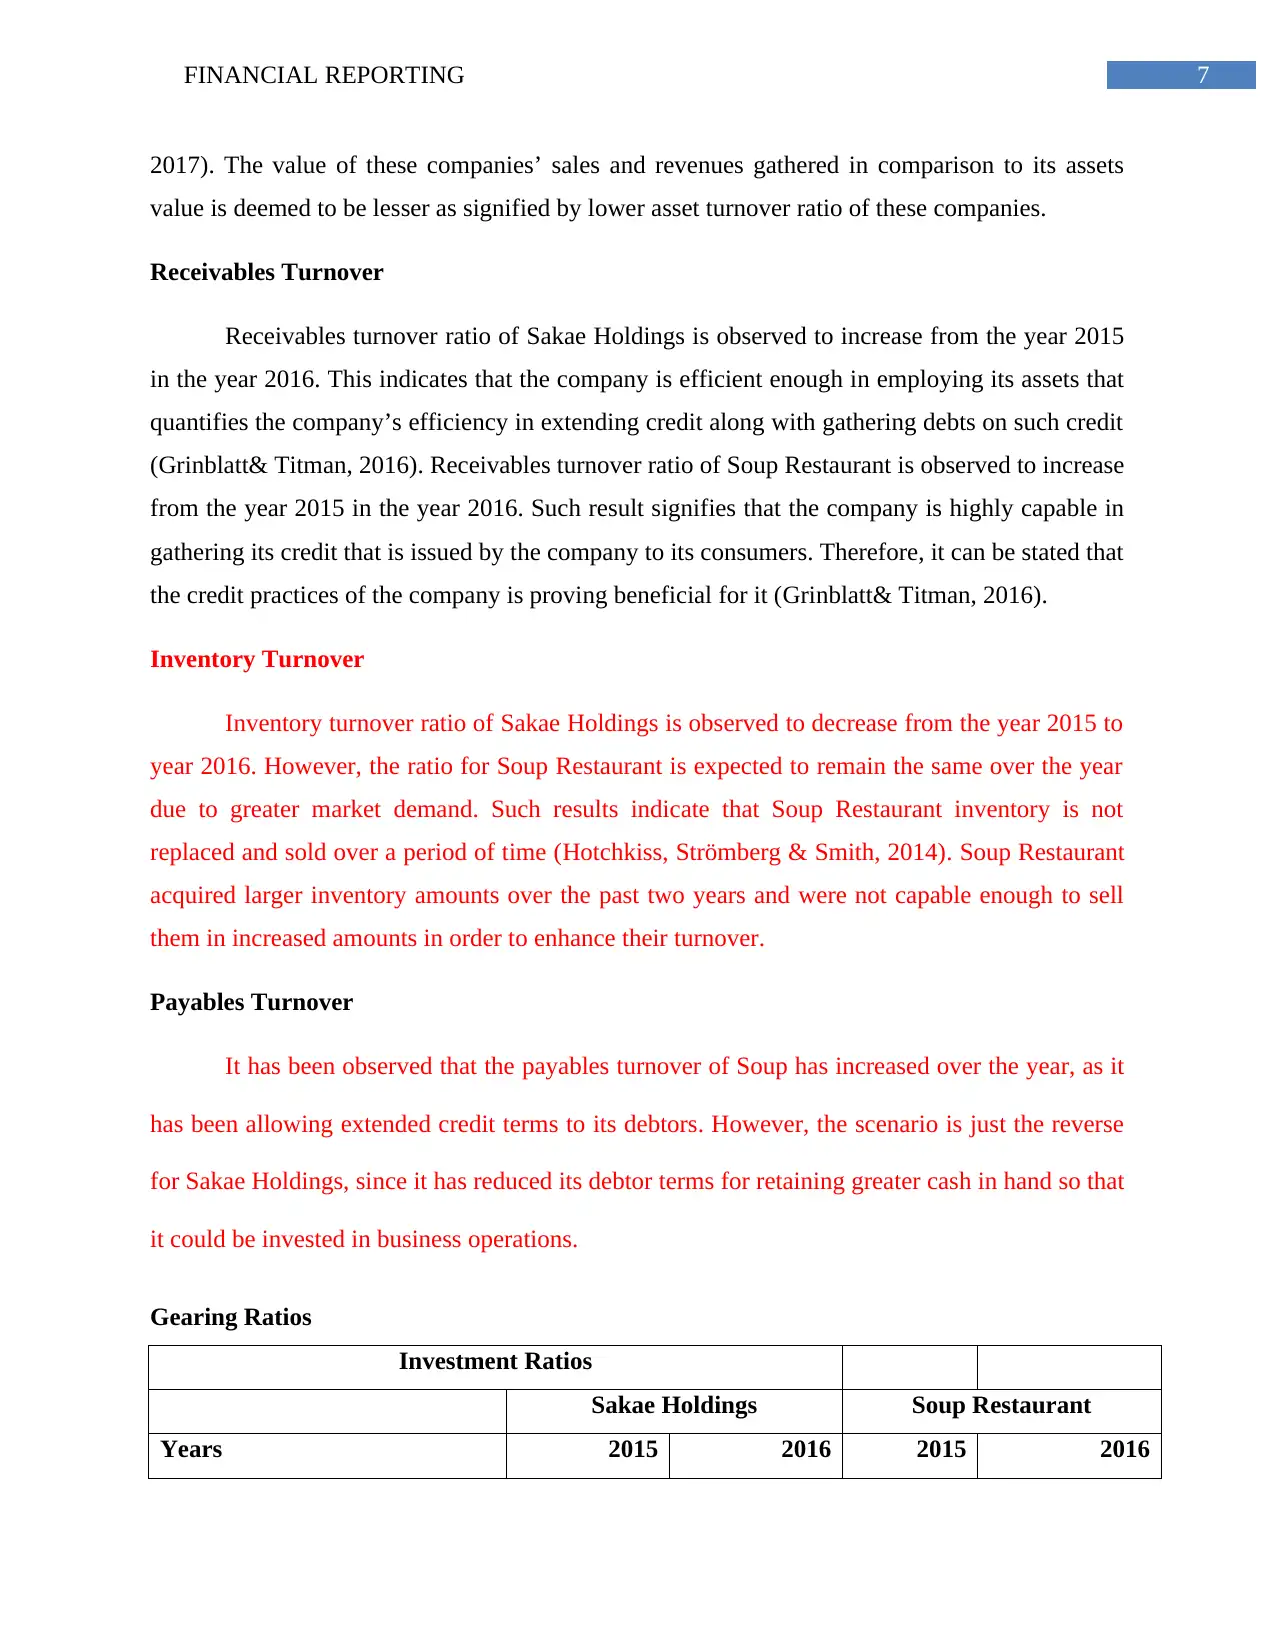
Receivables Turnover
Receivables turnover ratio of Sakae Holdings is observed to increase from the year 2015
in the year 2016. This indicates that the company is efficient enough in employing its assets that
quantifies the company’s efficiency in extending credit along with gathering debts on such credit
(Grinblatt& Titman, 2016). Receivables turnover ratio of Soup Restaurant is observed to increase
from the year 2015 in the year 2016. Such result signifies that the company is highly capable in
gathering its credit that is issued by the company to its consumers. Therefore, it can be stated that
the credit practices of the company is proving beneficial for it (Grinblatt& Titman, 2016).
Inventory Turnover
Inventory turnover ratio of Sakae Holdings is observed to decrease from the year 2015 to
year 2016. However, the ratio for Soup Restaurant is expected to remain the same over the year
due to greater market demand. Such results indicate that Soup Restaurant inventory is not
replaced and sold over a period of time (Hotchkiss, Strömberg & Smith, 2014). Soup Restaurant
acquired larger inventory amounts over the past two years and were not capable enough to sell
them in increased amounts in order to enhance their turnover.
Payables Turnover
It has been observed that the payables turnover of Soup has increased over the year, as it
has been allowing extended credit terms to its debtors. However, the scenario is just the reverse
for Sakae Holdings, since it has reduced its debtor terms for retaining greater cash in hand so that
it could be invested in business operations.
Gearing Ratios
Investment Ratios
Sakae Holdings Soup Restaurant
Years 2015 2016 2015 2016
2017). The value of these companies’ sales and revenues gathered in comparison to its assets
value is deemed to be lesser as signified by lower asset turnover ratio of these companies.
Receivables Turnover
Receivables turnover ratio of Sakae Holdings is observed to increase from the year 2015
in the year 2016. This indicates that the company is efficient enough in employing its assets that
quantifies the company’s efficiency in extending credit along with gathering debts on such credit
(Grinblatt& Titman, 2016). Receivables turnover ratio of Soup Restaurant is observed to increase
from the year 2015 in the year 2016. Such result signifies that the company is highly capable in
gathering its credit that is issued by the company to its consumers. Therefore, it can be stated that
the credit practices of the company is proving beneficial for it (Grinblatt& Titman, 2016).
Inventory Turnover
Inventory turnover ratio of Sakae Holdings is observed to decrease from the year 2015 to
year 2016. However, the ratio for Soup Restaurant is expected to remain the same over the year
due to greater market demand. Such results indicate that Soup Restaurant inventory is not
replaced and sold over a period of time (Hotchkiss, Strömberg & Smith, 2014). Soup Restaurant
acquired larger inventory amounts over the past two years and were not capable enough to sell
them in increased amounts in order to enhance their turnover.
Payables Turnover
It has been observed that the payables turnover of Soup has increased over the year, as it
has been allowing extended credit terms to its debtors. However, the scenario is just the reverse
for Sakae Holdings, since it has reduced its debtor terms for retaining greater cash in hand so that
it could be invested in business operations.
Gearing Ratios
Investment Ratios
Sakae Holdings Soup Restaurant
Years 2015 2016 2015 2016
8FINANCIAL REPORTING
Earnings per share -32.6126761 -92.82 0.34 0.35
Change from previous year 170% 185% -2% -3%
Interest cover ratio 5 15 7 16
Change from previous year 160% 168% 120% 125%
Price earnings ratio -0.01165191 -0.003231925 0.4 0.47
Change from previous year -68% -72% 7% 18%
Dividend cover ratio 0 0 0 0
Change from previous year 0 0 0 0
Dividend yield ratio 0 0
-
15,300,379 -10,125,044
Change from previous year 0 0 -30% -34%
Capital gearing ratio 33.97049924 26.34795764 0.21 0.03
Change from previous year -20% -22% -85% -87%
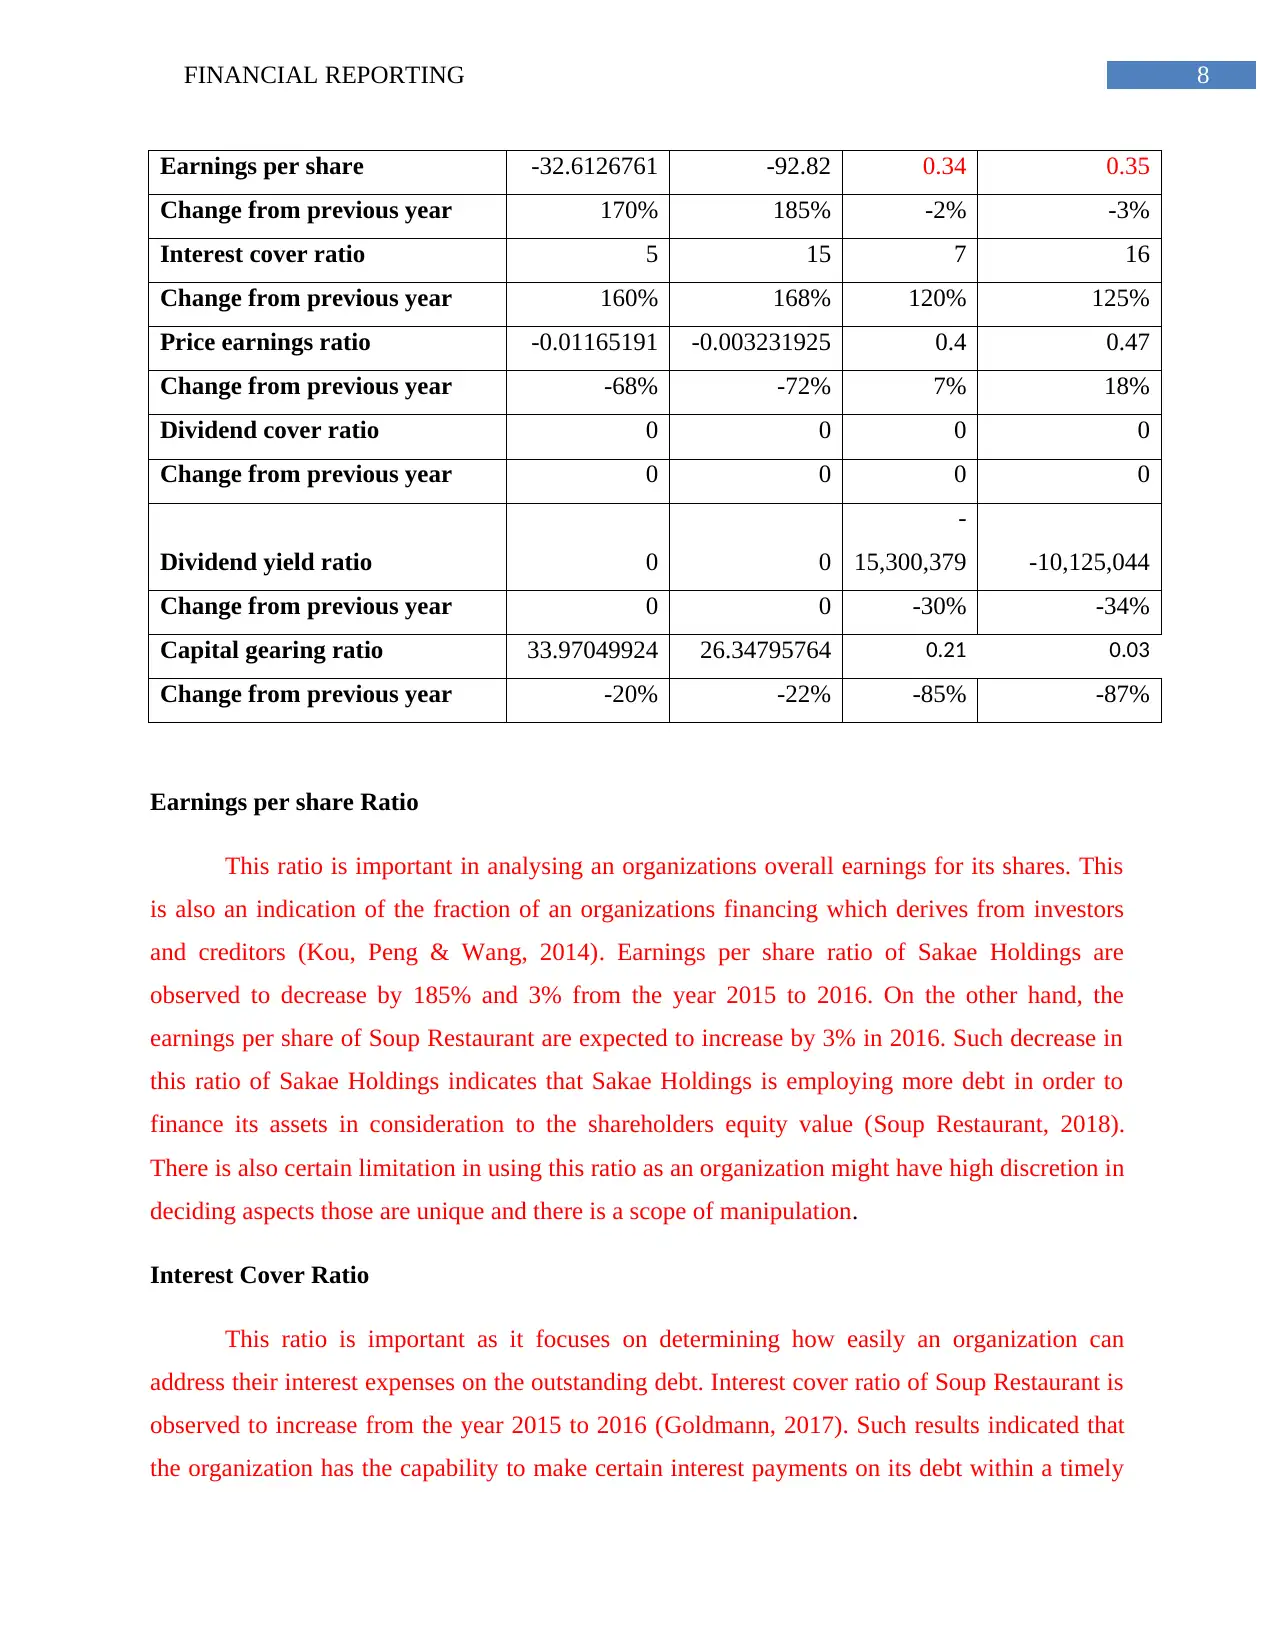
Earnings per share Ratio
This ratio is important in analysing an organizations overall earnings for its shares. This
is also an indication of the fraction of an organizations financing which derives from investors
and creditors (Kou, Peng & Wang, 2014). Earnings per share ratio of Sakae Holdings are
observed to decrease by 185% and 3% from the year 2015 to 2016. On the other hand, the
earnings per share of Soup Restaurant are expected to increase by 3% in 2016. Such decrease in
this ratio of Sakae Holdings indicates that Sakae Holdings is employing more debt in order to
finance its assets in consideration to the shareholders equity value (Soup Restaurant, 2018).
There is also certain limitation in using this ratio as an organization might have high discretion in
deciding aspects those are unique and there is a scope of manipulation.
Interest Cover Ratio
This ratio is important as it focuses on determining how easily an organization can
address their interest expenses on the outstanding debt. Interest cover ratio of Soup Restaurant is
observed to increase from the year 2015 to 2016 (Goldmann, 2017). Such results indicated that
the organization has the capability to make certain interest payments on its debt within a timely
Earnings per share -32.6126761 -92.82 0.34 0.35
Change from previous year 170% 185% -2% -3%
Interest cover ratio 5 15 7 16
Change from previous year 160% 168% 120% 125%
Price earnings ratio -0.01165191 -0.003231925 0.4 0.47
Change from previous year -68% -72% 7% 18%
Dividend cover ratio 0 0 0 0
Change from previous year 0 0 0 0
Dividend yield ratio 0 0
-
15,300,379 -10,125,044
Change from previous year 0 0 -30% -34%
Capital gearing ratio 33.97049924 26.34795764 0.21 0.03
Change from previous year -20% -22% -85% -87%
Earnings per share Ratio
This ratio is important in analysing an organizations overall earnings for its shares. This
is also an indication of the fraction of an organizations financing which derives from investors
and creditors (Kou, Peng & Wang, 2014). Earnings per share ratio of Sakae Holdings are
observed to decrease by 185% and 3% from the year 2015 to 2016. On the other hand, the
earnings per share of Soup Restaurant are expected to increase by 3% in 2016. Such decrease in
this ratio of Sakae Holdings indicates that Sakae Holdings is employing more debt in order to
finance its assets in consideration to the shareholders equity value (Soup Restaurant, 2018).
There is also certain limitation in using this ratio as an organization might have high discretion in
deciding aspects those are unique and there is a scope of manipulation.
Interest Cover Ratio
This ratio is important as it focuses on determining how easily an organization can
address their interest expenses on the outstanding debt. Interest cover ratio of Soup Restaurant is
observed to increase from the year 2015 to 2016 (Goldmann, 2017). Such results indicated that
the organization has the capability to make certain interest payments on its debt within a timely
⊘ This is a preview!⊘
Do you want full access?
Subscribe today to unlock all pages.
Trusted by 1+ million students worldwide
9FINANCIAL REPORTING
manner. On the other hand, the ratio for Sakae Holdings has decreased in the same year denoting
its fall in capability to meet its interest expense with operating income. As this ratio is indicating
a increasing trend which makes sure that Soup is making enough money in addressing all its
interest payments. If this ratio keeps on increasing then it can be considered less risky that will
never attain a high bank financing (Grinblatt& Titman, 2016). However, there are certain
limitations of employing this ratio as this ratio at times fails to provide a clear picture of the
company’s stability with regards to defaults and certain interest payments. This ratio keeps on
fluctuating that questions the reliability of the results.
Price earnings ratio
Price earnings ratio has significance in evaluating the company’s increased growth in
future. Price earnings ratio of both Sakae Holdings and Soup Restaurant Company is observed to
decrease by 72% and 18% from the year 2015 to year 2016. As these companies are losing
money they are observed to have very less or no price earnings ratio. This indicates that for both
the companies the investors are not willing to pay an increased amount per dollar of its earnings
(Sakae Holdings, 2018). However, there are certain limitations of using this ratio as this employs
estimated earnings in order to attain high price earnings ratio.
Dividend cover ratio
Dividend cover ratio is vital in analysing the number of times a company is able to pay
dividends to all its shareholders that is gathered from profits earned within an accounting period.
Dividend cover ratio of both Sakae Holdings and Soup Restaurant Company is observed to be 0
from the year 2015 to year 2016. This indicates that both the companies are capable enough in
paying off all its necessary preferred dividend payments and it faces no difficulty in addressing
preferred dividend requirements (Sakae Holdings, 2018). Some limitations of using this ratio
includes proper estimation of deducting any dividends paid for the irredeemable preference
shares from the net profit gathered over the accounting period for estimating earnings to be
attained by ordinary shareholders.
Dividend yield ratio
Paraphrase This Document
Need a fresh take? Get an instant paraphrase of this document with our AI Paraphraser
10FINANCIAL REPORTING
Dividend yield ratio is significant in analysing the basis on which the organizations pay
dividends on quarterly basis and evaluators the dividend paying capability of the organization.
Dividend yield ratio of both Sakae Holdings and is observed to be 0 and Soup Restaurant
Company is observed to decrease by 34% from the year 2015 to year 2016. This indicates that
both the companies do not pay a huge percentage of market prices of their shares to all its
shareholders in the dividend form (Soup Restaurant, 2018). However, there are certain
limitations of employing this ratio as it estimates that a company used for analysis continuously
prefer making dividend payments at the similar or increased rate like usual.
Capital gearing ratio
Capital gearing ratio is necessary in a company’s capital structure that includes the
fraction of equity and debt used by the company. Capital gearing ratio of both Sakae Holdings
and Soup Restaurant Company is observed to decrease by 22% and 87% from the year 2015 to
year 2016. This indicates that the capital structure of the company is not that low geared as a
decreased fraction of their capital is encompassed of common stockholders’ equity (Soup
Restaurant, 2018). Few drawbacks of employing thus ratio includes the complexity of this ratio
in understanding whether the organization is high or low geared along with the performance of
the organization in covering the interest payment with gathering a constant profit.
Conclusion
The objective of the paper is to conduct a comparative analysis of the selected companies
Sakae Holdings and Soup Restaurant that is listed in Singapore stock exchange. The report
revealed that profitability of Sakae Holdings Company is poor in comparison to Soup Restaurant.
Moreover, ratio analysis also explained that gearing ratios and asset efficiency ratios of Sakae
holdings is negative in comparison to Soup Restaurant that signifies the company needs
increased improvement in these ratios. For improvement of the profitability ratios, Sakae
Holdings Ltd is recommended to decrease its inventory, boost conversion rate and review its
recent pricing structure. However, the investors are recommended to invest in the shares of the
Soup Restaurant due to positive returns on investment, greater profit margin and higher dividend
payouts.
11FINANCIAL REPORTING
Part 2
Reflection
Through carrying out the comparative ratio analysis of the selected companies, I have
carried out comparative summary for two years regarding the selected companies profitability,
liquidity, asset efficiency and gearing will be provided within the report. Moreover, through
completing this paper I have learned that profitability ratios can be efficiently used in evaluating
the company’s performance along with operational efficiency. I have learned that these ratios
indicate the association among the profit along with resources used within the business. From
analysing the ratios of the selected companies I have learned that ratio analysis is an effective
process of determining along with analysing the numerical relationships relied on the financial
statements. I have also learned that ratio analysis serves as a statistical yardstick which offers a
measure of association among two figures and variables. After completion of the report, I have
attained a great understanding on the fact that ratio analysis provides decision makers with
increased information and facilities superior quality decision making. This also facilitates
directors, managers along with other interested members in deciding important figures such as
turnover and profit. After analysing the ratios of the selected companies, I have gathered
knowledge regarding the fact that liquidity serves as a measure of a company’s capability to
address daily expenditure. I have also gathered an understanding regarding the fact that the
companies require holding liquid assets in order to make sure that it can address their financial
commitments to an extent as liquid assets has a tendency to gather low returns. I have also
gained knowledge on the fact that financial statement analysis must centre majorly on extracting
necessary information for a specific decision. Such information needed can take several forms
that encompass comparisons like comparing variations within similar item for same organization
over several years. This can facilitate in comparing changes for the similar items for the same
organization over several years for comparing major relationships within the identical year. I
have also realised that ratio analysis of the companies facilitates comparison of financial
performance of them along with facilitating calculation of different ratios for a broad variety of
purposes.
⊘ This is a preview!⊘
Do you want full access?
Subscribe today to unlock all pages.
Trusted by 1+ million students worldwide
1 out of 14
Related Documents


Your All-in-One AI-Powered Toolkit for Academic Success.
+13062052269
info@desklib.com
Available 24*7 on WhatsApp / Email
![[object Object]](/_next/static/media/star-bottom.7253800d.svg)
Unlock your academic potential
Copyright © 2020–2026 A2Z Services. All Rights Reserved. Developed and managed by ZUCOL.