Comparative Financial Analysis of Farsons and Heineken Companies
VerifiedAdded on 2023/01/18
|17
|3628
|32
Report
AI Summary
This report presents a comprehensive financial analysis comparing Farsons and Heineken, two beverage companies. It includes detailed vertical, horizontal, and ratio analyses of their financial statements from 2015 to 2018, focusing on profitability, liquidity, and efficiency ratios. The analysis highlights trends in operating profit, net profit, return on assets, and equity, along with an evaluation of current and quick ratios, debt-to-equity, and debt-to-asset ratios. Furthermore, the report discusses the importance of analyzing working capital for informed decision-making, and provides a critical analysis of the annual cash flow statements of both companies. The conclusion suggests Farsons as the better option based on the analysis of the financial ratios.

Financial Analysis Management & Enterprise
Paraphrase This Document
Need a fresh take? Get an instant paraphrase of this document with our AI Paraphraser

Table of Contents
INTRODUCTION................................................................................................................................3
MAIN BODY.......................................................................................................................................4
TASK 1............................................................................................................................................4
TASK 2..........................................................................................................................................12
Importance of analysing working capital of the companies before taking decision......................12
TASK 3 .........................................................................................................................................13
CONCLUSION..................................................................................................................................16
REFERENCES...................................................................................................................................17
INTRODUCTION
Financial analysis is a effective process, it assist in evaluating businesses, budgets, projects and
various financial related activities to identify their suitability and performances. It is a process of
analyzing and reviewing business's financial statements. By this we can determine the company's
financial strength and weaknesses by developing strategic relationship with the financial statements,
balance sheet and profit and loss account. Farsons is beverage company is known as Simond
Farsons Cisk plc. The business of Farsons includes production, sales, brewing and distribution of
soft drinks and beer. Heineken is a lager beer company and it includes 5% alcohol. Heineken is sold
their beer in green bottle. This report will include the detailed vertical, horizontal and ratio analysis
of the financial statements of both the companies. This report will also highlight the importance of
analysing working capital of the Farsons and Heineken company before making a decision. This
report will also state the critical analysis of the annual cash flow statement of Heineken and Farsons
over the last two years. (Zeghal and El Aoun, 2016)
⊘ This is a preview!⊘
Do you want full access?
Subscribe today to unlock all pages.
Trusted by 1+ million students worldwide
MAIN BODY
TASK 1
A detailed vertical, horizontal and ratio analysis of the financial statements of the two companies
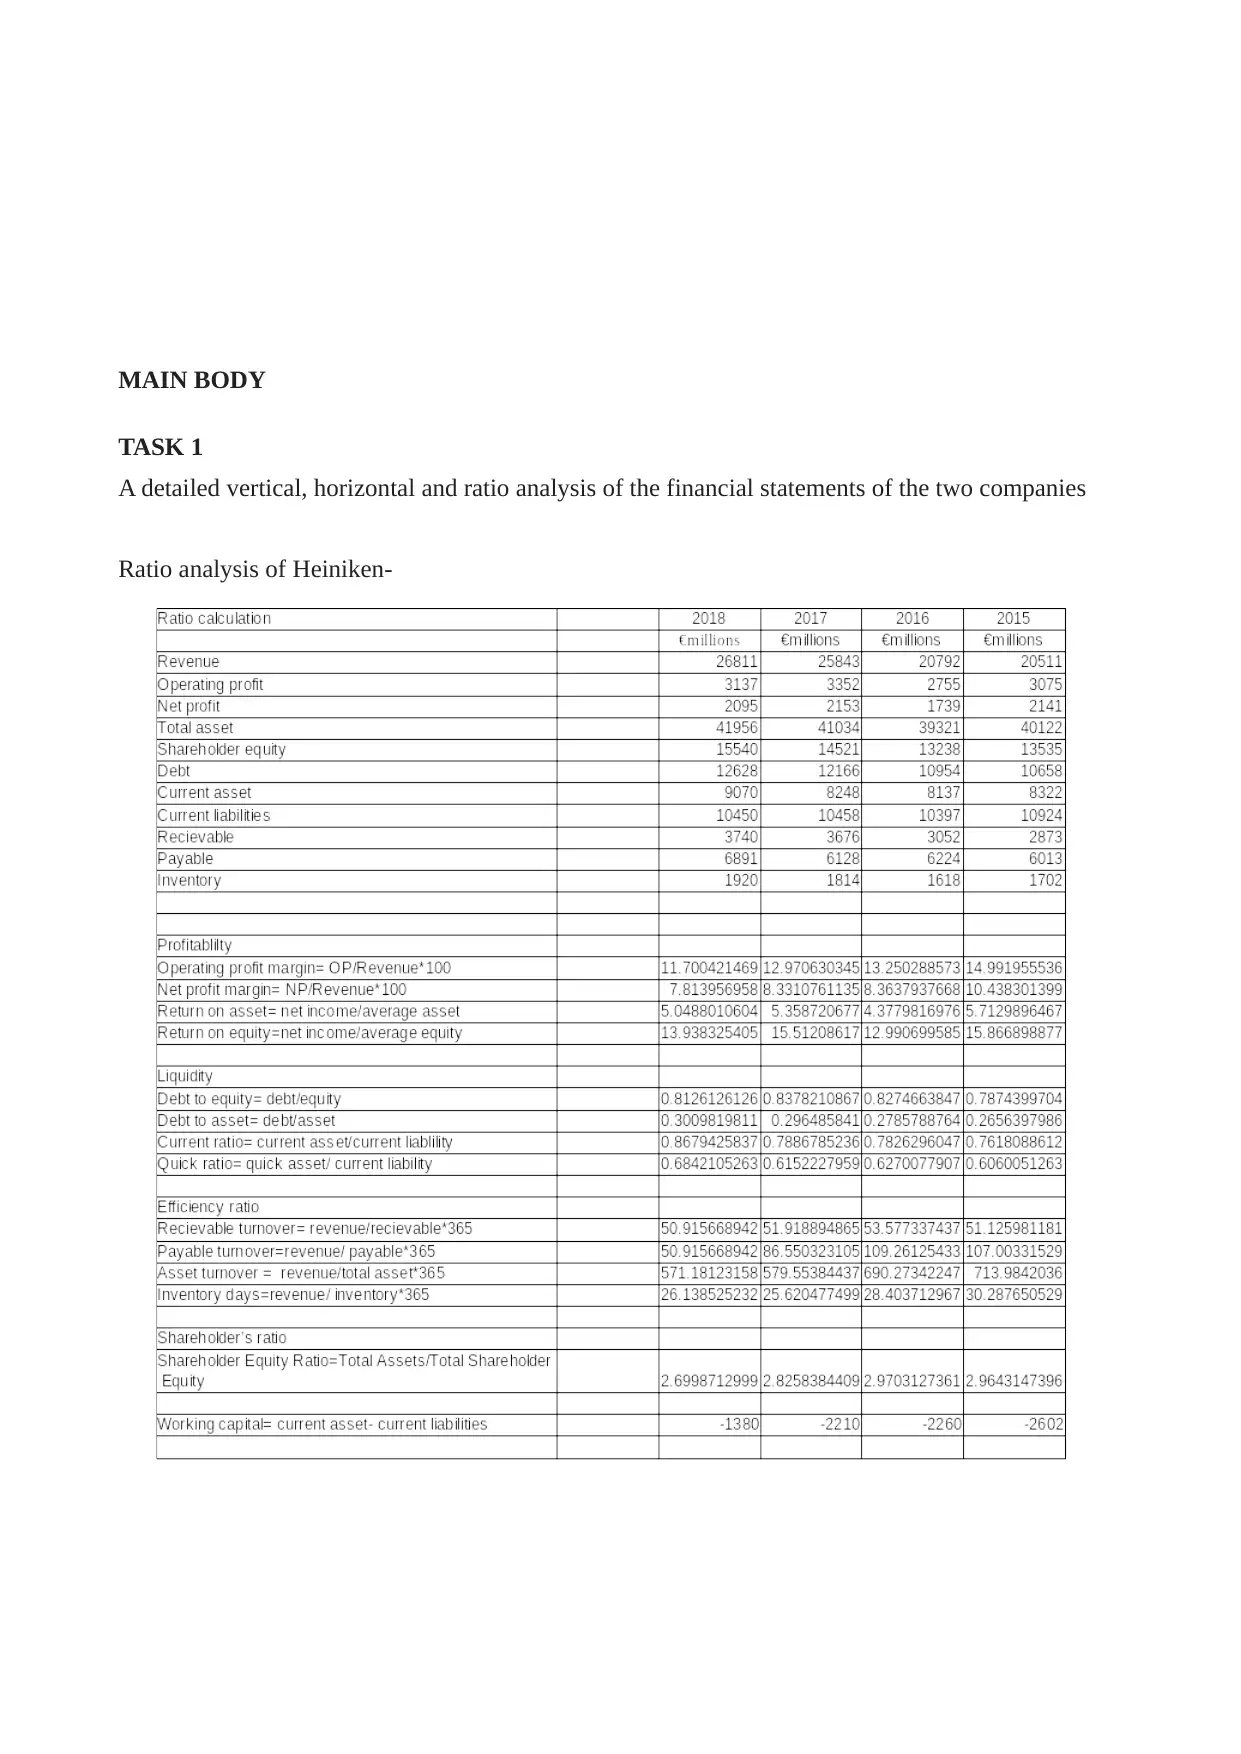
Ratio analysis of Heiniken-
TASK 1
A detailed vertical, horizontal and ratio analysis of the financial statements of the two companies
Ratio analysis of Heiniken-
Paraphrase This Document
Need a fresh take? Get an instant paraphrase of this document with our AI Paraphraser
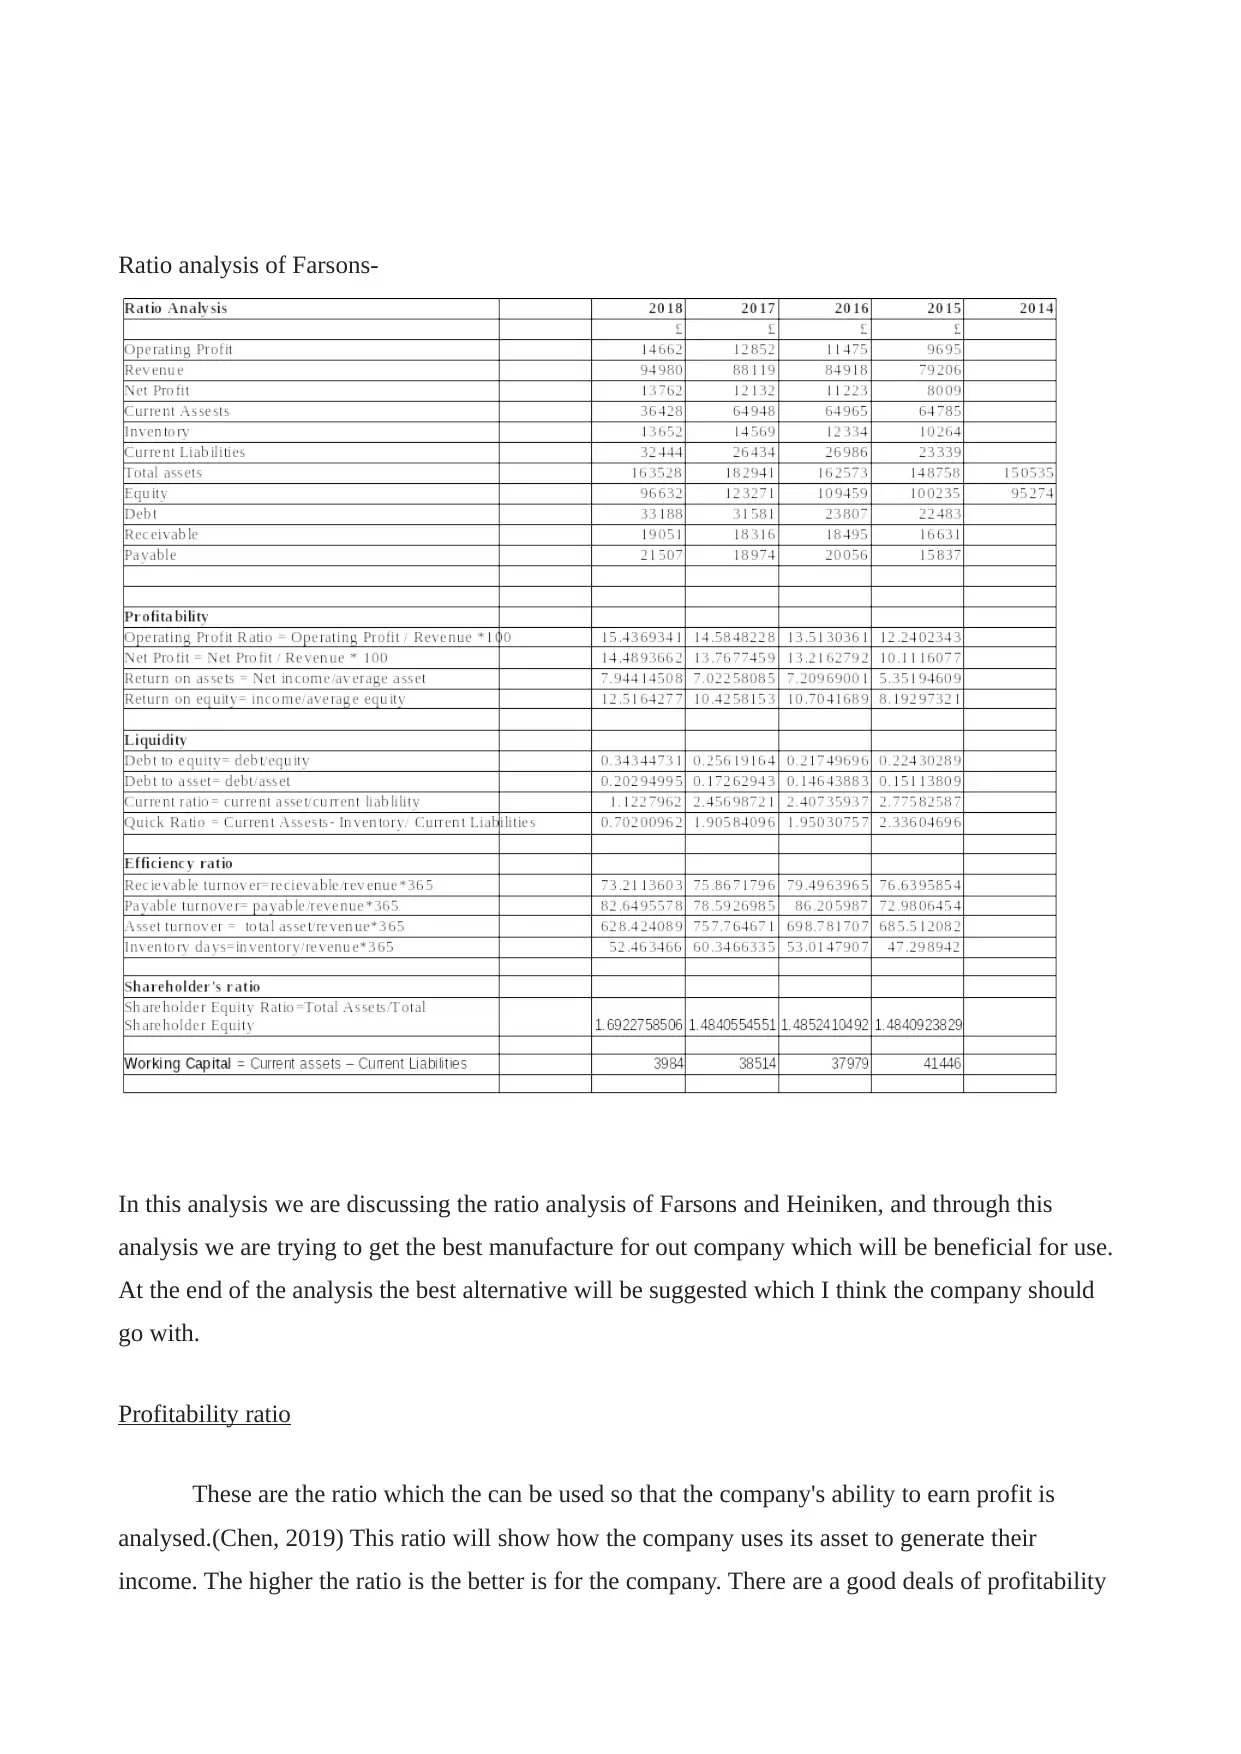
Ratio analysis of Farsons-
In this analysis we are discussing the ratio analysis of Farsons and Heiniken, and through this
analysis we are trying to get the best manufacture for out company which will be beneficial for use.
At the end of the analysis the best alternative will be suggested which I think the company should
go with.
Profitability ratio
These are the ratio which the can be used so that the company's ability to earn profit is
analysed.(Chen, 2019) This ratio will show how the company uses its asset to generate their
income. The higher the ratio is the better is for the company. There are a good deals of profitability

ratio that have been calculated in the report which are analysed below:
Operating profit
The operating profit of the company Heiniken is on a decreasing trend, the company operating ratio
has decreased by around 4%, whereas Farson's is showing an increasing trend and there is an
increase of around 3% in their operating profit from the year 2015 to 2018. Heiniken is showing a
decrease because the company may not be able to manage their operating expense and the company
admin expense including amortization, depreciation etc are increasing and the sales are not
increasing proportionately therefore the company is seeing a decreasing trend. In contrast to this the
company Farson's operating profit is increasing year by year as their sales are increasing at a fast
pace and they are controlling their operating expense very well.
Net profit
The net profit margin is again showing a diminishing trend in the ratio analysis for Heiniken
whereas an increasing trend in the Farsons company. The reasons for this might be because the
Heiniken is not able to manage their finance cost and there is less income generated from the
company's investment, therefore the net profit is decreased. The company revenue is only increased
by 5% where the other expenses have increased way more than this. Comparing this to Farsons the
increase in the revenue is of around 8% and the finance cost is decreased the so the company's net
profit margin is increased over the years. The lower decreasing net profit ratio means company are
unable to generate effective profit from its revenue.
Return on asset
The return on asset ratio of Heiniken is seen consistent there is slight increase or decrease over the 4
year, whereas the return on asset of Farsons is increasing over the four year by around 3%. This is
because the Farson company is controlling its business expense better than Heiniken. Also, Farson
might be using their assets more efficiently than Heiniken so they are having a better return on their
asset. The financial statements are also showing that Heiniken is paying more finance to arrange the
debt capital than it is getting from investing this debt capital therefore the return on asset is low.
Return on equity
The return on equity of Heiniken has decreased from the year 2015 to 2016 by 3% then in the next
⊘ This is a preview!⊘
Do you want full access?
Subscribe today to unlock all pages.
Trusted by 1+ million students worldwide
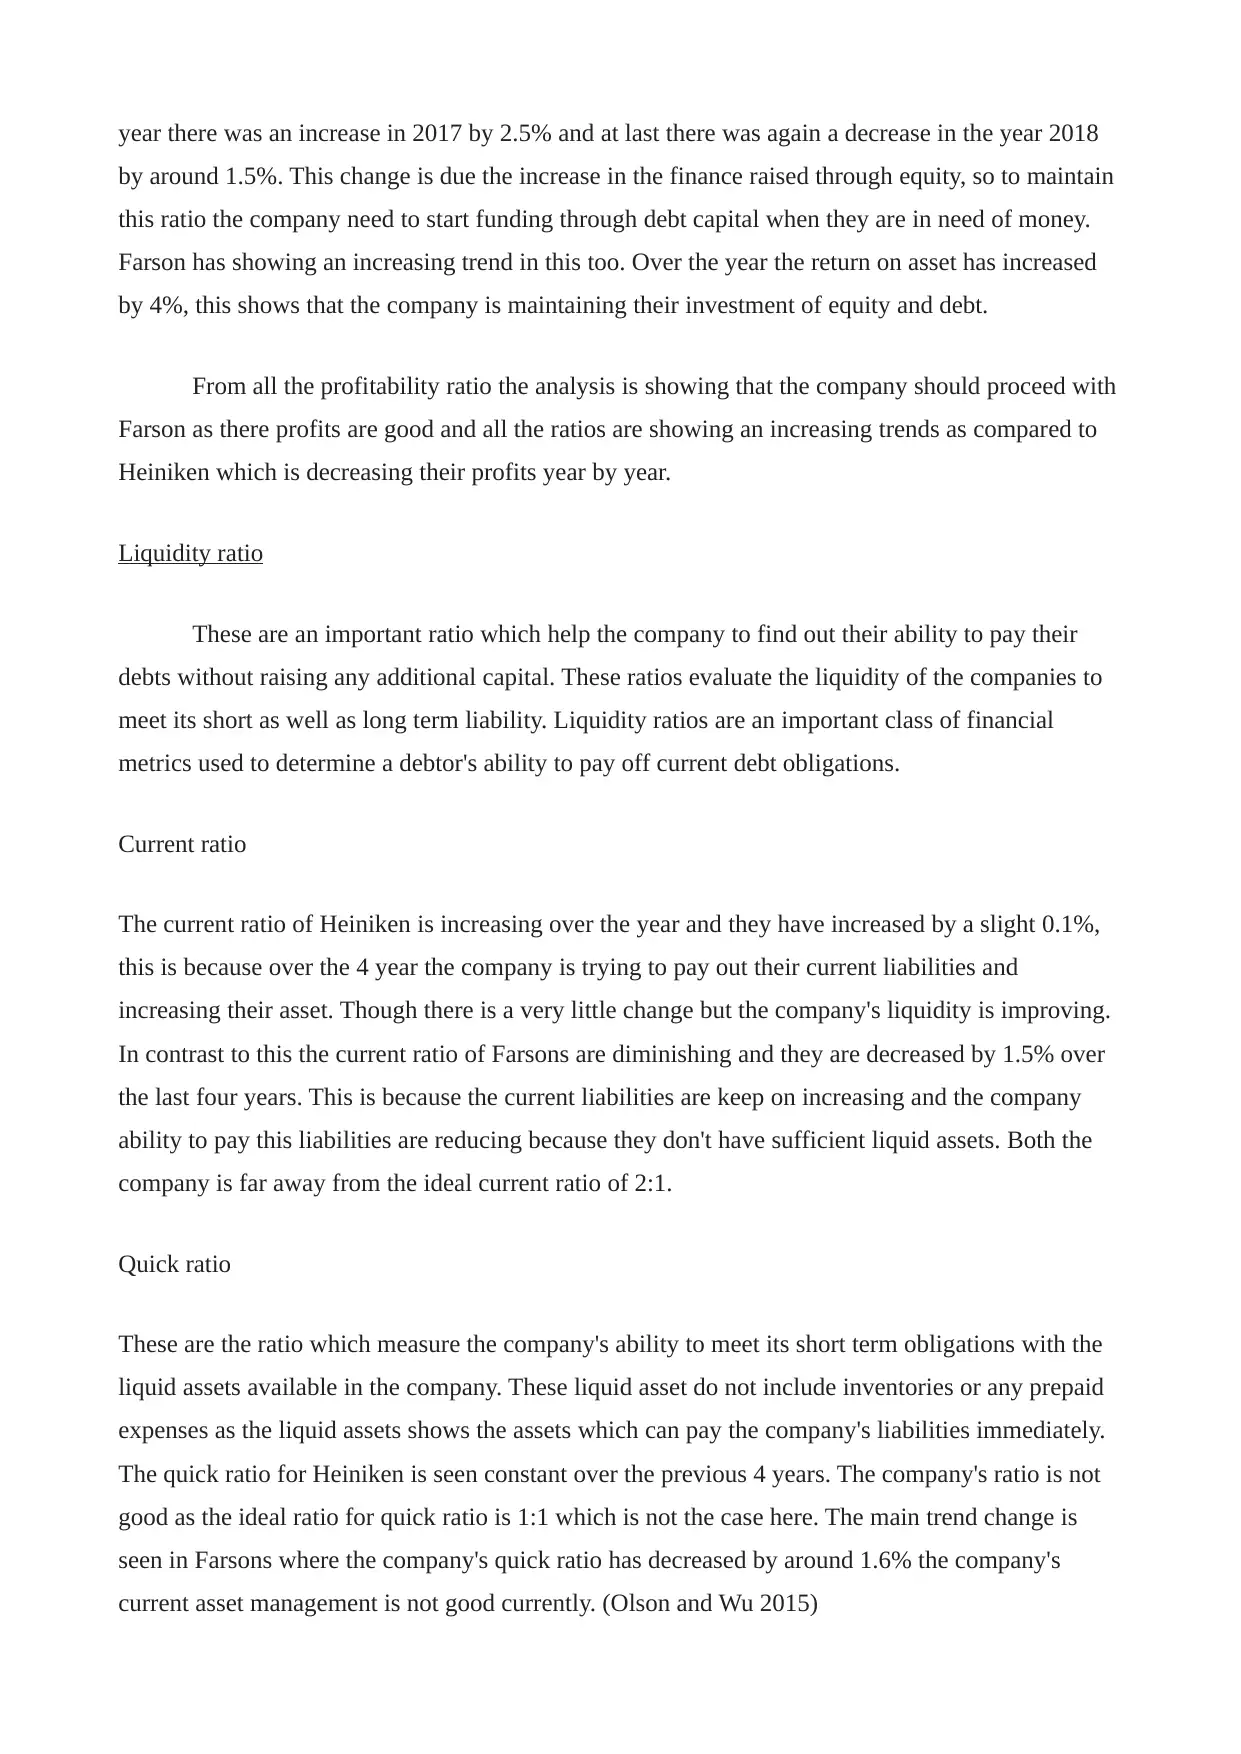
year there was an increase in 2017 by 2.5% and at last there was again a decrease in the year 2018
by around 1.5%. This change is due the increase in the finance raised through equity, so to maintain
this ratio the company need to start funding through debt capital when they are in need of money.
Farson has showing an increasing trend in this too. Over the year the return on asset has increased
by 4%, this shows that the company is maintaining their investment of equity and debt.
From all the profitability ratio the analysis is showing that the company should proceed with
Farson as there profits are good and all the ratios are showing an increasing trends as compared to
Heiniken which is decreasing their profits year by year.
Liquidity ratio
These are an important ratio which help the company to find out their ability to pay their
debts without raising any additional capital. These ratios evaluate the liquidity of the companies to
meet its short as well as long term liability. Liquidity ratios are an important class of financial
metrics used to determine a debtor's ability to pay off current debt obligations.
Current ratio
The current ratio of Heiniken is increasing over the year and they have increased by a slight 0.1%,
this is because over the 4 year the company is trying to pay out their current liabilities and
increasing their asset. Though there is a very little change but the company's liquidity is improving.
In contrast to this the current ratio of Farsons are diminishing and they are decreased by 1.5% over
the last four years. This is because the current liabilities are keep on increasing and the company
ability to pay this liabilities are reducing because they don't have sufficient liquid assets. Both the
company is far away from the ideal current ratio of 2:1.
Quick ratio
These are the ratio which measure the company's ability to meet its short term obligations with the
liquid assets available in the company. These liquid asset do not include inventories or any prepaid
expenses as the liquid assets shows the assets which can pay the company's liabilities immediately.
The quick ratio for Heiniken is seen constant over the previous 4 years. The company's ratio is not
good as the ideal ratio for quick ratio is 1:1 which is not the case here. The main trend change is
seen in Farsons where the company's quick ratio has decreased by around 1.6% the company's
current asset management is not good currently. (Olson and Wu 2015)
Paraphrase This Document
Need a fresh take? Get an instant paraphrase of this document with our AI Paraphraser
Debt to equity ratio
This ratio is an important metric for measuring the corporate finance and how the company
maintain their debt and equity. This is a gearing ratio. This ratio has not changed much for both the
company in the last 4 year as both of them are showing only a slight change. (Shad, 2019)
Debt to asset ratio
This ratio is increasing in both the company this may be because the company assets are financed
more and more through debt, which means that the creditors have more claim on the company's
assets.. The Farsons company's debt to assets ratio in 2015 = 0.1511, in 2016 = 0.1464, in 2017 =
0.1726 and in the 2018 = 0.2029, it shows the increasing trend over the last four years. In the
Heineken company, the debt to assets ratio in 2015 = 0.265, in 2016 = 0.278, in 2017= 0.296 and in
2018 = 0.300, these also shows a increasing trend This is a concern for both the company as this
will increase the company in getting loan in the future as the lender will not trust the company with
their investment.
The above ratio analysis of liquidity is showing concern about both of the company but the
better option is to go with Farsons because their financial statements are showing better liquidity
than Heiniken.
Efficiency ratio
These ratios will help in evaluating how well the company uses its assets and liabilities
internally. This ratio can also be used to track and analyse the performance of commercial and
investment banks.
Receivable turnover
The receivable turnover are almost constant for Heiniken over the 4 years whereas the company
Farsons is showing a decreasing trend, this might be because the company is receiving their money
from their debtor faster than before. The receivable turnover of the Farsons company has reduced
by 3.48 and also the Heineken company has reduced by 0.21. Though Heiniken is performing better
in this ratio as there receivable days are lesser than Farsons.
Payable turnover
The payable turnover have decreased by more than 50 days, this may be because the company may
be paying their payables very fast. This may not be good, though the company liabilities are
reduced but the liquidity is drained too much in paying these. In comparison to this, Farson is
maintaining a constant payable turnover of around 80 days. But currently the better option is
Heiniken .The payable turnover of the Farsons company has increased by 9.66 and the payable
turnover of the Heineken company is decreased by 56.06. The high payable turnover means that
company is able to pay their suppliers in a very quick way.
Inventory turnover
Heiniken is showing a decrease in the inventory turnover which means that the company is holding
its inventory more than they were previously holding, which may be due to the company taking it
long to sell the inventory. Whereas Farsons have shown an increase in the year from 2015 to 2017,
but there was a decrease in the year 2018. Therefore, Farsons here is more preferable than Heiniken.
Shareholder's ratio
Shareholder equity
Shareholders ratio used by the company to identify the shareholder's return for a company. In the
Heineken company, the shareholder ratio has reduced by 0.265 and in the Farsons company, the
shareholder ratio has increased by 0.208 that means that shareholder's of the company give their
return in the company.
Overall by looking at the efficiency ratios the better option is to go with the Heiniken, as
they are showing better result as compared to Farsons.
With the whole analysis of ratio it can be told that Farsons are performing better than Heiniken and
the company should go with Farsons in order to make long term benefits. (Wei, 2018)
Horizontal analysis of Farsons
⊘ This is a preview!⊘
Do you want full access?
Subscribe today to unlock all pages.
Trusted by 1+ million students worldwide
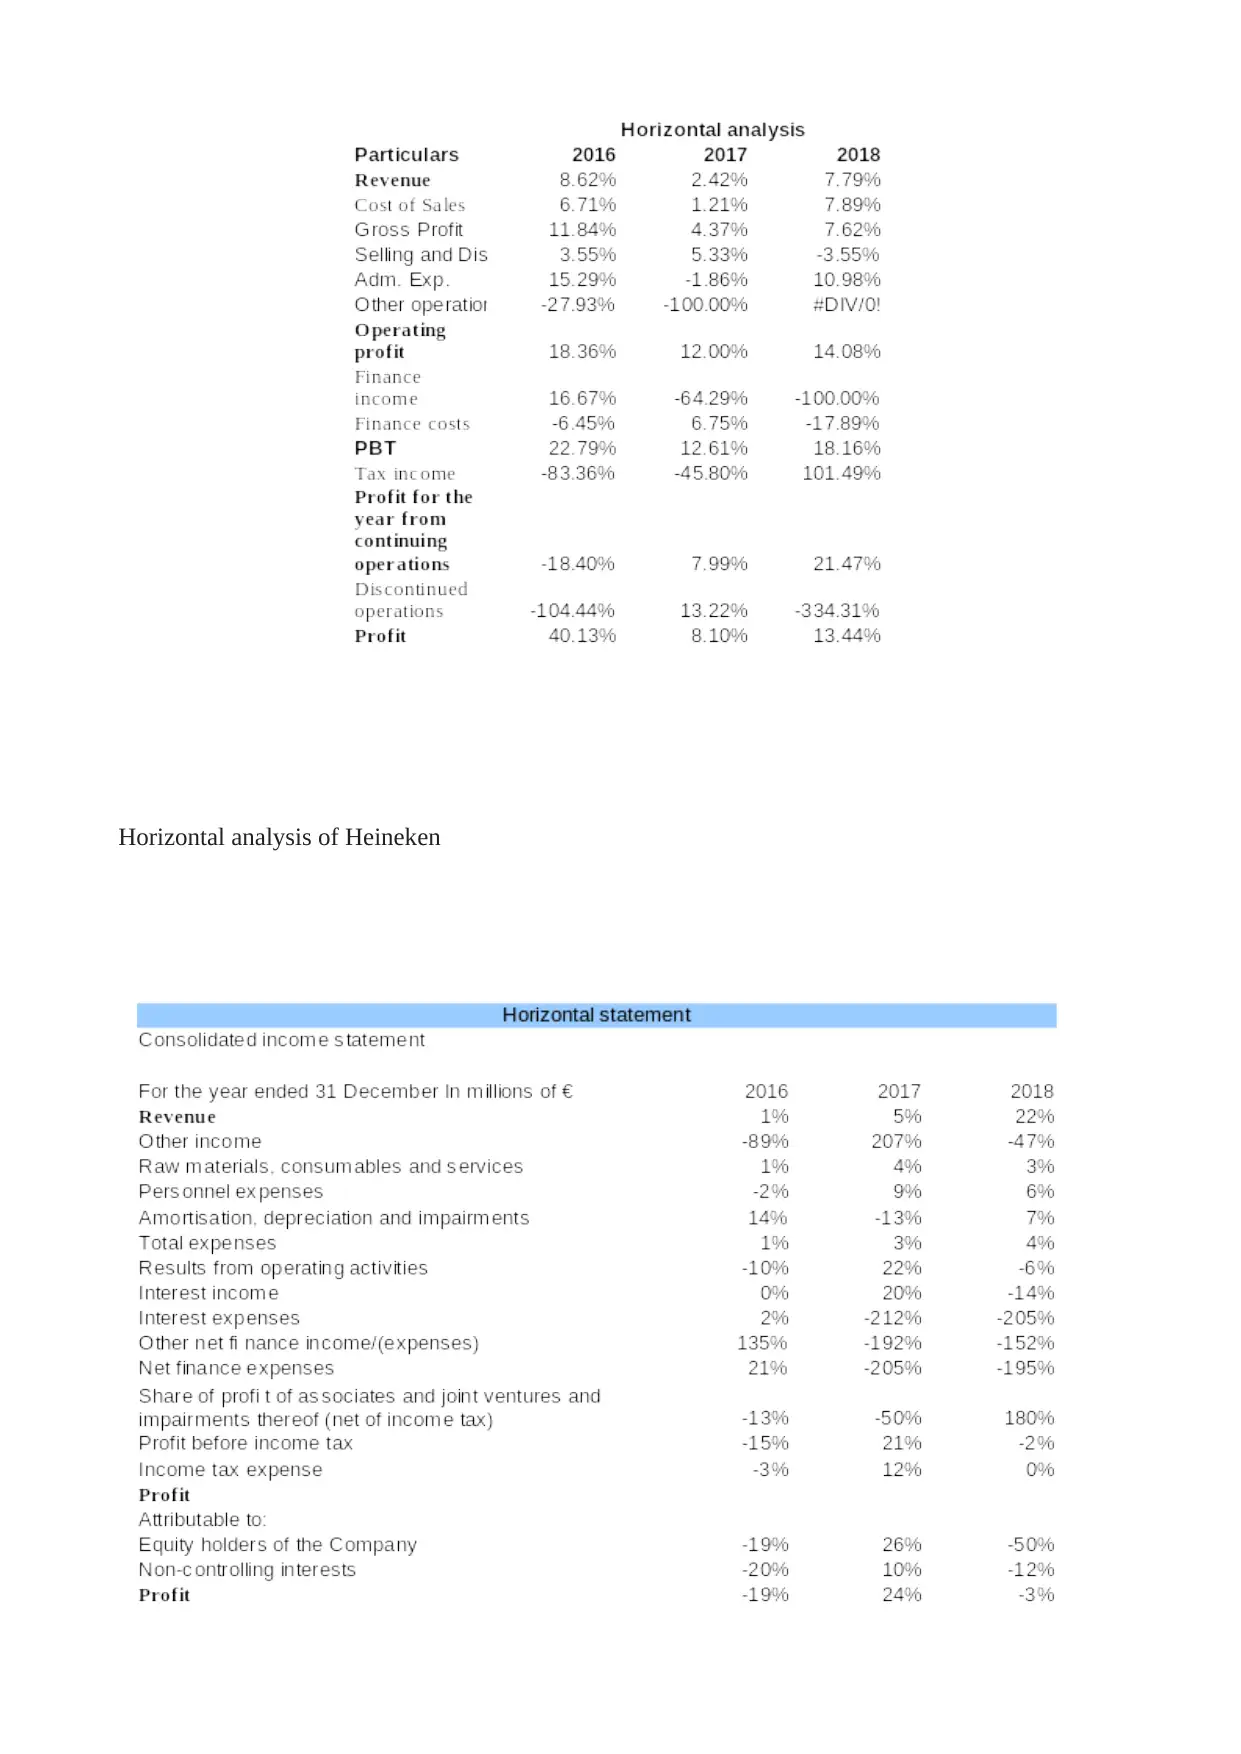
Horizontal analysis of Heineken
Paraphrase This Document
Need a fresh take? Get an instant paraphrase of this document with our AI Paraphraser
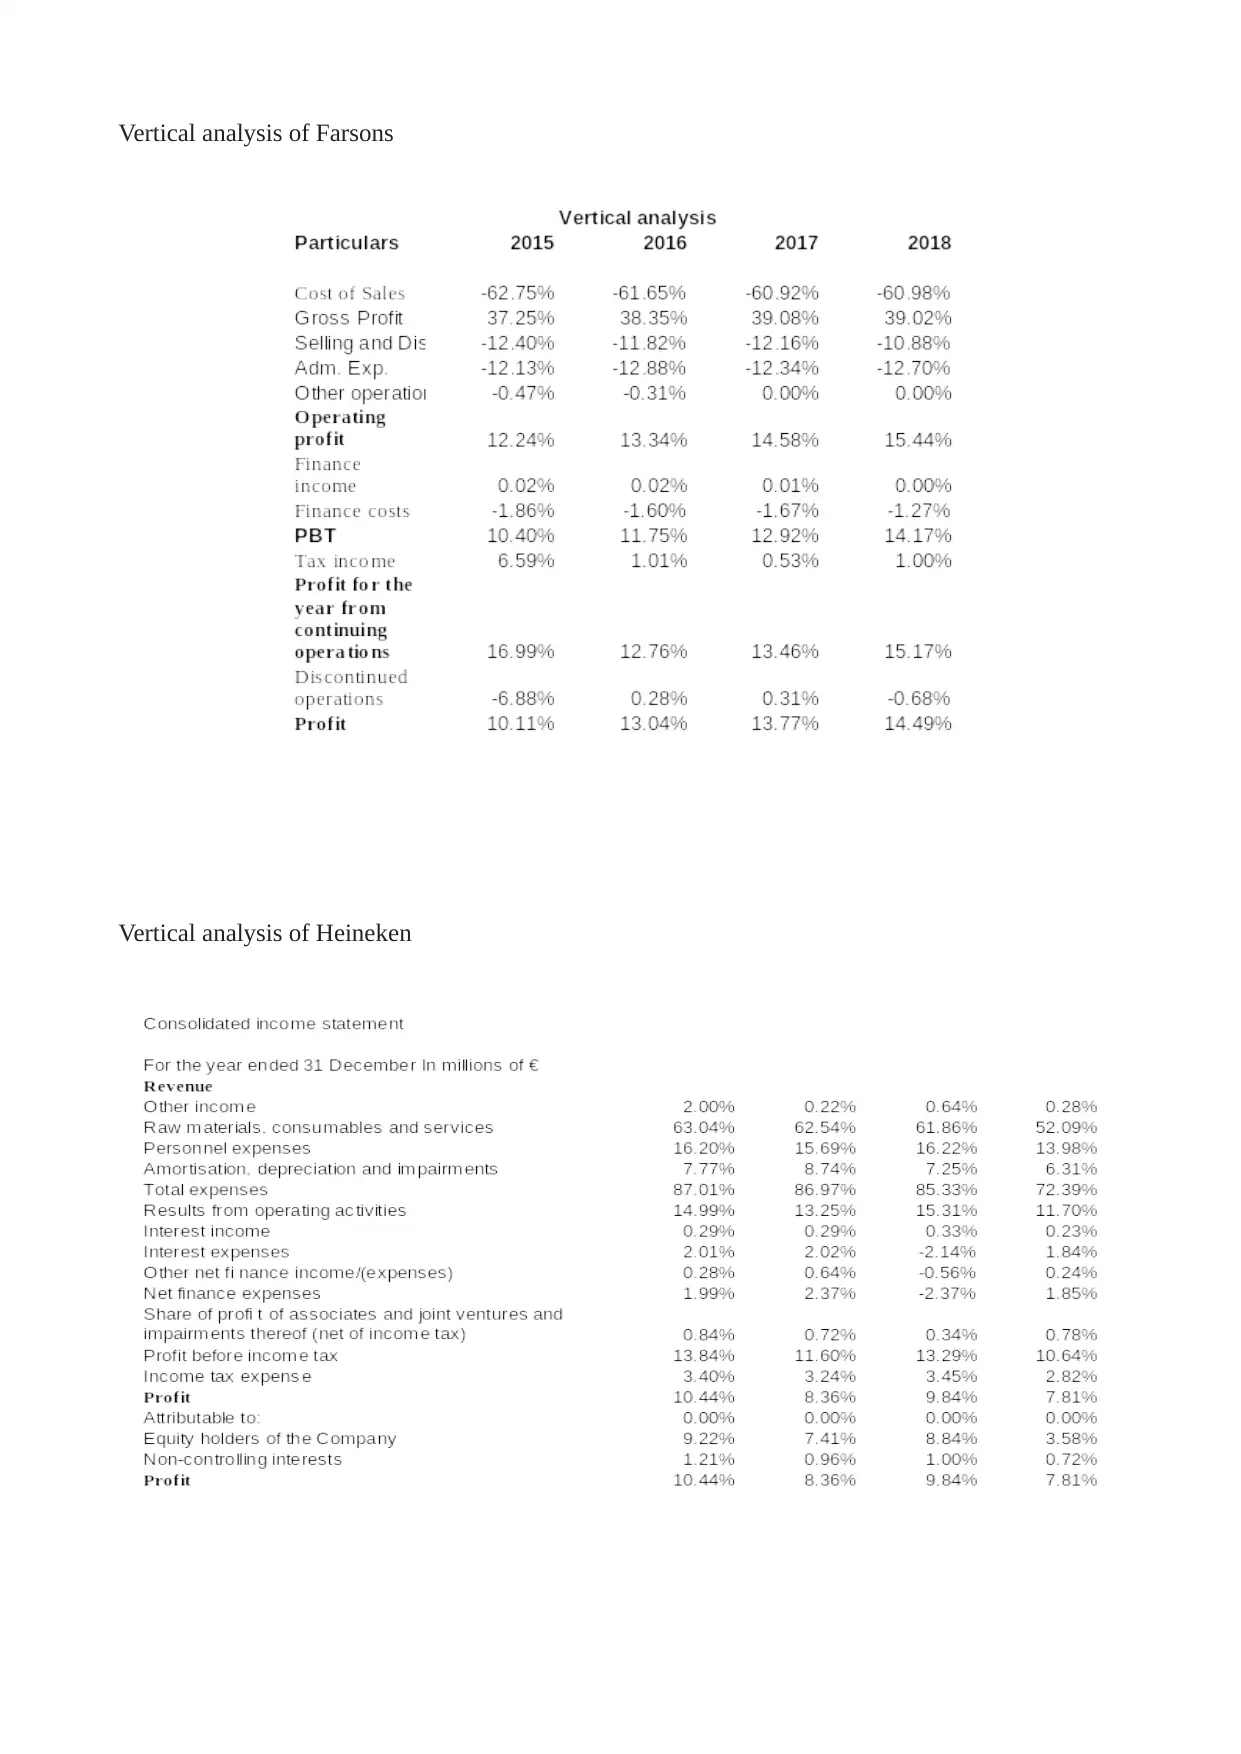
Vertical analysis of Farsons
Vertical analysis of Heineken
Vertical analysis of Heineken
From the above analysis we have formed the following conclusions about the company-
There is an increasing trend in the sales for Farsons in the three years from 2016 to 2018, and the
cost of sales are decreasing which has resluted into the increase of the profits of the company, while
at the same time Heineken is showing an increase in the sales % too but there cost of sales are
increasing more than the sales which has resulted into decrease in the profitability of the company.
Though the overall profit is decreasing in both the companies, but the current report of 2018 shows
that the better company is Heineken as there profitability in the current year is better than Farsons.
TASK 2
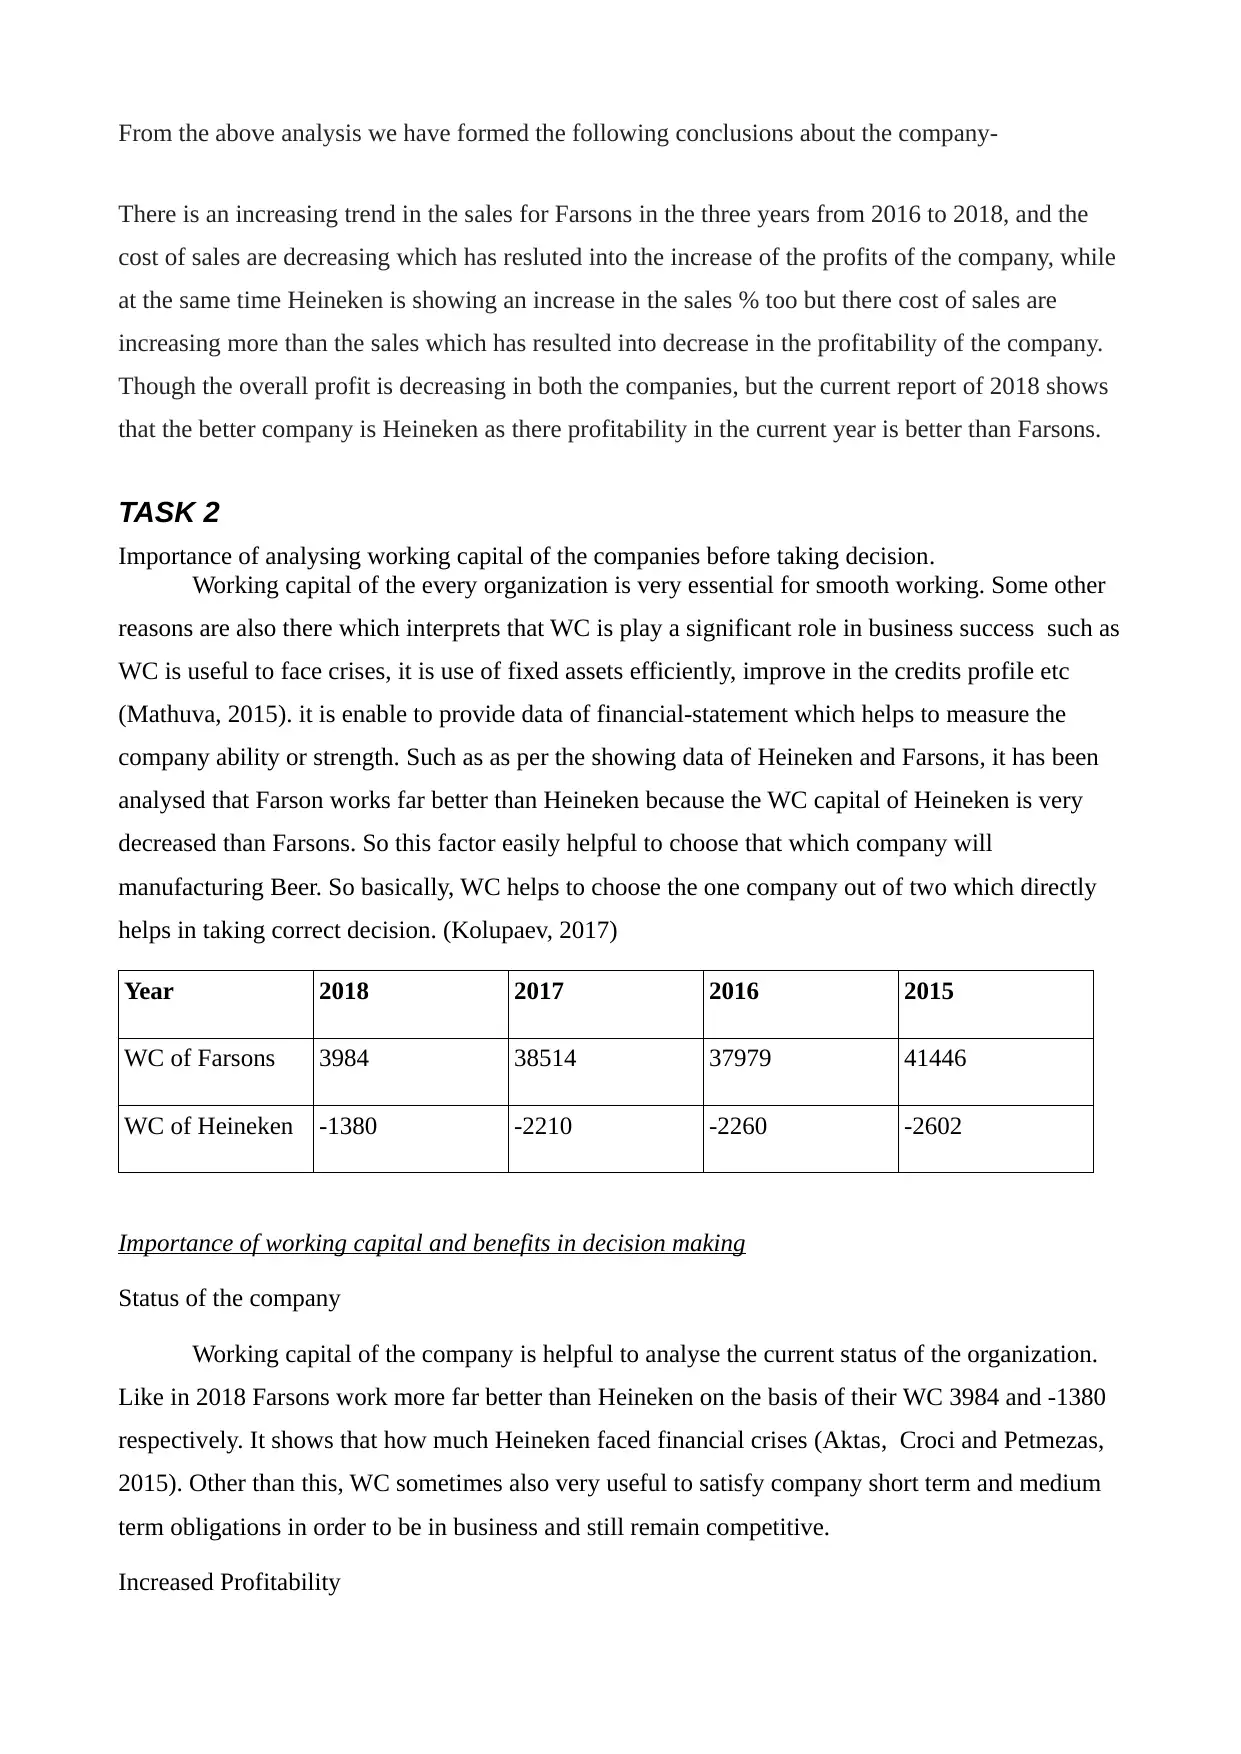
Importance of analysing working capital of the companies before taking decision.
Working capital of the every organization is very essential for smooth working. Some other
reasons are also there which interprets that WC is play a significant role in business success such as
WC is useful to face crises, it is use of fixed assets efficiently, improve in the credits profile etc
(Mathuva, 2015). it is enable to provide data of financial-statement which helps to measure the
company ability or strength. Such as as per the showing data of Heineken and Farsons, it has been
analysed that Farson works far better than Heineken because the WC capital of Heineken is very
decreased than Farsons. So this factor easily helpful to choose that which company will
manufacturing Beer. So basically, WC helps to choose the one company out of two which directly
helps in taking correct decision. (Kolupaev, 2017)
Year 2018 2017 2016 2015
WC of Farsons 3984 38514 37979 41446
WC of Heineken -1380 -2210 -2260 -2602
Importance of working capital and benefits in decision making
Status of the company
Working capital of the company is helpful to analyse the current status of the organization.
Like in 2018 Farsons work more far better than Heineken on the basis of their WC 3984 and -1380
respectively. It shows that how much Heineken faced financial crises (Aktas, Croci and Petmezas,
2015). Other than this, WC sometimes also very useful to satisfy company short term and medium
term obligations in order to be in business and still remain competitive.
Increased Profitability
There is an increasing trend in the sales for Farsons in the three years from 2016 to 2018, and the
cost of sales are decreasing which has resluted into the increase of the profits of the company, while
at the same time Heineken is showing an increase in the sales % too but there cost of sales are
increasing more than the sales which has resulted into decrease in the profitability of the company.
Though the overall profit is decreasing in both the companies, but the current report of 2018 shows
that the better company is Heineken as there profitability in the current year is better than Farsons.
TASK 2
Importance of analysing working capital of the companies before taking decision.
Working capital of the every organization is very essential for smooth working. Some other
reasons are also there which interprets that WC is play a significant role in business success such as
WC is useful to face crises, it is use of fixed assets efficiently, improve in the credits profile etc
(Mathuva, 2015). it is enable to provide data of financial-statement which helps to measure the
company ability or strength. Such as as per the showing data of Heineken and Farsons, it has been
analysed that Farson works far better than Heineken because the WC capital of Heineken is very
decreased than Farsons. So this factor easily helpful to choose that which company will
manufacturing Beer. So basically, WC helps to choose the one company out of two which directly
helps in taking correct decision. (Kolupaev, 2017)
Year 2018 2017 2016 2015
WC of Farsons 3984 38514 37979 41446
WC of Heineken -1380 -2210 -2260 -2602
Importance of working capital and benefits in decision making
Status of the company
Working capital of the company is helpful to analyse the current status of the organization.
Like in 2018 Farsons work more far better than Heineken on the basis of their WC 3984 and -1380
respectively. It shows that how much Heineken faced financial crises (Aktas, Croci and Petmezas,
2015). Other than this, WC sometimes also very useful to satisfy company short term and medium
term obligations in order to be in business and still remain competitive.
Increased Profitability
⊘ This is a preview!⊘
Do you want full access?
Subscribe today to unlock all pages.
Trusted by 1+ million students worldwide
1 out of 17
Related Documents


Your All-in-One AI-Powered Toolkit for Academic Success.
+13062052269
info@desklib.com
Available 24*7 on WhatsApp / Email
![[object Object]](/_next/static/media/star-bottom.7253800d.svg)
Unlock your academic potential
Copyright © 2020–2026 A2Z Services. All Rights Reserved. Developed and managed by ZUCOL.