Comparative Financial Performance Analysis: JB Hi-Fi vs. Harvey Norman
VerifiedAdded on 2021/05/30
|20
|4411
|73
Report
AI Summary
This report presents a comprehensive financial performance analysis of JB Hi-Fi Limited and Harvey Norman Limited, two prominent companies in the Australian retail industry. The analysis employs ratio analysis techniques to evaluate the companies' financial health for the years 2016 and 2017. The report is divided into key categories including short-term liquidity, long-term solvency, asset utilization, profitability, and market value ratios. A comparative analysis is conducted to highlight the strengths and weaknesses of each company, including the impact of debt-to-equity ratios, interest coverage, and profit margins. The findings provide valuable insights into the operational efficiency, financial leverage, and overall profitability of the two companies, culminating in recommendations for strategic improvements.
ANALYSIS OF FINANCIAL PERFORMANCE
JB Fi-Fi Limited and Harvey Norman Limited
1
JB Fi-Fi Limited and Harvey Norman Limited
1
Paraphrase This Document
Need a fresh take? Get an instant paraphrase of this document with our AI Paraphraser
Contents
Introduction................................................................................................................................3
Ratio analysis of JB Hi-fi Limited.............................................................................................4
Short term financial ratios/ Liquidity ratios...........................................................................4
Long term solvency/ Financial leverage ratio........................................................................4
Asset utilization (efficiency or turnover ratios).....................................................................5
Profitability ratio....................................................................................................................6
Market value ratios.................................................................................................................7
Ratio analysis of Harvey Normal Limited.................................................................................8
Short term solvency (Liquidity ratios)...................................................................................8
Long term solvency (Financial Leverage ratios)...................................................................8
Profitability ratios...................................................................................................................9
Asset unitization Ratios........................................................................................................10
Market valuation......................................................................................................................10
Comparative analysis...............................................................................................................12
Recommendation......................................................................................................................14
Conclusion................................................................................................................................15
References................................................................................................................................16
2
Introduction
Performance valuation has become an important management technique used to evaluate past
performances and make strategies for growth and development. There are various techniques
that are used by management of a company for performance evaluation and one of the most
popular techniques is ratio analysis. Ratio analysis helps in establishing a meaningful
relationship between two or more financial figures which can be used to evaluate different
aspects of the business (Baños-Caballero et.al, 2014). Here ratio analysis of two companies
has been conducted to evaluate their preferences. In addition to individual performance
evaluation, the comparison is also made between ratios of these two companies. Companies
taken into consideration for such evaluation are Harvey Norman Limited and JB Hi-fi
Limited. Both of these companies are working in Australian retail industry. Australian retail
market is highly competitive that makes performance evaluation more vital for growth and
development. From a general overview, it can be said that Harvey Norman is a larger
company as compared to JB Hi-fi limited if the size of market capital and yearly revenue
generated is considered.
3
⊘ This is a preview!⊘
Do you want full access?
Subscribe today to unlock all pages.
Trusted by 1+ million students worldwide
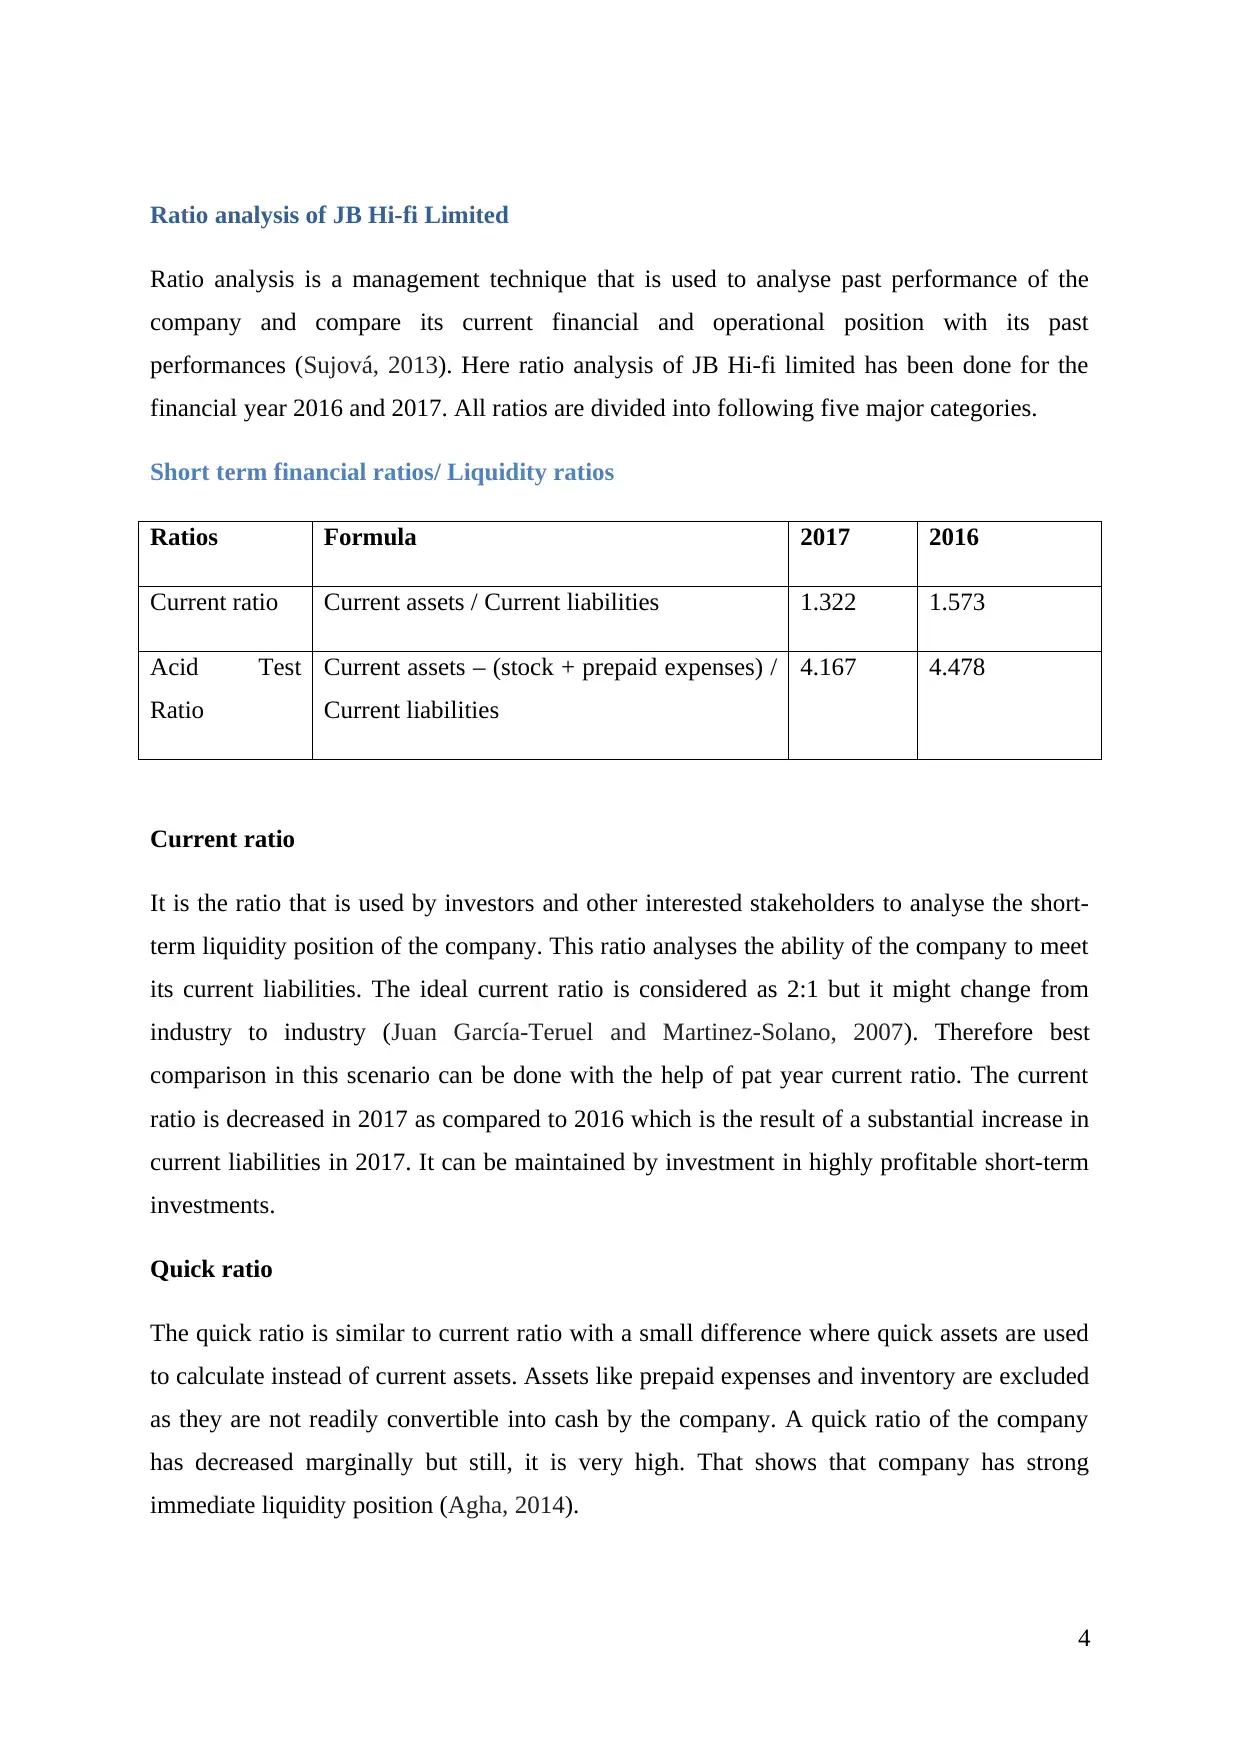
Ratio analysis of JB Hi-fi Limited
Ratio analysis is a management technique that is used to analyse past performance of the
company and compare its current financial and operational position with its past
performances (Sujová, 2013). Here ratio analysis of JB Hi-fi limited has been done for the
financial year 2016 and 2017. All ratios are divided into following five major categories.
Short term financial ratios/ Liquidity ratios
Ratios Formula 2017 2016
Current ratio Current assets / Current liabilities 1.322 1.573
Acid Test
Ratio
Current assets – (stock + prepaid expenses) /
Current liabilities
4.167 4.478
Current ratio
It is the ratio that is used by investors and other interested stakeholders to analyse the short-
term liquidity position of the company. This ratio analyses the ability of the company to meet
its current liabilities. The ideal current ratio is considered as 2:1 but it might change from
industry to industry (Juan García-Teruel and Martinez-Solano, 2007). Therefore best
comparison in this scenario can be done with the help of pat year current ratio. The current
ratio is decreased in 2017 as compared to 2016 which is the result of a substantial increase in
current liabilities in 2017. It can be maintained by investment in highly profitable short-term
investments.
Quick ratio
The quick ratio is similar to current ratio with a small difference where quick assets are used
to calculate instead of current assets. Assets like prepaid expenses and inventory are excluded
as they are not readily convertible into cash by the company. A quick ratio of the company
has decreased marginally but still, it is very high. That shows that company has strong
immediate liquidity position (Agha, 2014).
4
Paraphrase This Document
Need a fresh take? Get an instant paraphrase of this document with our AI Paraphraser
Long term solvency/ Financial leverage ratio
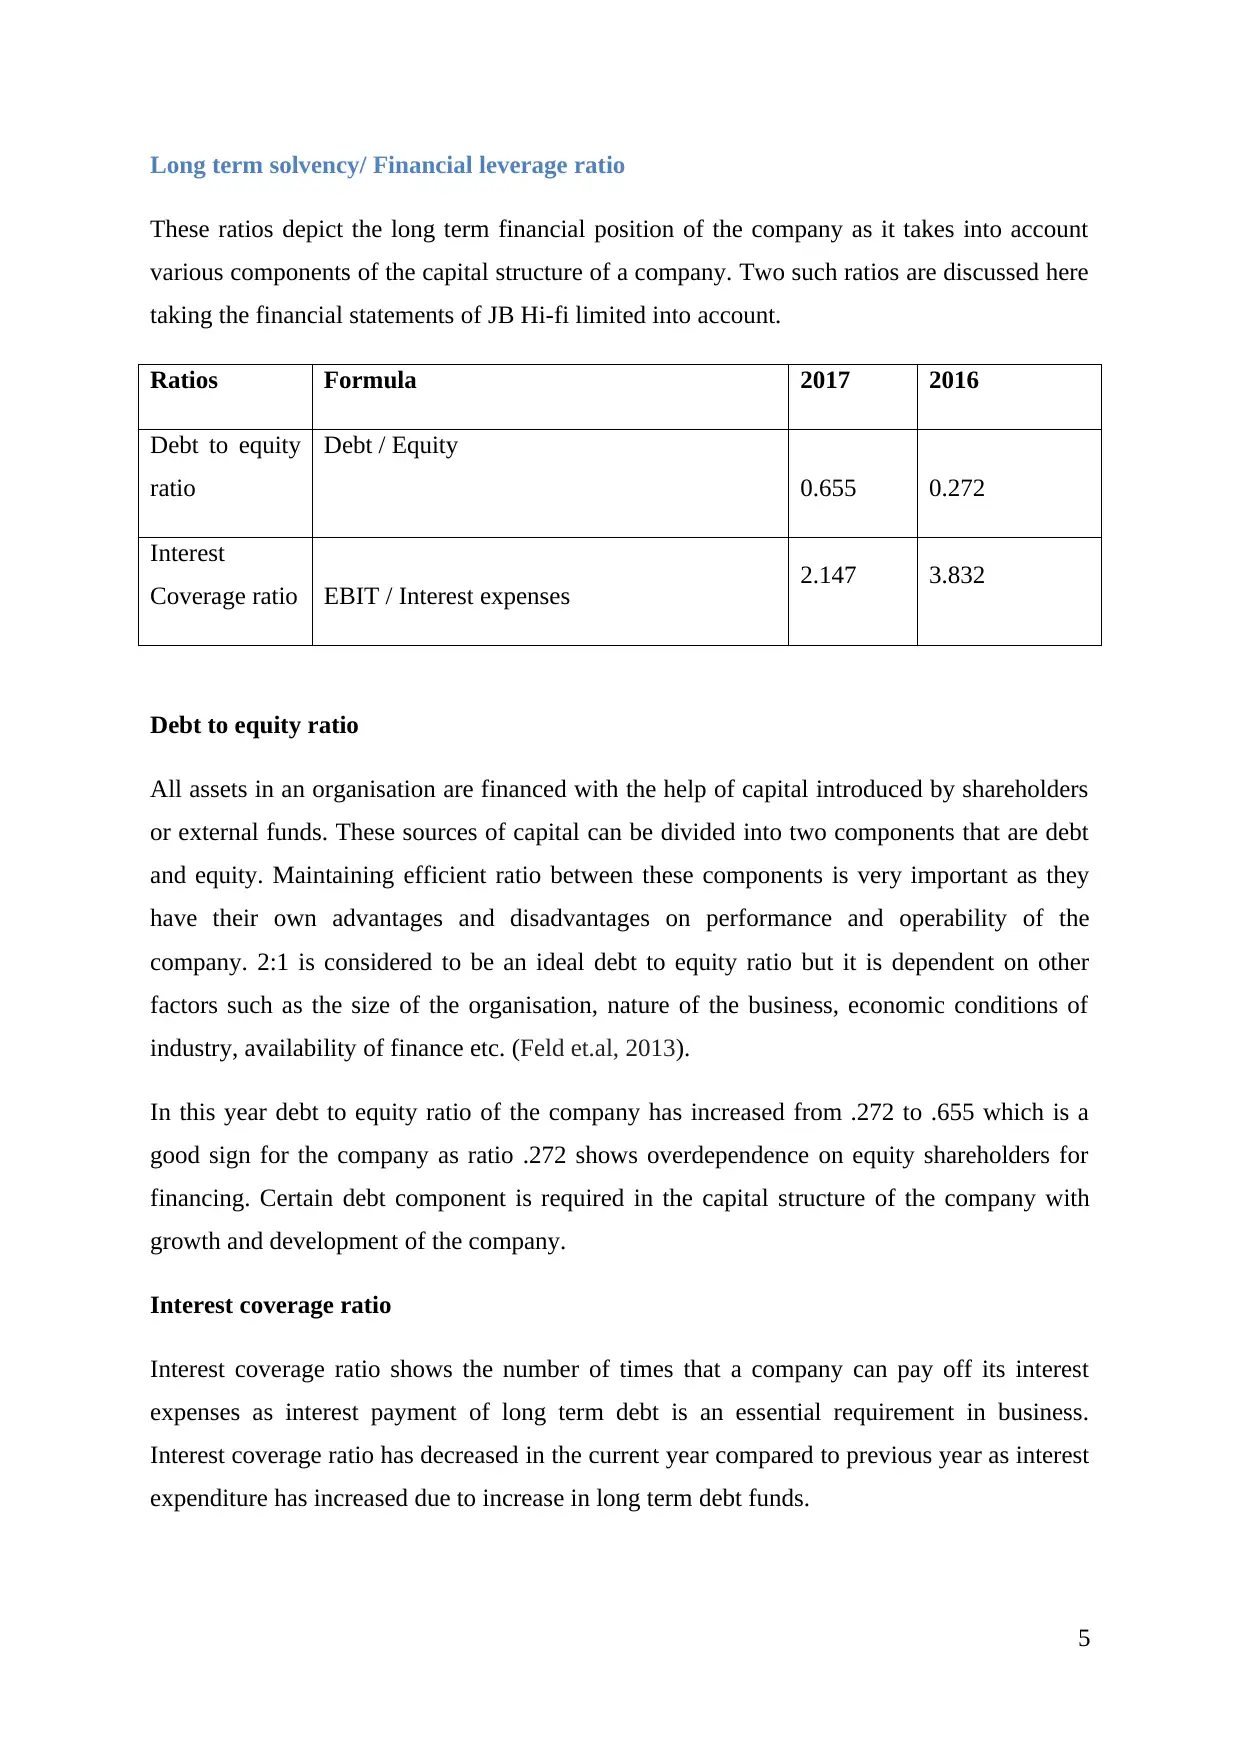
These ratios depict the long term financial position of the company as it takes into account
various components of the capital structure of a company. Two such ratios are discussed here
taking the financial statements of JB Hi-fi limited into account.
Ratios Formula 2017 2016
Debt to equity
ratio
Debt / Equity
0.655 0.272
Interest
Coverage ratio EBIT / Interest expenses 2.147 3.832
Debt to equity ratio
All assets in an organisation are financed with the help of capital introduced by shareholders
or external funds. These sources of capital can be divided into two components that are debt
and equity. Maintaining efficient ratio between these components is very important as they
have their own advantages and disadvantages on performance and operability of the
company. 2:1 is considered to be an ideal debt to equity ratio but it is dependent on other
factors such as the size of the organisation, nature of the business, economic conditions of
industry, availability of finance etc. (Feld et.al, 2013).
In this year debt to equity ratio of the company has increased from .272 to .655 which is a
good sign for the company as ratio .272 shows overdependence on equity shareholders for
financing. Certain debt component is required in the capital structure of the company with
growth and development of the company.
Interest coverage ratio
Interest coverage ratio shows the number of times that a company can pay off its interest
expenses as interest payment of long term debt is an essential requirement in business.
Interest coverage ratio has decreased in the current year compared to previous year as interest
expenditure has increased due to increase in long term debt funds.
5
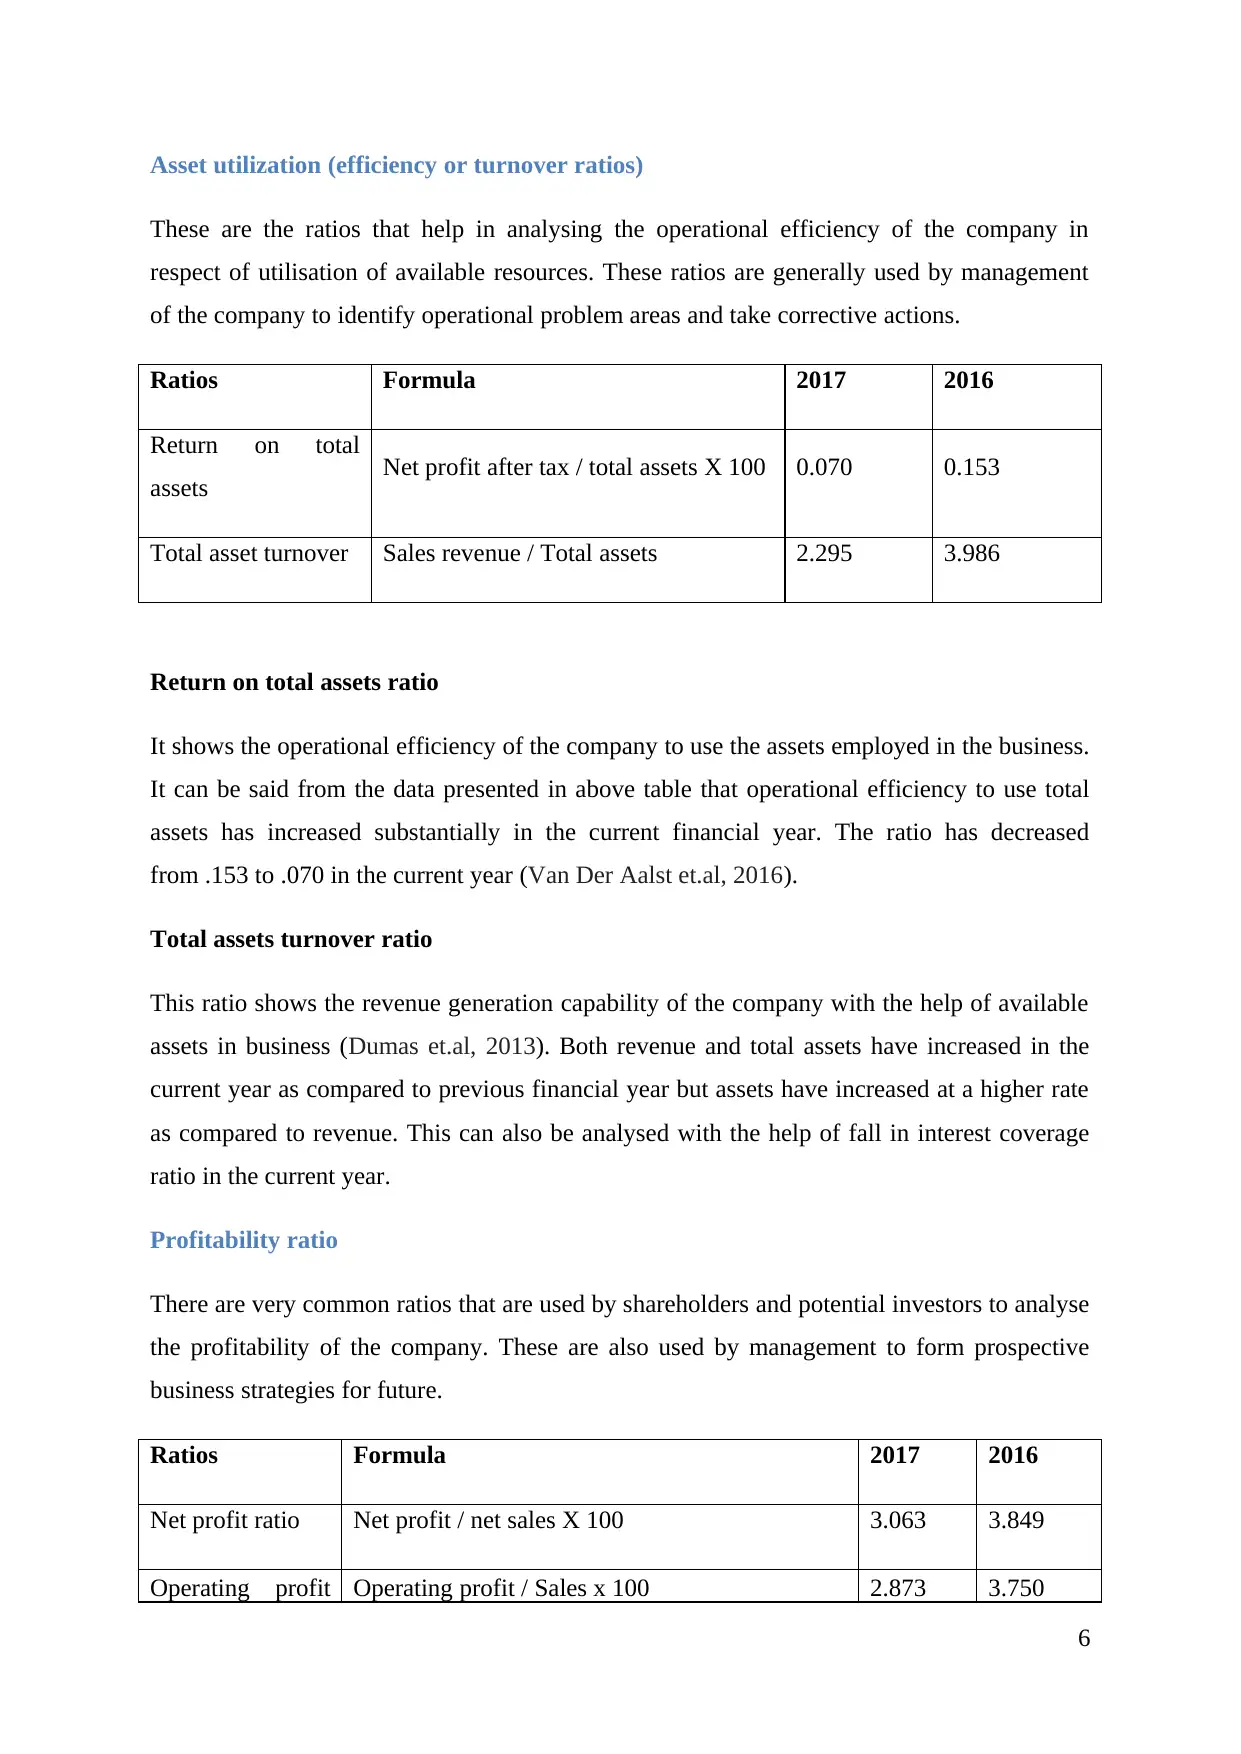
Asset utilization (efficiency or turnover ratios)
These are the ratios that help in analysing the operational efficiency of the company in
respect of utilisation of available resources. These ratios are generally used by management
of the company to identify operational problem areas and take corrective actions.
Ratios Formula 2017 2016
Return on total
assets Net profit after tax / total assets X 100 0.070 0.153
Total asset turnover Sales revenue / Total assets 2.295 3.986
Return on total assets ratio
It shows the operational efficiency of the company to use the assets employed in the business.
It can be said from the data presented in above table that operational efficiency to use total
assets has increased substantially in the current financial year. The ratio has decreased
from .153 to .070 in the current year (Van Der Aalst et.al, 2016).
Total assets turnover ratio
This ratio shows the revenue generation capability of the company with the help of available
assets in business (Dumas et.al, 2013). Both revenue and total assets have increased in the
current year as compared to previous financial year but assets have increased at a higher rate
as compared to revenue. This can also be analysed with the help of fall in interest coverage
ratio in the current year.
Profitability ratio
There are very common ratios that are used by shareholders and potential investors to analyse
the profitability of the company. These are also used by management to form prospective
business strategies for future.
Ratios Formula 2017 2016
Net profit ratio Net profit / net sales X 100 3.063 3.849
Operating profit Operating profit / Sales x 100 2.873 3.750
6
⊘ This is a preview!⊘
Do you want full access?
Subscribe today to unlock all pages.
Trusted by 1+ million students worldwide
ratio
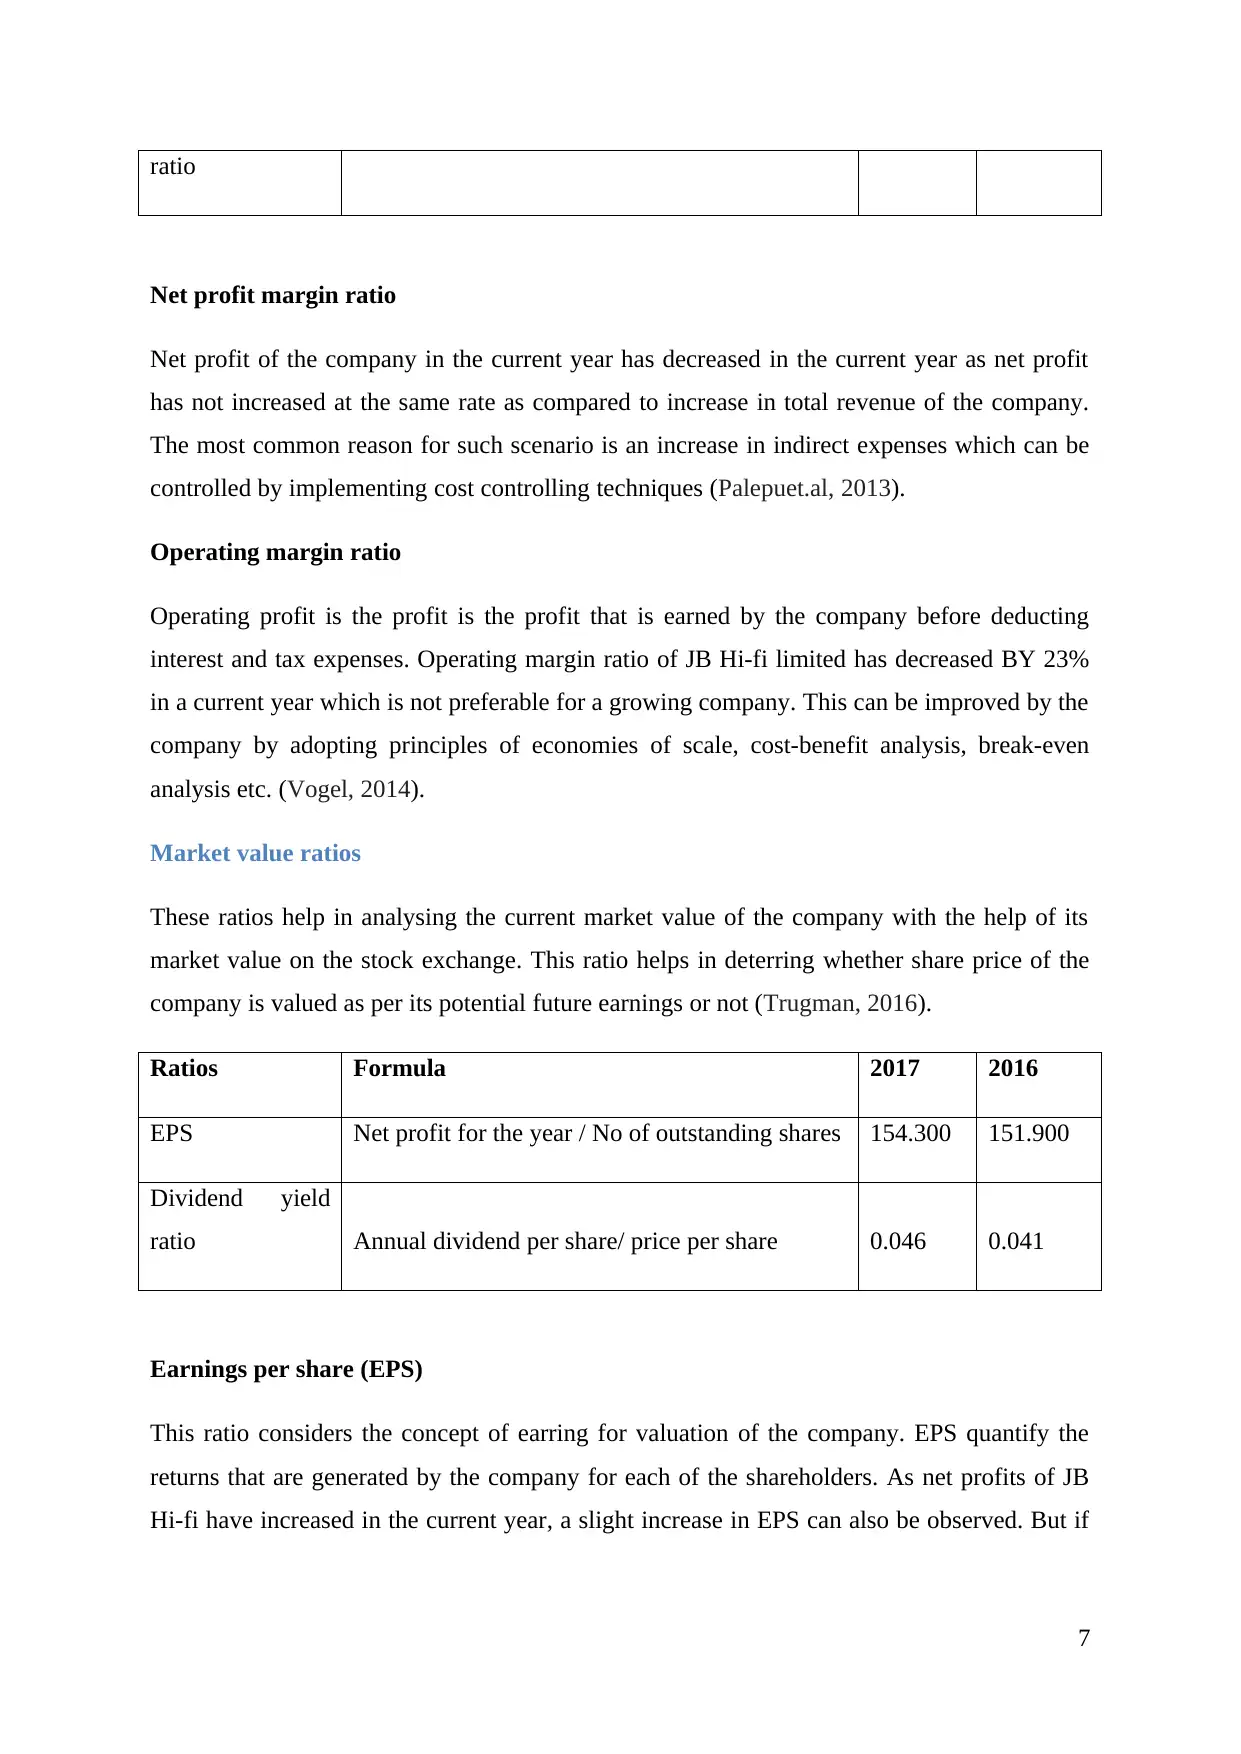
Net profit margin ratio
Net profit of the company in the current year has decreased in the current year as net profit
has not increased at the same rate as compared to increase in total revenue of the company.
The most common reason for such scenario is an increase in indirect expenses which can be
controlled by implementing cost controlling techniques (Palepuet.al, 2013).
Operating margin ratio
Operating profit is the profit is the profit that is earned by the company before deducting
interest and tax expenses. Operating margin ratio of JB Hi-fi limited has decreased BY 23%
in a current year which is not preferable for a growing company. This can be improved by the
company by adopting principles of economies of scale, cost-benefit analysis, break-even
analysis etc. (Vogel, 2014).
Market value ratios
These ratios help in analysing the current market value of the company with the help of its
market value on the stock exchange. This ratio helps in deterring whether share price of the
company is valued as per its potential future earnings or not (Trugman, 2016).
Ratios Formula 2017 2016
EPS Net profit for the year / No of outstanding shares 154.300 151.900
Dividend yield
ratio Annual dividend per share/ price per share 0.046 0.041
Earnings per share (EPS)
This ratio considers the concept of earring for valuation of the company. EPS quantify the
returns that are generated by the company for each of the shareholders. As net profits of JB
Hi-fi have increased in the current year, a slight increase in EPS can also be observed. But if
7
Paraphrase This Document
Need a fresh take? Get an instant paraphrase of this document with our AI Paraphraser
the increase in total assets and revenue is considered then it can be said that present increase
in EPS is not ideal.
Dividend yield ratio
It helps in depicting a relationship between dividend distributed by the company and its
market value. In simple words, dividend yield ratio shows the portion of the market value of
the company that is distributed in for of dividend (Bandurov, 2015). The dividend yield of the
company has increased in the current year as both dividend per share of the company and
market value of the company at the end of the financial year has increased.
8
Ratio analysis of Harvey Normal Limited
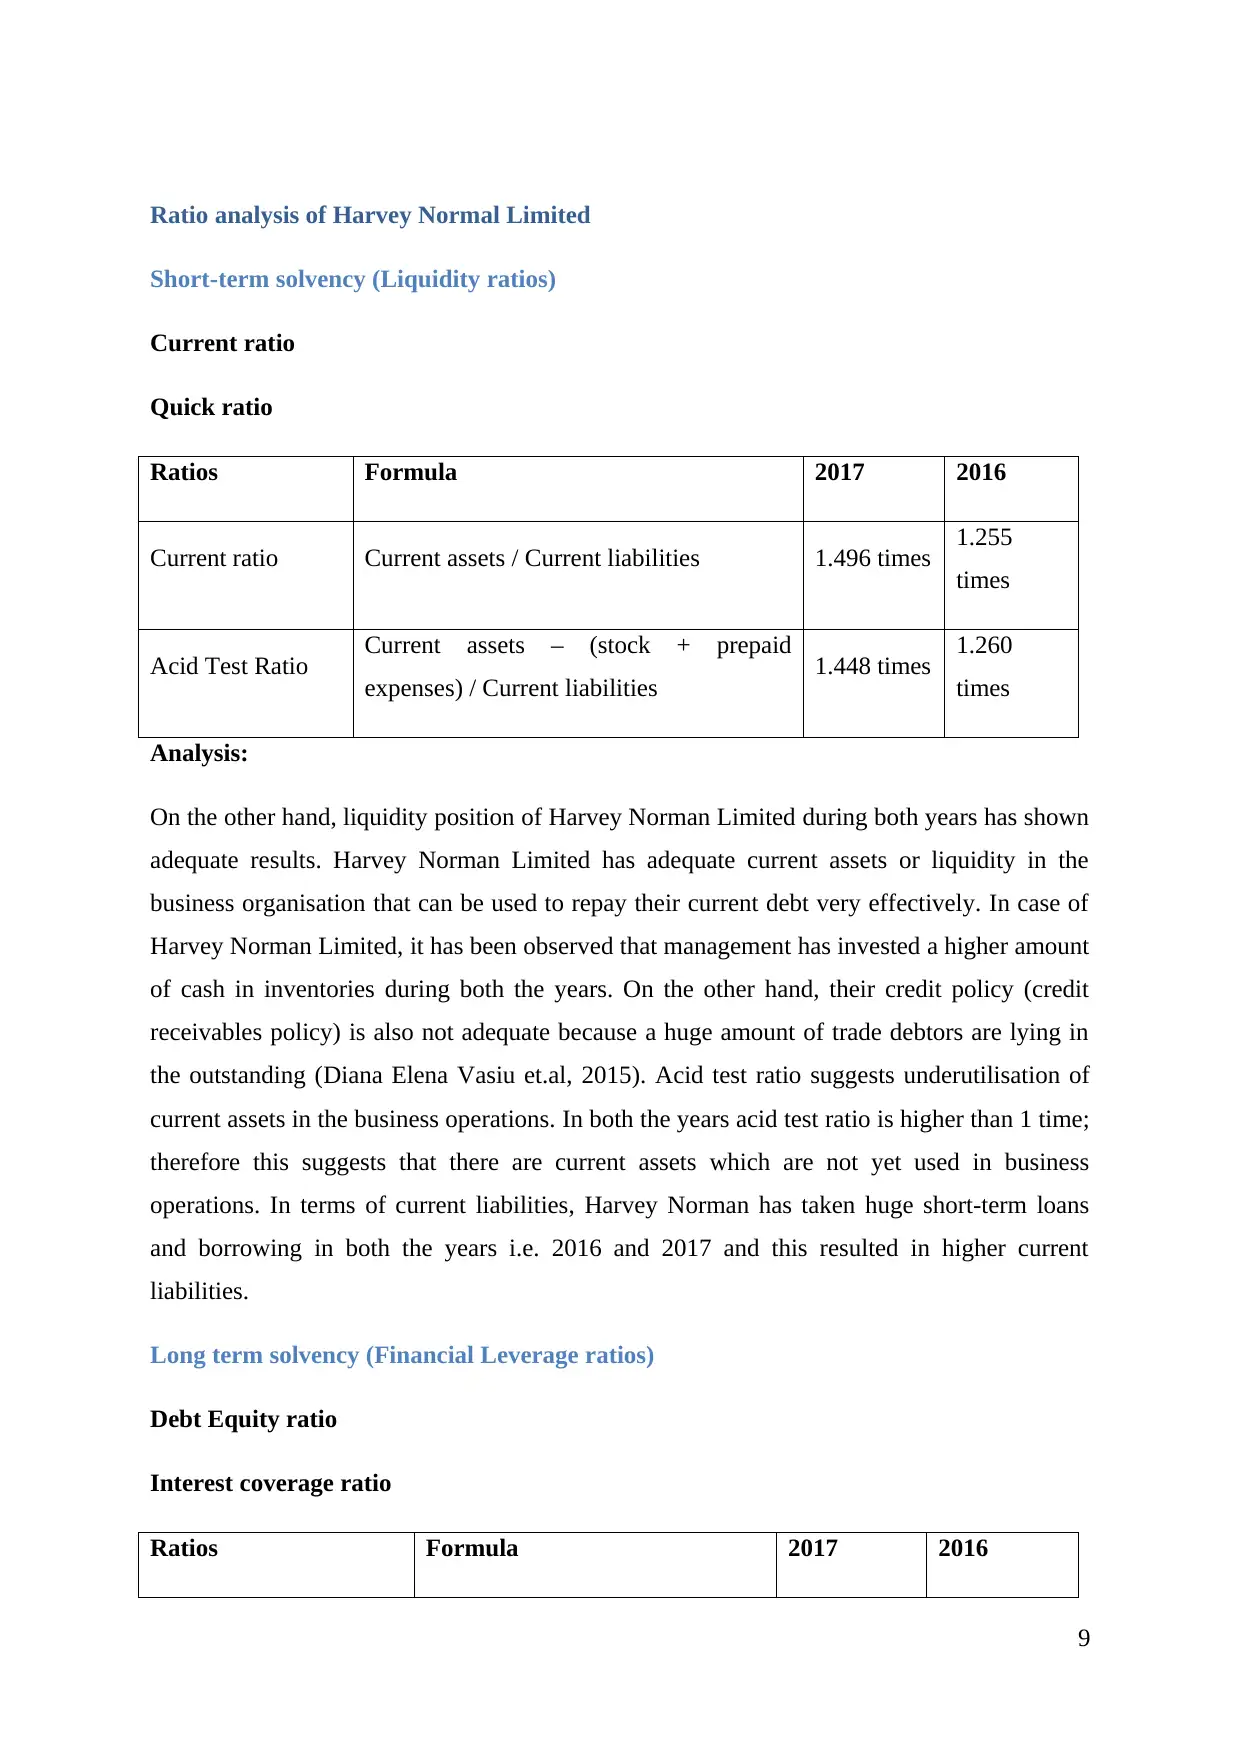
Short-term solvency (Liquidity ratios)
Current ratio
Quick ratio
Ratios Formula 2017 2016
Current ratio Current assets / Current liabilities 1.496 times 1.255
times
Acid Test Ratio Current assets – (stock + prepaid
expenses) / Current liabilities 1.448 times 1.260
times
Analysis:
On the other hand, liquidity position of Harvey Norman Limited during both years has shown
adequate results. Harvey Norman Limited has adequate current assets or liquidity in the
business organisation that can be used to repay their current debt very effectively. In case of
Harvey Norman Limited, it has been observed that management has invested a higher amount
of cash in inventories during both the years. On the other hand, their credit policy (credit
receivables policy) is also not adequate because a huge amount of trade debtors are lying in
the outstanding (Diana Elena Vasiu et.al, 2015). Acid test ratio suggests underutilisation of
current assets in the business operations. In both the years acid test ratio is higher than 1 time;
therefore this suggests that there are current assets which are not yet used in business
operations. In terms of current liabilities, Harvey Norman has taken huge short-term loans
and borrowing in both the years i.e. 2016 and 2017 and this resulted in higher current
liabilities.
Long term solvency (Financial Leverage ratios)
Debt Equity ratio
Interest coverage ratio
Ratios Formula 2017 2016
9
⊘ This is a preview!⊘
Do you want full access?
Subscribe today to unlock all pages.
Trusted by 1+ million students worldwide
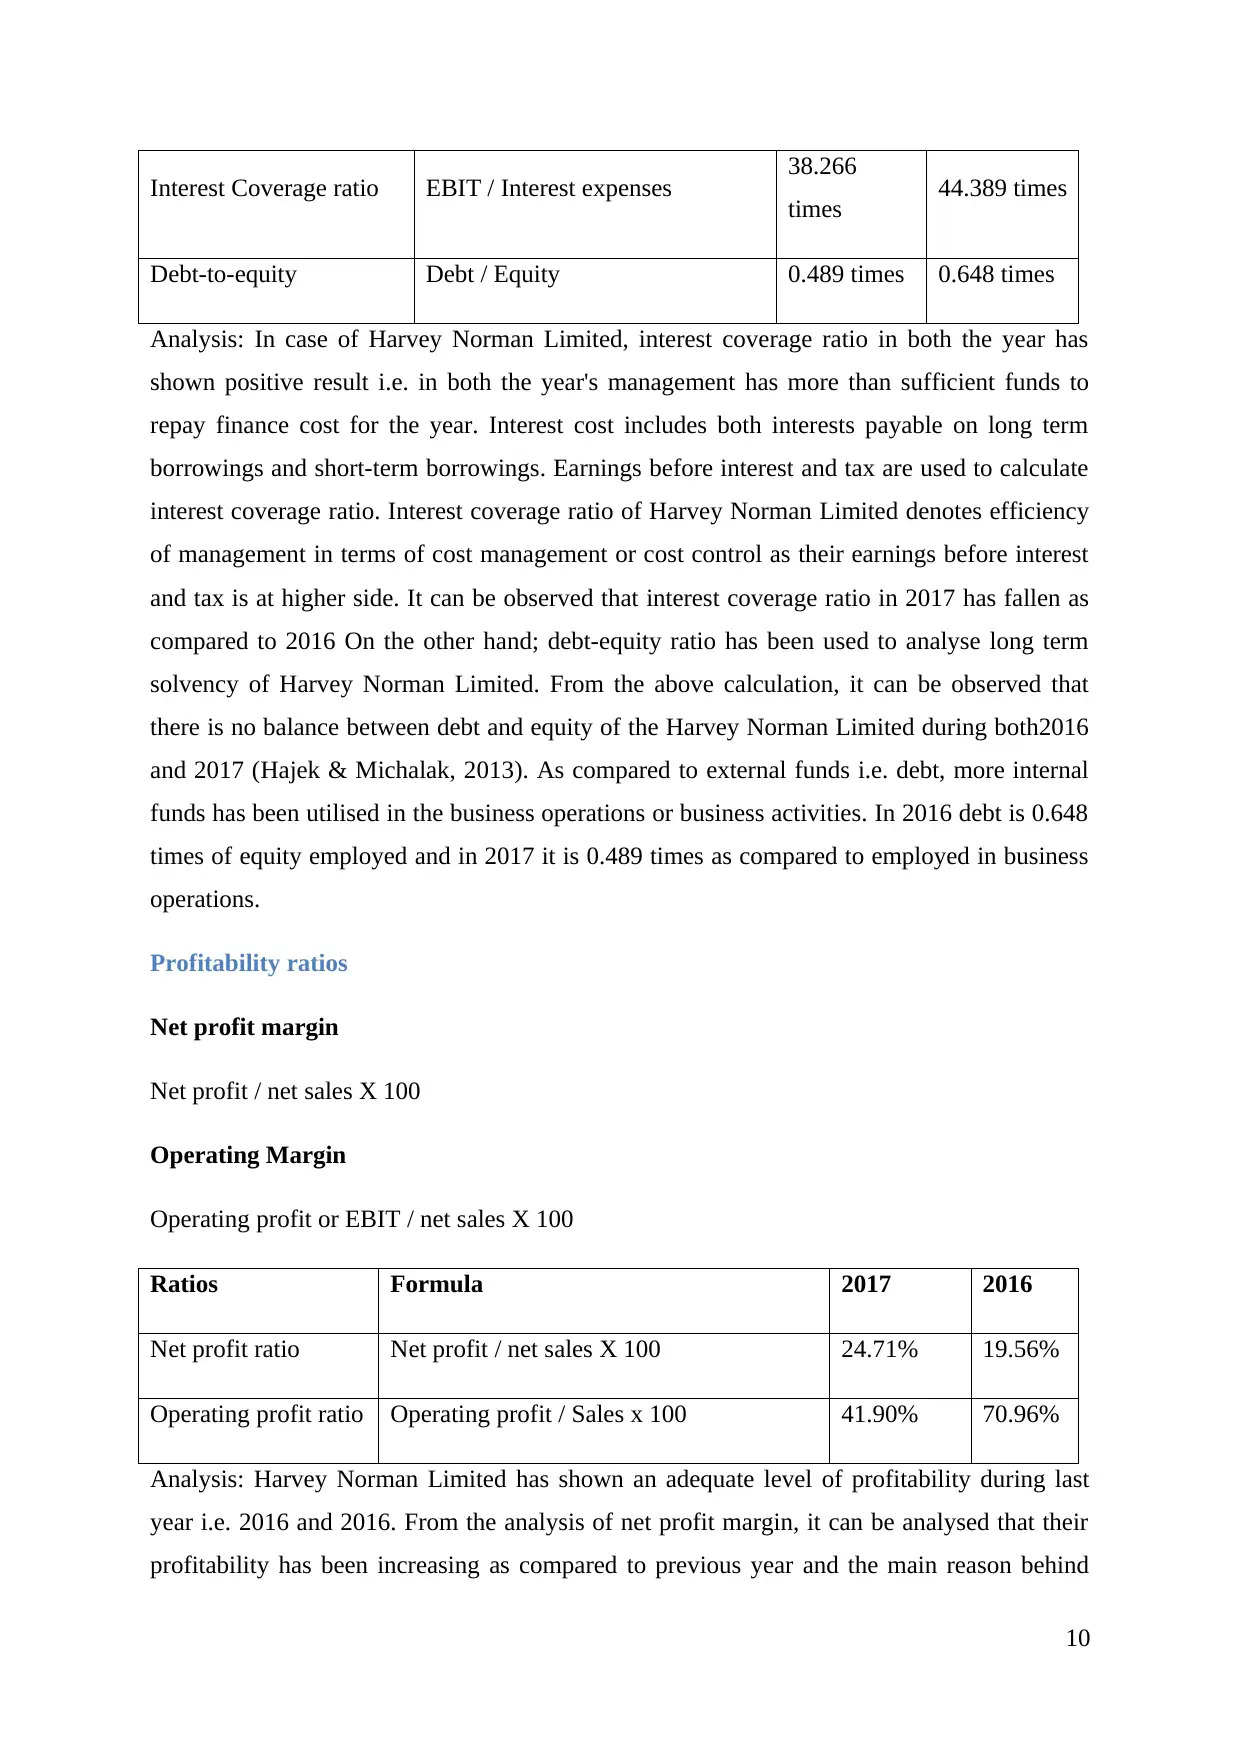
Interest Coverage ratio EBIT / Interest expenses 38.266
times 44.389 times
Debt-to-equity Debt / Equity 0.489 times 0.648 times
Analysis: In case of Harvey Norman Limited, interest coverage ratio in both the year has
shown positive result i.e. in both the year's management has more than sufficient funds to
repay finance cost for the year. Interest cost includes both interests payable on long term
borrowings and short-term borrowings. Earnings before interest and tax are used to calculate
interest coverage ratio. Interest coverage ratio of Harvey Norman Limited denotes efficiency
of management in terms of cost management or cost control as their earnings before interest
and tax is at higher side. It can be observed that interest coverage ratio in 2017 has fallen as
compared to 2016 On the other hand; debt-equity ratio has been used to analyse long term
solvency of Harvey Norman Limited. From the above calculation, it can be observed that
there is no balance between debt and equity of the Harvey Norman Limited during both2016
and 2017 (Hajek & Michalak, 2013). As compared to external funds i.e. debt, more internal
funds has been utilised in the business operations or business activities. In 2016 debt is 0.648
times of equity employed and in 2017 it is 0.489 times as compared to employed in business
operations.
Profitability ratios
Net profit margin
Net profit / net sales X 100
Operating Margin
Operating profit or EBIT / net sales X 100
Ratios Formula 2017 2016
Net profit ratio Net profit / net sales X 100 24.71% 19.56%
Operating profit ratio Operating profit / Sales x 100 41.90% 70.96%
Analysis: Harvey Norman Limited has shown an adequate level of profitability during last
year i.e. 2016 and 2016. From the analysis of net profit margin, it can be analysed that their
profitability has been increasing as compared to previous year and the main reason behind
10
Paraphrase This Document
Need a fresh take? Get an instant paraphrase of this document with our AI Paraphraser
this are increases swales level and moderate cost of sales level. As compared to industry
standards, Harvey Norman Limited has generated a moderate level of net profit during both
the years. On the other hand, operating profit of Harvey Norman Limited has shown most
favourable results in both the years (Merwe Oberholzer, 2012). In 2016 operating profit
margin of Harvey Norman Limited is 70.96 % which is very attractive for any investor or any
stakeholder. It has been observed that operating profit margin has been declined in 2017 and
the main reason behind this is an increase in expenses as compared to increase sales revenue.
That means sales revenue is increased with less, no and operating expenses has been
increased with higher margins (Hofmann & Lampe, 2013).
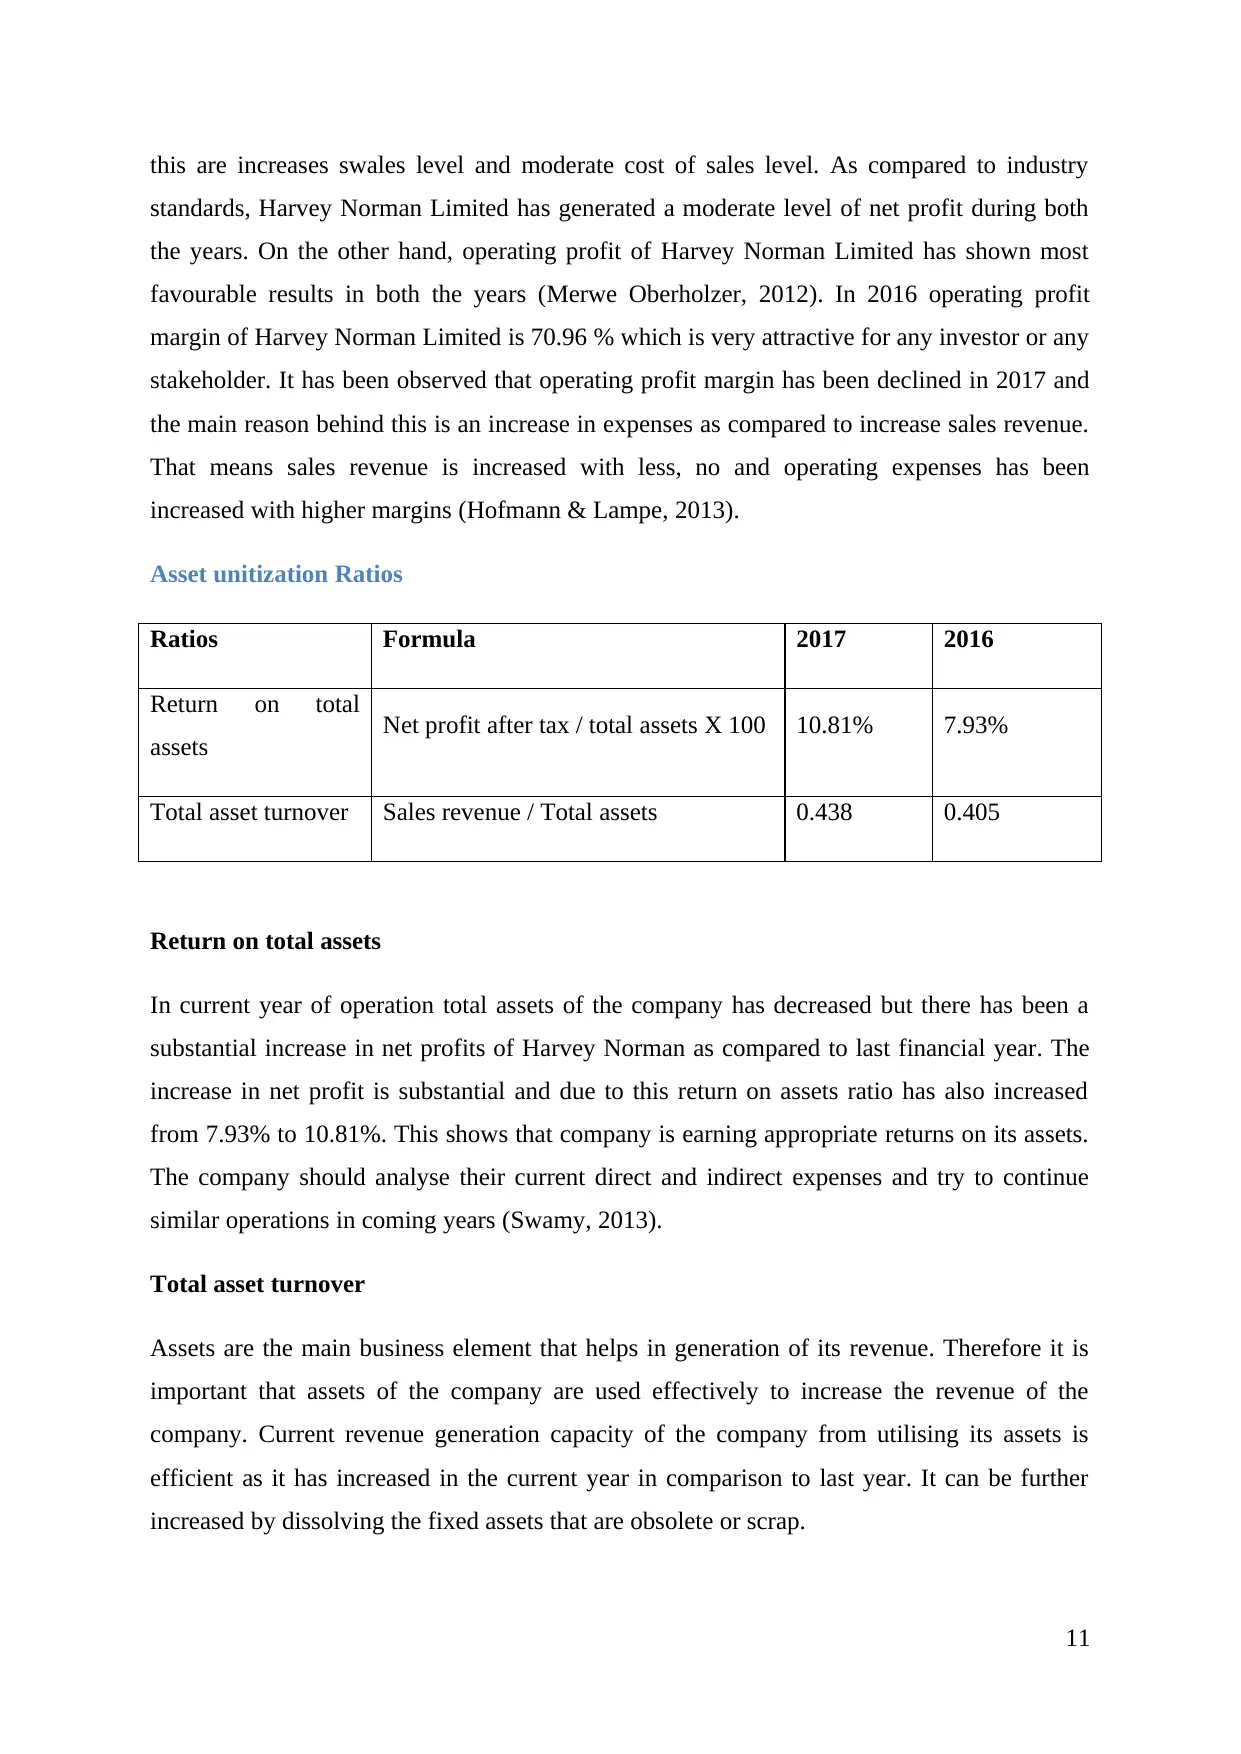
Asset unitization Ratios
Ratios Formula 2017 2016
Return on total
assets Net profit after tax / total assets X 100 10.81% 7.93%
Total asset turnover Sales revenue / Total assets 0.438 0.405
Return on total assets
In current year of operation total assets of the company has decreased but there has been a
substantial increase in net profits of Harvey Norman as compared to last financial year. The
increase in net profit is substantial and due to this return on assets ratio has also increased
from 7.93% to 10.81%. This shows that company is earning appropriate returns on its assets.
The company should analyse their current direct and indirect expenses and try to continue
similar operations in coming years (Swamy, 2013).
Total asset turnover
Assets are the main business element that helps in generation of its revenue. Therefore it is
important that assets of the company are used effectively to increase the revenue of the
company. Current revenue generation capacity of the company from utilising its assets is
efficient as it has increased in the current year in comparison to last year. It can be further
increased by dissolving the fixed assets that are obsolete or scrap.
11
standards, Harvey Norman Limited has generated a moderate level of net profit during both
the years. On the other hand, operating profit of Harvey Norman Limited has shown most
favourable results in both the years (Merwe Oberholzer, 2012). In 2016 operating profit
margin of Harvey Norman Limited is 70.96 % which is very attractive for any investor or any
stakeholder. It has been observed that operating profit margin has been declined in 2017 and
the main reason behind this is an increase in expenses as compared to increase sales revenue.
That means sales revenue is increased with less, no and operating expenses has been
increased with higher margins (Hofmann & Lampe, 2013).
Asset unitization Ratios
Ratios Formula 2017 2016
Return on total
assets Net profit after tax / total assets X 100 10.81% 7.93%
Total asset turnover Sales revenue / Total assets 0.438 0.405
Return on total assets
In current year of operation total assets of the company has decreased but there has been a
substantial increase in net profits of Harvey Norman as compared to last financial year. The
increase in net profit is substantial and due to this return on assets ratio has also increased
from 7.93% to 10.81%. This shows that company is earning appropriate returns on its assets.
The company should analyse their current direct and indirect expenses and try to continue
similar operations in coming years (Swamy, 2013).
Total asset turnover
Assets are the main business element that helps in generation of its revenue. Therefore it is
important that assets of the company are used effectively to increase the revenue of the
company. Current revenue generation capacity of the company from utilising its assets is
efficient as it has increased in the current year in comparison to last year. It can be further
increased by dissolving the fixed assets that are obsolete or scrap.
11
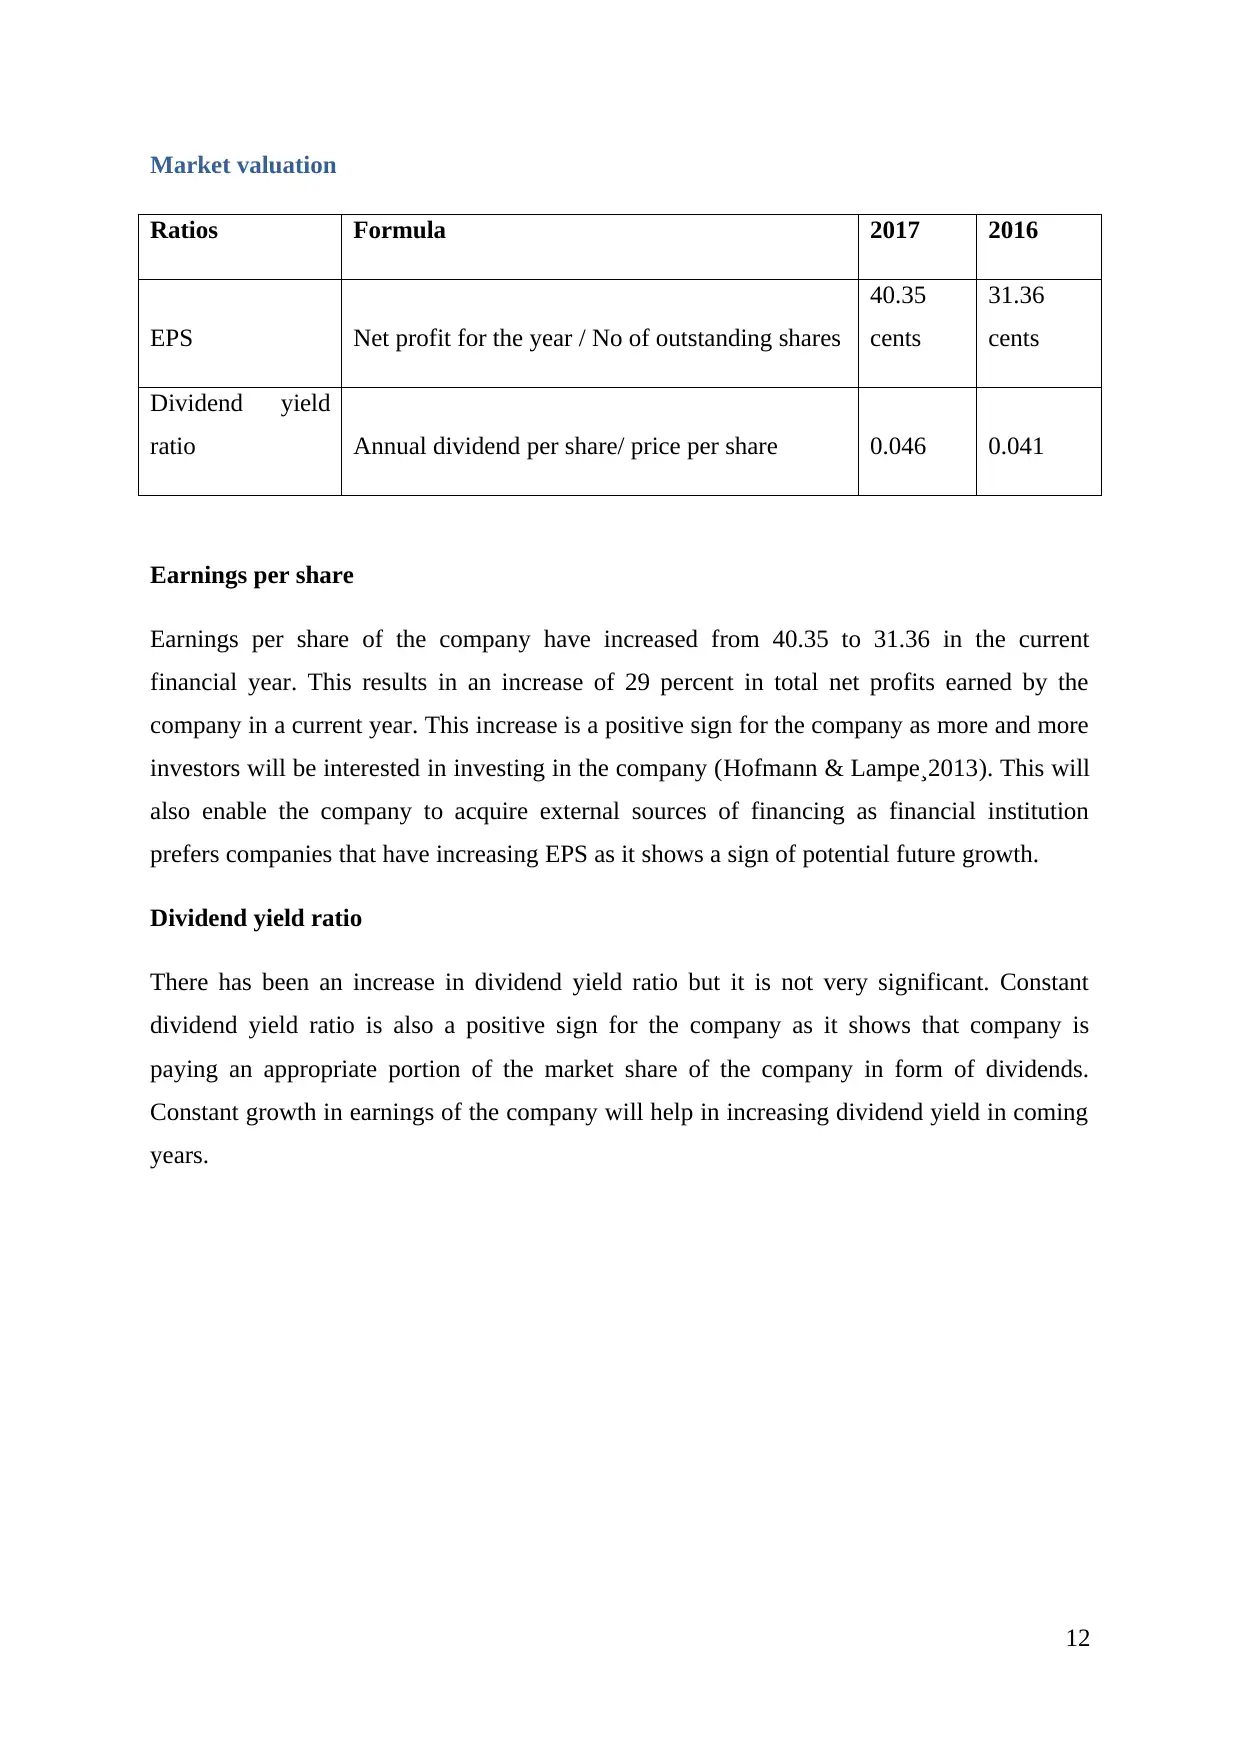
Market valuation
Ratios Formula 2017 2016
EPS Net profit for the year / No of outstanding shares
40.35
cents
31.36
cents
Dividend yield
ratio Annual dividend per share/ price per share 0.046 0.041
Earnings per share
Earnings per share of the company have increased from 40.35 to 31.36 in the current
financial year. This results in an increase of 29 percent in total net profits earned by the
company in a current year. This increase is a positive sign for the company as more and more
investors will be interested in investing in the company (Hofmann & Lampe¸2013). This will
also enable the company to acquire external sources of financing as financial institution
prefers companies that have increasing EPS as it shows a sign of potential future growth.
Dividend yield ratio
There has been an increase in dividend yield ratio but it is not very significant. Constant
dividend yield ratio is also a positive sign for the company as it shows that company is
paying an appropriate portion of the market share of the company in form of dividends.
Constant growth in earnings of the company will help in increasing dividend yield in coming
years.
12
⊘ This is a preview!⊘
Do you want full access?
Subscribe today to unlock all pages.
Trusted by 1+ million students worldwide
1 out of 20
Related Documents


Your All-in-One AI-Powered Toolkit for Academic Success.
+13062052269
info@desklib.com
Available 24*7 on WhatsApp / Email
![[object Object]](/_next/static/media/star-bottom.7253800d.svg)
Unlock your academic potential
Copyright © 2020–2026 A2Z Services. All Rights Reserved. Developed and managed by ZUCOL.