Managing Finance: A Comparative Financial Analysis of Two Companies
VerifiedAdded on 2022/07/28
|16
|3138
|12
Report
AI Summary
This report presents a comprehensive financial analysis of Alumina Limited and BlueScope Limited, two companies listed on the Australian Securities Exchange (ASX). The analysis encompasses a detailed examination of their financial statements, profitability ratios (gross profit margin, net profit margin, return on assets, and return on equity), liquidity ratios (current ratio, quick ratio), and investment ratios (earnings per share, dividend per share, dividend payout ratio, price-to-earnings ratio). The report also explores the capital structure of both companies, including debt ratios and debt-to-equity ratios, and calculates the Weighted Average Cost of Capital (WACC). Furthermore, it applies discounted cash flow (DCF) and relative valuation techniques to assess the intrinsic value of shares. The report concludes with investment recommendations based on the findings, providing a valuable resource for students studying financial management and investment analysis.
0
Running head: MANAGING FINANCE
Managing finance
Name of the student
Name of the university
Student ID
Author note
Running head: MANAGING FINANCE
Managing finance
Name of the student
Name of the university
Student ID
Author note
Paraphrase This Document
Need a fresh take? Get an instant paraphrase of this document with our AI Paraphraser
1
MANAGING FINANCE
Table of Contents
Introduction......................................................................................................................................2
Overview of Alumina Limited.........................................................................................................2
Overview of Bluescope Limited......................................................................................................3
Financial statement analysis compare between Alumina Limited and BlueScope Limited............4
Ratio analysis and comparison between Alumina Limited and BlueScope Limited.......................4
Net Profit margin.............................................................................................................................5
Analysis of liquidity ratio between Alumina Limited and BlueScope Limited..............................6
Investment ratio comparison between Alumina Limited and BlueScope Limited..........................6
Capital structure of Alumina Limited and BlueScope Limited.......................................................8
Historical Weighted Average Cost of Capital- WACC...................................................................9
Discounted cash flow technique......................................................................................................9
Relative Valuation technique.........................................................................................................11
Conclusion.....................................................................................................................................12
Reference.......................................................................................................................................13
2
MANAGING FINANCE
Introduction
Financial management is the key success matter within an organization. It generally
means planning, controlling, directing the financial activities, such as procurement and
utilization of fund of the business concern. This paper critically evaluate the financial
management and extract the financial decision, which is relate to the raising of finance from the
various financial resources, which will depend upon certain type of sources, cost of financiang,
period of financing and returns. The introduction of this research suggests how the relationship
will build on the financial statement analysis and risk and return evaluation structure of capital
and share valuation. With the analysis of two companies named as Alumina limited and
BlueScope limited, this paper critically evaluate the financial strength of these two companies
towards the investors. By this study an investor came to understand the ratio analysis, capital
structure of the company, Discounted cashflow technique, WACC with a financial note.
Overview of Alumina Limited
Alumina Limited, is the publicly listed company on the Australian Securities exchange
and the over the couter market in US. It is one of the top 100 listed company on the ASX by the
market capitalization. The strategy of the company is to invest in world wide in bauxite mining,
alumina refining and selected aluminium smelting operations through our 40% ownership of
Alcoa World Alumina & Chemicals. Alumina Limited is a leading Australian resource company
which has a specific focus on alumina. The reamaing 60% owns by the company’s partner
AWAC to manage day to day operations. AWAC employes 5000 people to mine who produce
alumina. Market the alumina to the world’s aluminum smelters and process a percentage to
manufacture the alumina metal (aluminalimited.com, 2020).
⊘ This is a preview!⊘
Do you want full access?
Subscribe today to unlock all pages.
Trusted by 1+ million students worldwide
3
MANAGING FINANCE
Traded symbol: AWC. AX
Market price: $1.0
Overview of Bluescope Limited
Bluescope limited is an Australian flat product steel producer with the resource coming
from New Zealand. The comoany has built up a strong foundation of growth with a diverse
portfolio business in some of the fastest growing economies in the world, their storng balance
sheet which enables a strategic flexibility. The successful global partnership assures to prosper in
the widely diverse market. Blue scope has a strategic focus that it acts as a global leader in a
premium branded coated and painted steel products the third largest manufacturer of painted an
dcoated steel products globally. The company has a great strengths in a significant steel
buildings in a key markets. It is the commitment of BlueScope to deliver value from steel
making in Australia and New Zealand to remain the cost effective and deliver value continuously
through the cycle. The key pillar of the strategy of this company is the financial strength and it
supports a value creation for the various investors. The company’s framework suggests the value
creation which is based on the quality of earnings, return on invested capital, ctredible
progeressive plan and the balance sheet strength (bluescope.com, 2020).
Trade symbol: BSL.AX
Market price: $6.61
Paraphrase This Document
Need a fresh take? Get an instant paraphrase of this document with our AI Paraphraser
4
MANAGING FINANCE
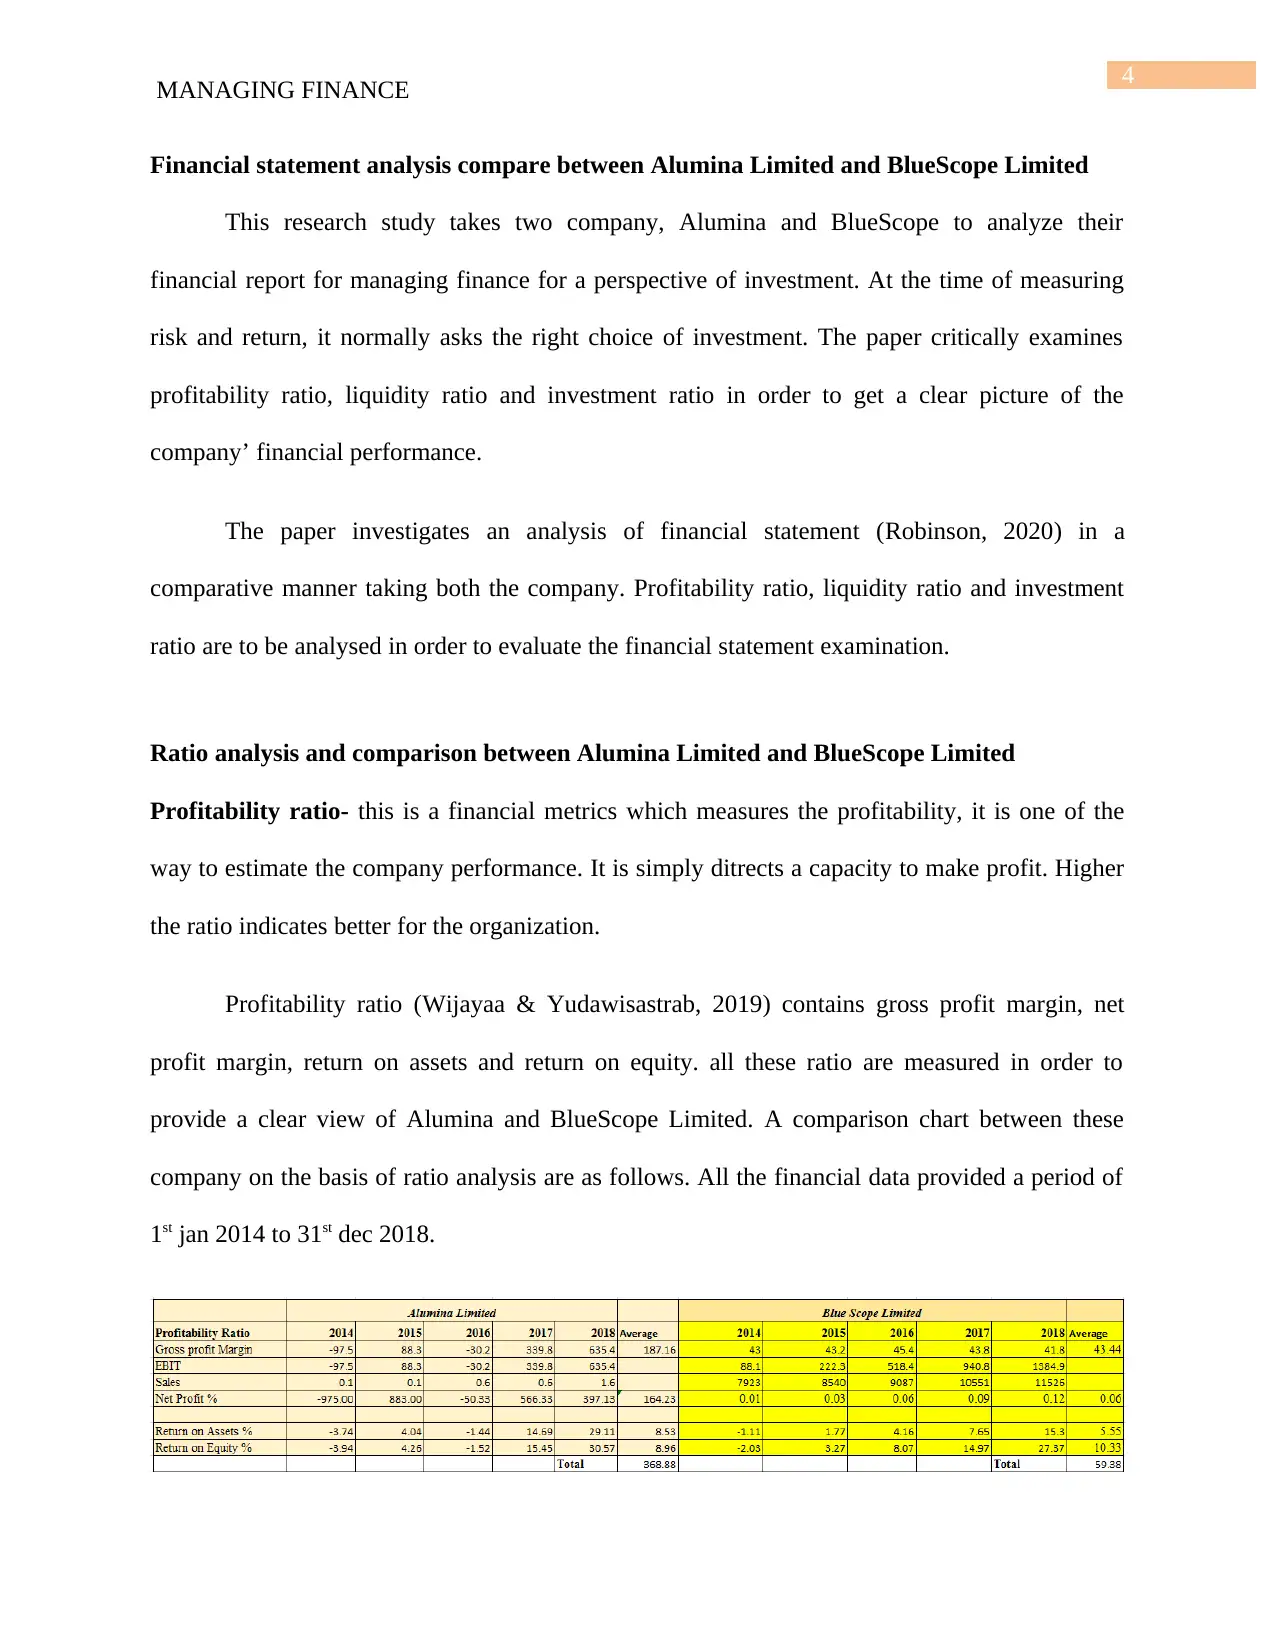
Financial statement analysis compare between Alumina Limited and BlueScope Limited
This research study takes two company, Alumina and BlueScope to analyze their
financial report for managing finance for a perspective of investment. At the time of measuring
risk and return, it normally asks the right choice of investment. The paper critically examines
profitability ratio, liquidity ratio and investment ratio in order to get a clear picture of the
company’ financial performance.
The paper investigates an analysis of financial statement (Robinson, 2020) in a
comparative manner taking both the company. Profitability ratio, liquidity ratio and investment
ratio are to be analysed in order to evaluate the financial statement examination.
Ratio analysis and comparison between Alumina Limited and BlueScope Limited
Profitability ratio- this is a financial metrics which measures the profitability, it is one of the
way to estimate the company performance. It is simply ditrects a capacity to make profit. Higher
the ratio indicates better for the organization.
Profitability ratio (Wijayaa & Yudawisastrab, 2019) contains gross profit margin, net
profit margin, return on assets and return on equity. all these ratio are measured in order to
provide a clear view of Alumina and BlueScope Limited. A comparison chart between these
company on the basis of ratio analysis are as follows. All the financial data provided a period of
1st jan 2014 to 31st dec 2018.
MANAGING FINANCE
Financial statement analysis compare between Alumina Limited and BlueScope Limited
This research study takes two company, Alumina and BlueScope to analyze their
financial report for managing finance for a perspective of investment. At the time of measuring
risk and return, it normally asks the right choice of investment. The paper critically examines
profitability ratio, liquidity ratio and investment ratio in order to get a clear picture of the
company’ financial performance.
The paper investigates an analysis of financial statement (Robinson, 2020) in a
comparative manner taking both the company. Profitability ratio, liquidity ratio and investment
ratio are to be analysed in order to evaluate the financial statement examination.
Ratio analysis and comparison between Alumina Limited and BlueScope Limited
Profitability ratio- this is a financial metrics which measures the profitability, it is one of the
way to estimate the company performance. It is simply ditrects a capacity to make profit. Higher
the ratio indicates better for the organization.
Profitability ratio (Wijayaa & Yudawisastrab, 2019) contains gross profit margin, net
profit margin, return on assets and return on equity. all these ratio are measured in order to
provide a clear view of Alumina and BlueScope Limited. A comparison chart between these
company on the basis of ratio analysis are as follows. All the financial data provided a period of
1st jan 2014 to 31st dec 2018.
5
MANAGING FINANCE
Gross profit margin
This is one of the financial metrics which measures the company’s financial helth.
Alumina Limited shows an increasing gross profit margin (Popescu, 2017) over the years. It
shows 187.16% aggregately. On the otherhand BlueScope Limited has shown 43.44% groos
profit margin averagely, therefore Alumina Limited is having a better financial health.
Net Profit margin
This is the percentage of revenue which leftovers after all operating expenses, interest,
taxes and preferred stock dividends. Often an investors look at net profit margin closely as how a
company converted its revenue into profits. Clearly Alumina Limited shows 164%, net profit
margin. Good for investors (Egam, Ilat & Pangerapan, 2017).
Return on assets
This displays a net incomes percentage out of the company’s total assets. For the
Alumina Limited the average is 8.53% and for BlueScope Limited is 5.55% (Al Nimer, Warrad
& Al Omari, 2015).
Return on Equity
The return on equity, distributes a rate of return on investment which is a mirror of the
investment, it is key factor of the shareholders. Return on equity ratio refers that the Alumina
Limited is 9% approximately but in case of BlueScope Limited having approximately 10% ROE
(Ichsani & Suhardi, 2015).
⊘ This is a preview!⊘
Do you want full access?
Subscribe today to unlock all pages.
Trusted by 1+ million students worldwide
6
MANAGING FINANCE
Total average of the various profitability ratio displays Alumina Limited is better the
BluScope as it is 368.88% on an average.
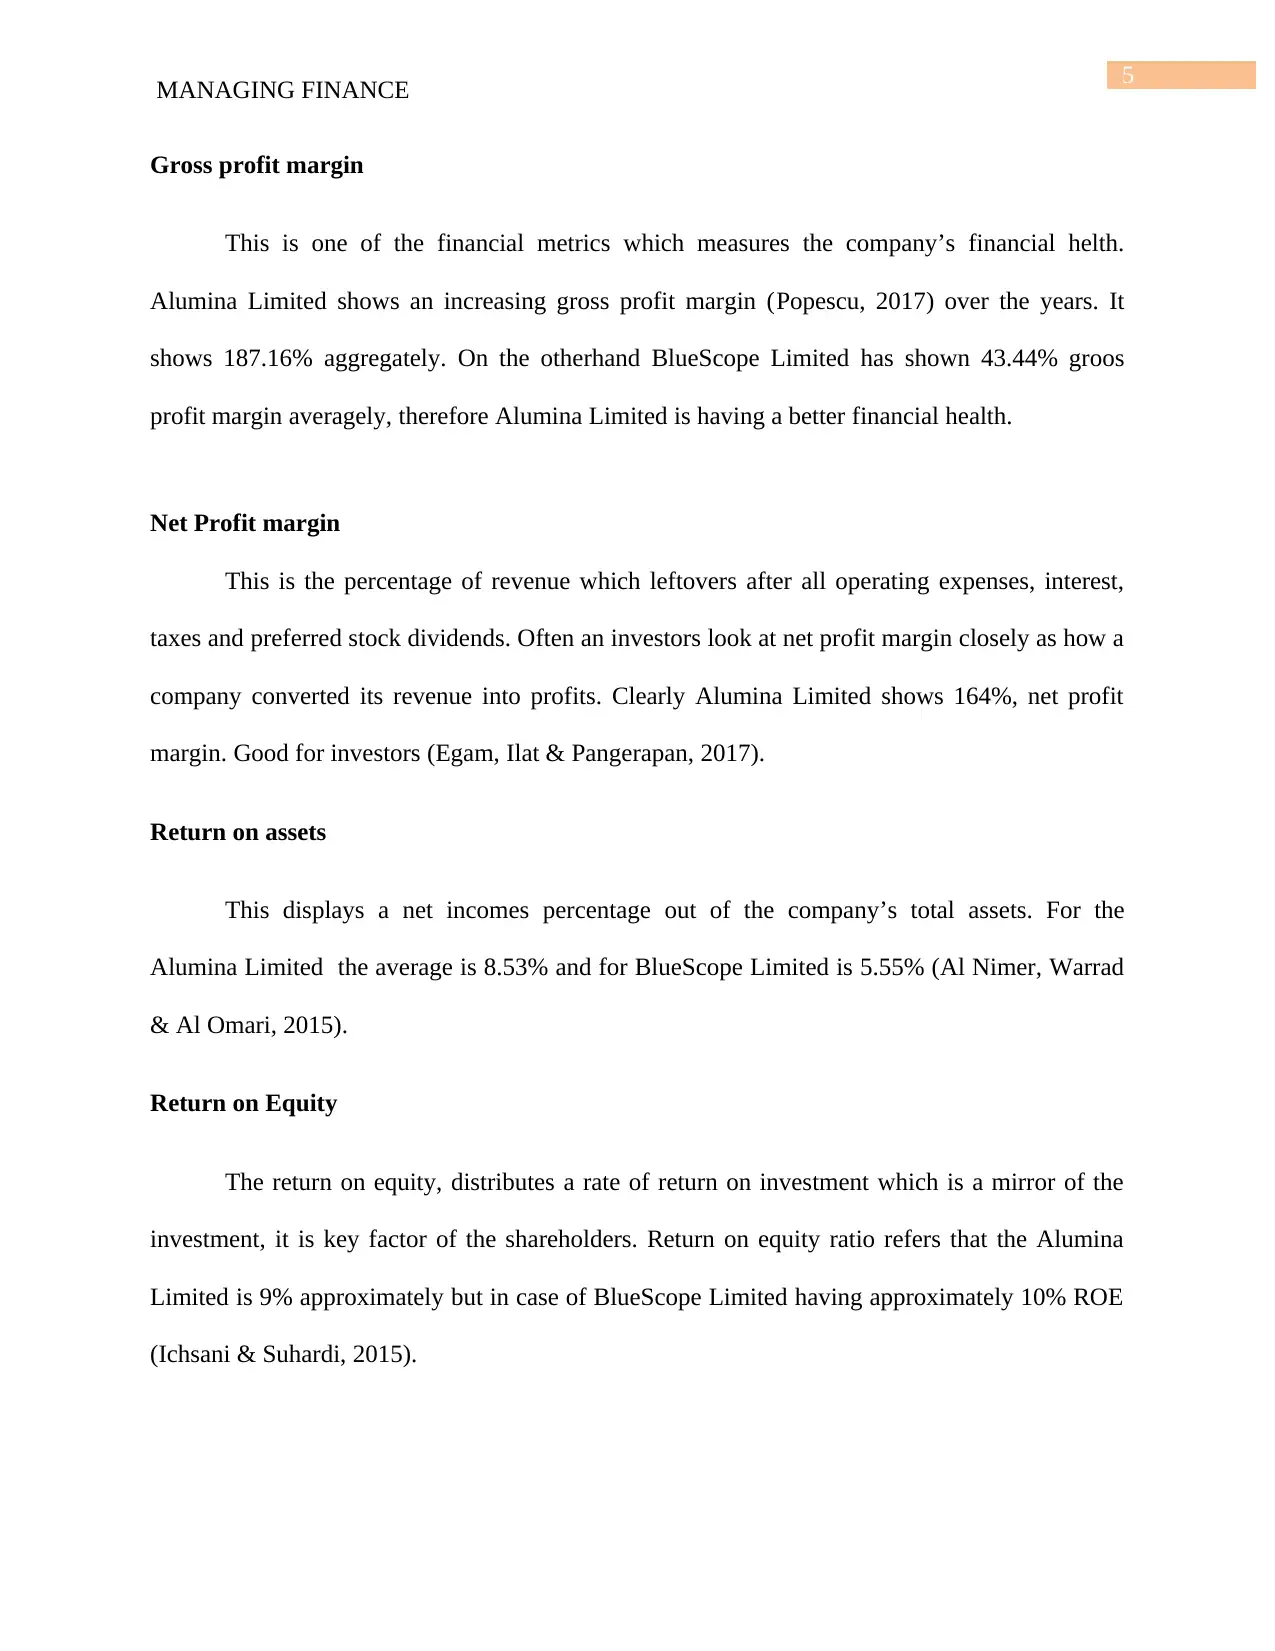
Analysis of liquidity ratio between Alumina Limited and BlueScope Limited
The study analyse the liquidity ratio of these two company and frames as per below:
Liquidity ratio defines a cash position available within the company which helps to
mitigate the current obligation. It comprises of current ratio and current liability. (Rahayu &
Hari, 2016).
Current ratio- It is a popular metrics which is used to across the industry on the company’s
short term liquidity. This current ratio often indicates the financial helath. The average of current
ratio is 9.68% and the average of BlueScope is 1.58%. Alumina Limited shows a better picture
towards the current ratio. Desirable current ratio is >1 (Rahayu & Hari, 2016).
Quick ratio- it is laso known as acid test ratio that directs how well a company can meet its
short term financial obligations. The quick ratio can calculates as total amount of cash+
marketable securities+ accounts receivable to the current liability. Looking at the analysis it can
be said that Alumina Limite is having far better liquid postion.
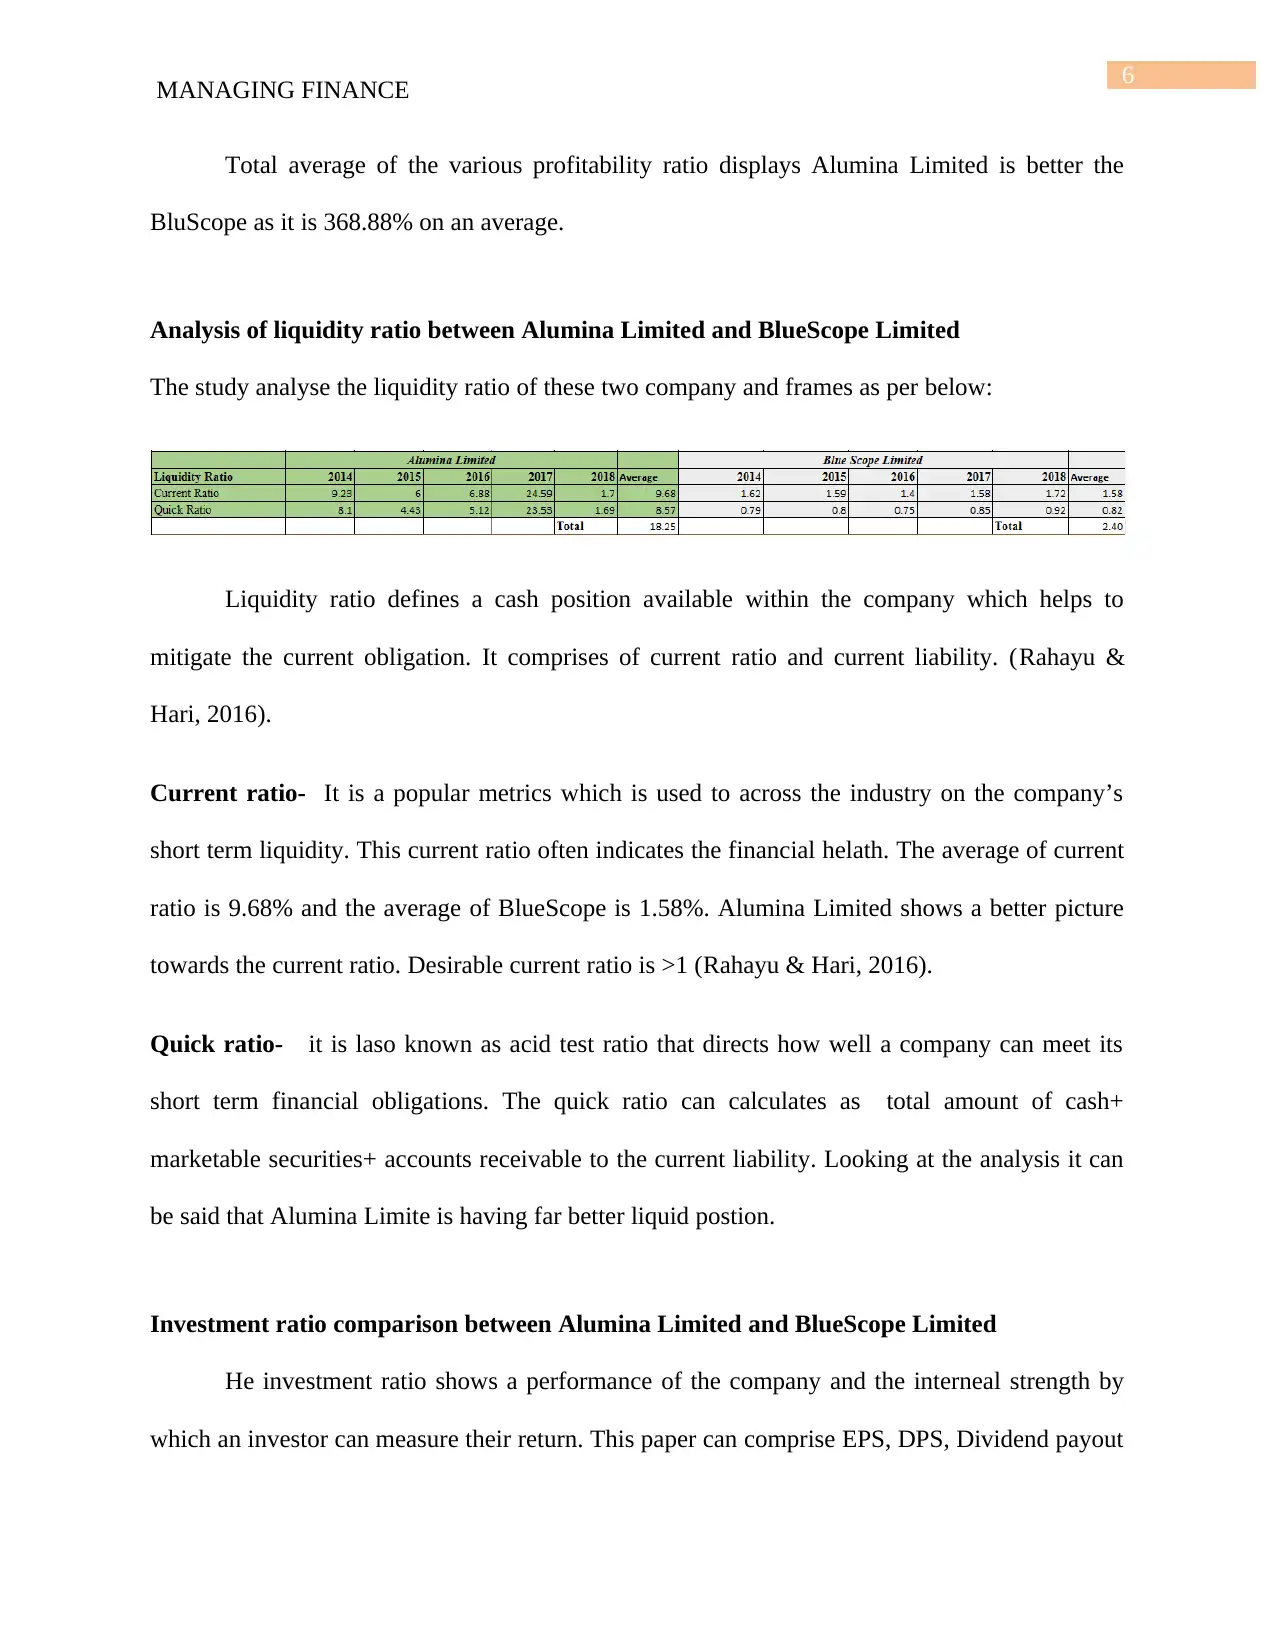
Investment ratio comparison between Alumina Limited and BlueScope Limited
He investment ratio shows a performance of the company and the interneal strength by
which an investor can measure their return. This paper can comprise EPS, DPS, Dividend payout
MANAGING FINANCE
Total average of the various profitability ratio displays Alumina Limited is better the
BluScope as it is 368.88% on an average.
Analysis of liquidity ratio between Alumina Limited and BlueScope Limited
The study analyse the liquidity ratio of these two company and frames as per below:
Liquidity ratio defines a cash position available within the company which helps to
mitigate the current obligation. It comprises of current ratio and current liability. (Rahayu &
Hari, 2016).
Current ratio- It is a popular metrics which is used to across the industry on the company’s
short term liquidity. This current ratio often indicates the financial helath. The average of current
ratio is 9.68% and the average of BlueScope is 1.58%. Alumina Limited shows a better picture
towards the current ratio. Desirable current ratio is >1 (Rahayu & Hari, 2016).
Quick ratio- it is laso known as acid test ratio that directs how well a company can meet its
short term financial obligations. The quick ratio can calculates as total amount of cash+
marketable securities+ accounts receivable to the current liability. Looking at the analysis it can
be said that Alumina Limite is having far better liquid postion.
Investment ratio comparison between Alumina Limited and BlueScope Limited
He investment ratio shows a performance of the company and the interneal strength by
which an investor can measure their return. This paper can comprise EPS, DPS, Dividend payout
Paraphrase This Document
Need a fresh take? Get an instant paraphrase of this document with our AI Paraphraser
7
MANAGING FINANCE
ratio, Dividend yield and PE ratio. Here the total average suggests that the BlueScope Limited is
holding a sound investment metrics.
Invetment ratio (Lordkipanidze, 2019) describes of both the companies are mentioned
below:
Earning Per Share- this ratio implies that the ability to produce net profits for common
shareholders. Here BlueScope Limited shows 0.932 as an average better than Alumina limited as
0.09 (Nurfadillah, 2016).
DPS- it is the sum of diuvidend that decleared by a business corporation for every ordinary
shares. Alumina Limited is 0.094 and BlueScope is 0.054. Better for Alumina Limited (Ansar,
Butt & Shah, 2015).
Dividend payout ratio- Alumina Limited shows 0.823 and BlueScope shows 12.009. it is the
portion of earnings paid to the shareholders out of the company (Hasan et al 2015).
PE ratio- Price to earning ratio is a measure of the share price which is related to the annual net
income that is earned by the firm per share. Here BlueScope Limited shows a positive PE ratio
(Meher & Sharma, 2015).
8
MANAGING FINANCE
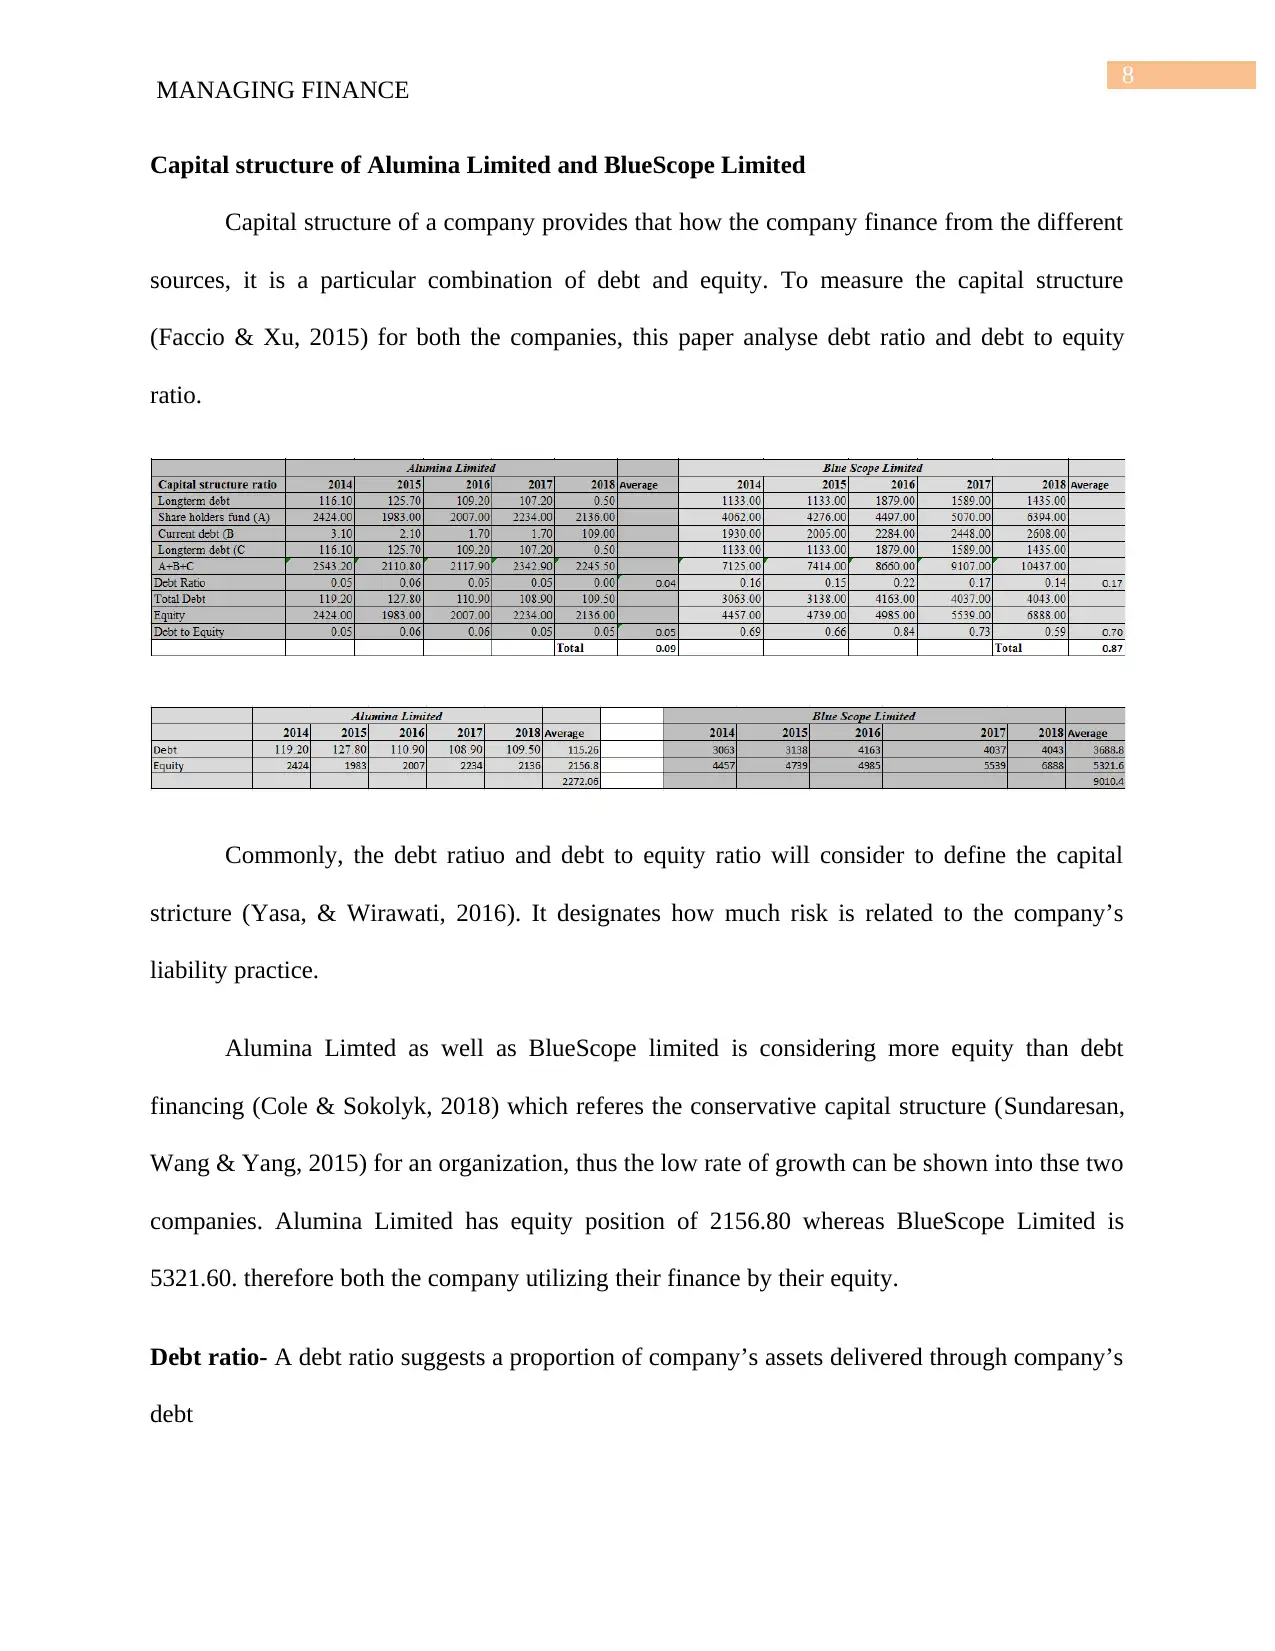
Capital structure of Alumina Limited and BlueScope Limited
Capital structure of a company provides that how the company finance from the different
sources, it is a particular combination of debt and equity. To measure the capital structure
(Faccio & Xu, 2015) for both the companies, this paper analyse debt ratio and debt to equity
ratio.
Commonly, the debt ratiuo and debt to equity ratio will consider to define the capital
stricture (Yasa, & Wirawati, 2016). It designates how much risk is related to the company’s
liability practice.
Alumina Limted as well as BlueScope limited is considering more equity than debt
financing (Cole & Sokolyk, 2018) which referes the conservative capital structure (Sundaresan,
Wang & Yang, 2015) for an organization, thus the low rate of growth can be shown into thse two
companies. Alumina Limited has equity position of 2156.80 whereas BlueScope Limited is
5321.60. therefore both the company utilizing their finance by their equity.
Debt ratio- A debt ratio suggests a proportion of company’s assets delivered through company’s
debt
MANAGING FINANCE
Capital structure of Alumina Limited and BlueScope Limited
Capital structure of a company provides that how the company finance from the different
sources, it is a particular combination of debt and equity. To measure the capital structure
(Faccio & Xu, 2015) for both the companies, this paper analyse debt ratio and debt to equity
ratio.
Commonly, the debt ratiuo and debt to equity ratio will consider to define the capital
stricture (Yasa, & Wirawati, 2016). It designates how much risk is related to the company’s
liability practice.
Alumina Limted as well as BlueScope limited is considering more equity than debt
financing (Cole & Sokolyk, 2018) which referes the conservative capital structure (Sundaresan,
Wang & Yang, 2015) for an organization, thus the low rate of growth can be shown into thse two
companies. Alumina Limited has equity position of 2156.80 whereas BlueScope Limited is
5321.60. therefore both the company utilizing their finance by their equity.
Debt ratio- A debt ratio suggests a proportion of company’s assets delivered through company’s
debt
⊘ This is a preview!⊘
Do you want full access?
Subscribe today to unlock all pages.
Trusted by 1+ million students worldwide
9
MANAGING FINANCE
Debt to Equity ratio- This research study also analyse debt to equity ratio, it reflects a fraction
of a company’s financing that ususally comes from creditors or investors. Higher the ratio
indicates financing more by the creditors. Both the compny has indiacted less percentage.
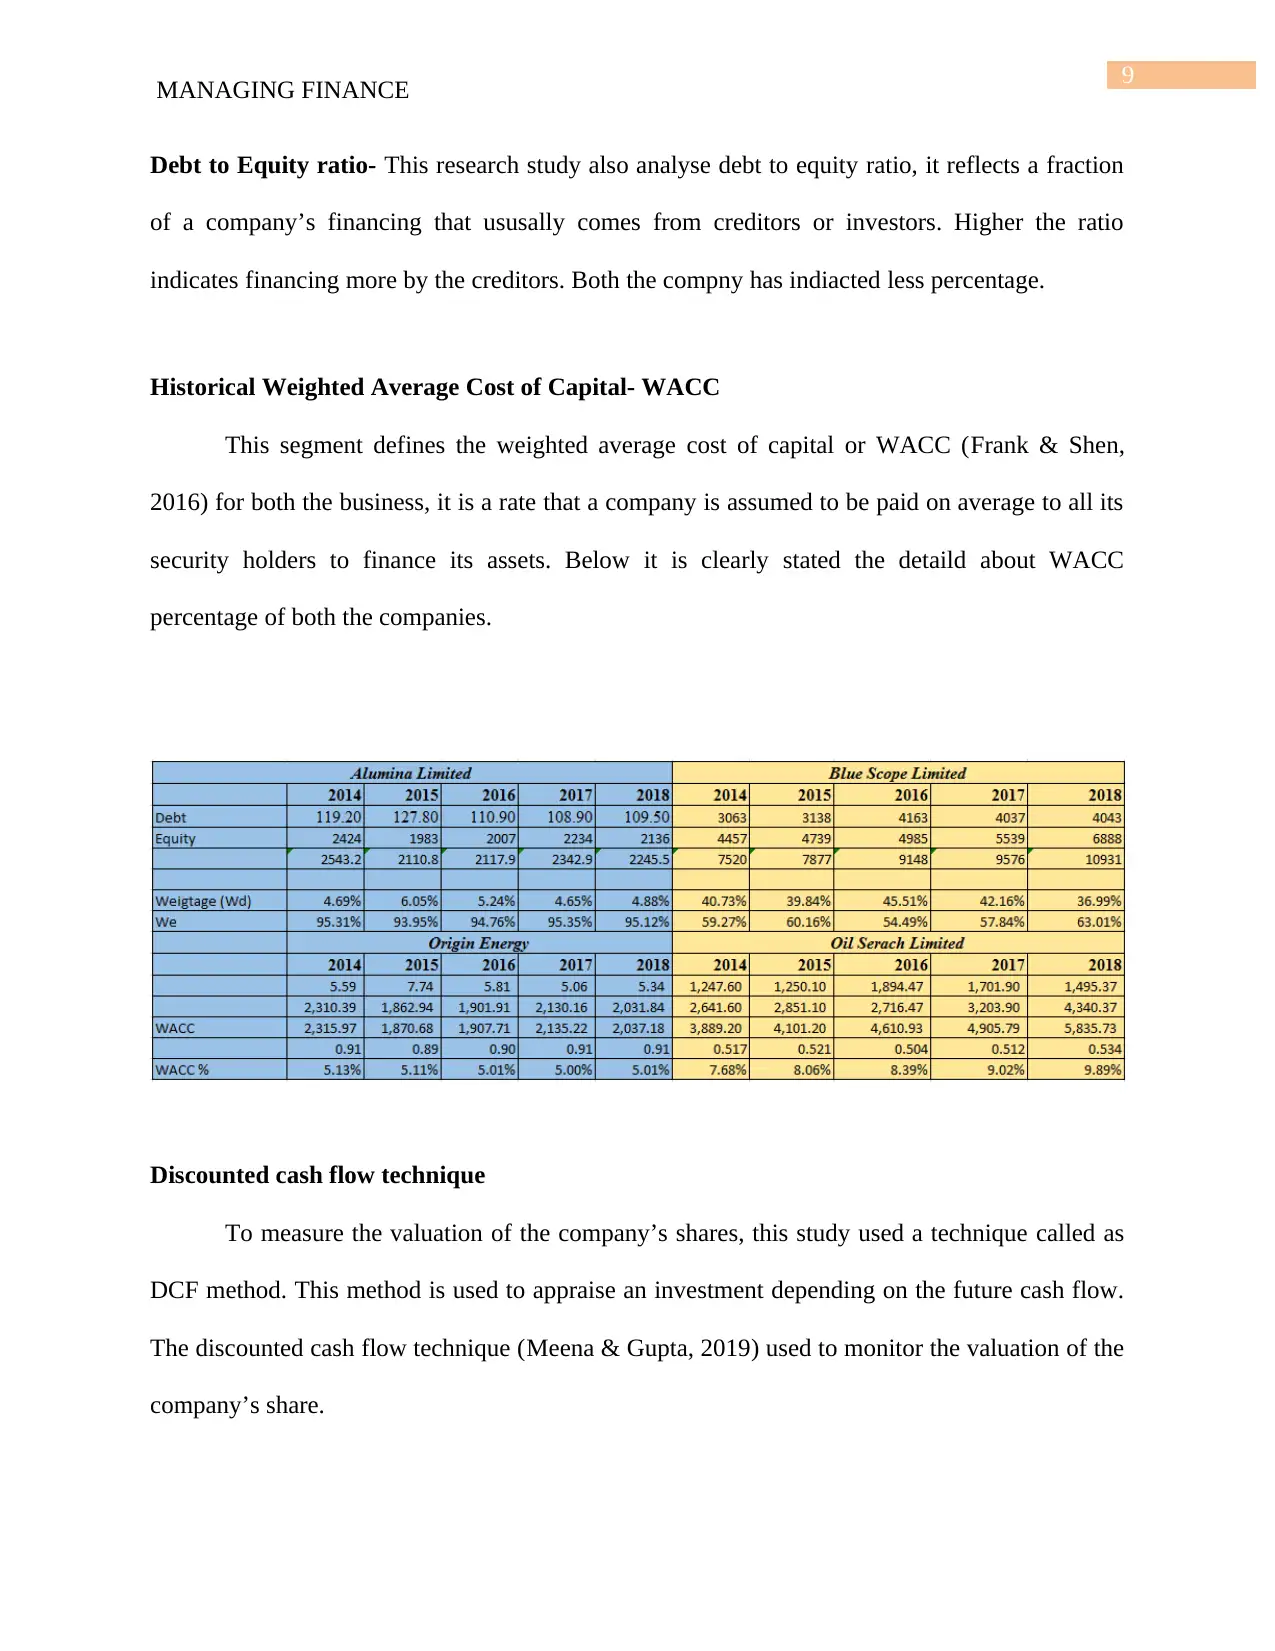
Historical Weighted Average Cost of Capital- WACC
This segment defines the weighted average cost of capital or WACC (Frank & Shen,
2016) for both the business, it is a rate that a company is assumed to be paid on average to all its
security holders to finance its assets. Below it is clearly stated the detaild about WACC
percentage of both the companies.
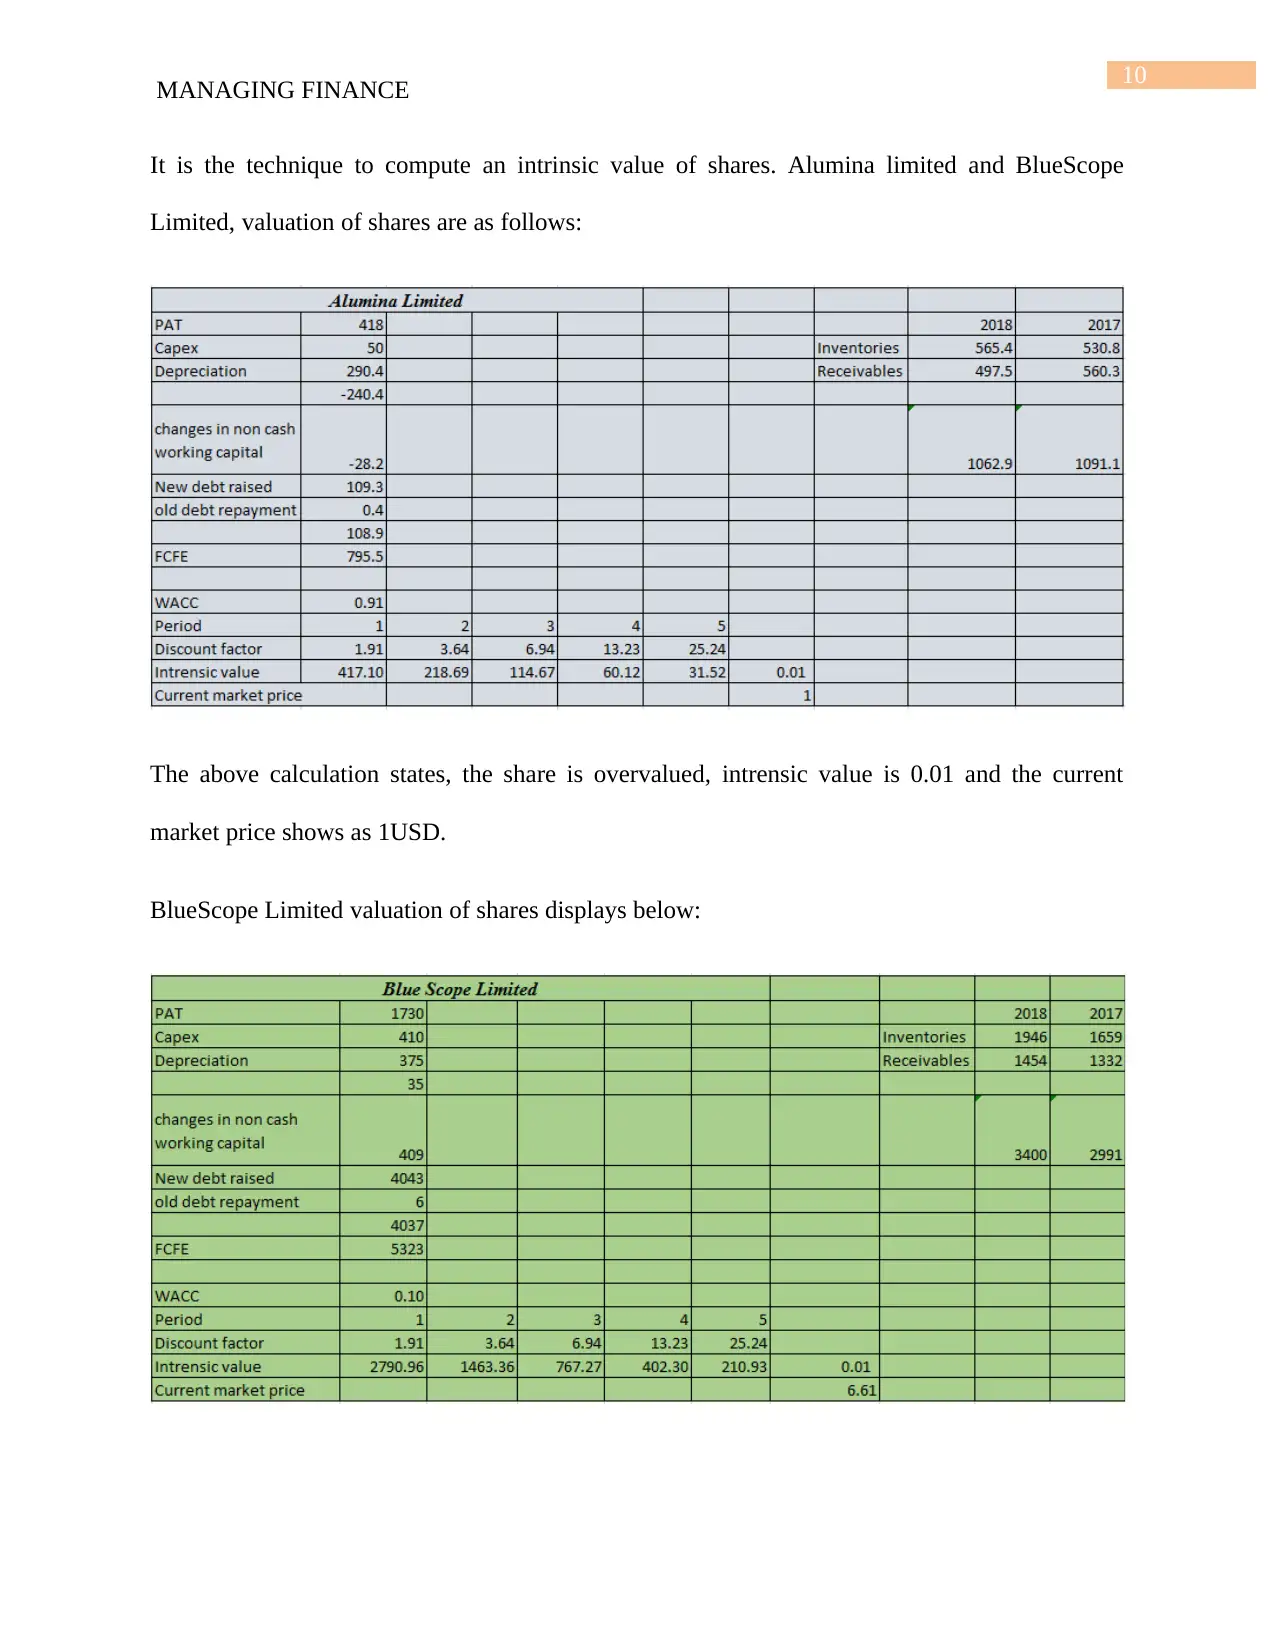
Discounted cash flow technique
To measure the valuation of the company’s shares, this study used a technique called as
DCF method. This method is used to appraise an investment depending on the future cash flow.
The discounted cash flow technique (Meena & Gupta, 2019) used to monitor the valuation of the
company’s share.
MANAGING FINANCE
Debt to Equity ratio- This research study also analyse debt to equity ratio, it reflects a fraction
of a company’s financing that ususally comes from creditors or investors. Higher the ratio
indicates financing more by the creditors. Both the compny has indiacted less percentage.
Historical Weighted Average Cost of Capital- WACC
This segment defines the weighted average cost of capital or WACC (Frank & Shen,
2016) for both the business, it is a rate that a company is assumed to be paid on average to all its
security holders to finance its assets. Below it is clearly stated the detaild about WACC
percentage of both the companies.
Discounted cash flow technique
To measure the valuation of the company’s shares, this study used a technique called as
DCF method. This method is used to appraise an investment depending on the future cash flow.
The discounted cash flow technique (Meena & Gupta, 2019) used to monitor the valuation of the
company’s share.
Paraphrase This Document
Need a fresh take? Get an instant paraphrase of this document with our AI Paraphraser
10
MANAGING FINANCE
It is the technique to compute an intrinsic value of shares. Alumina limited and BlueScope
Limited, valuation of shares are as follows:
The above calculation states, the share is overvalued, intrensic value is 0.01 and the current
market price shows as 1USD.
BlueScope Limited valuation of shares displays below:
11
MANAGING FINANCE
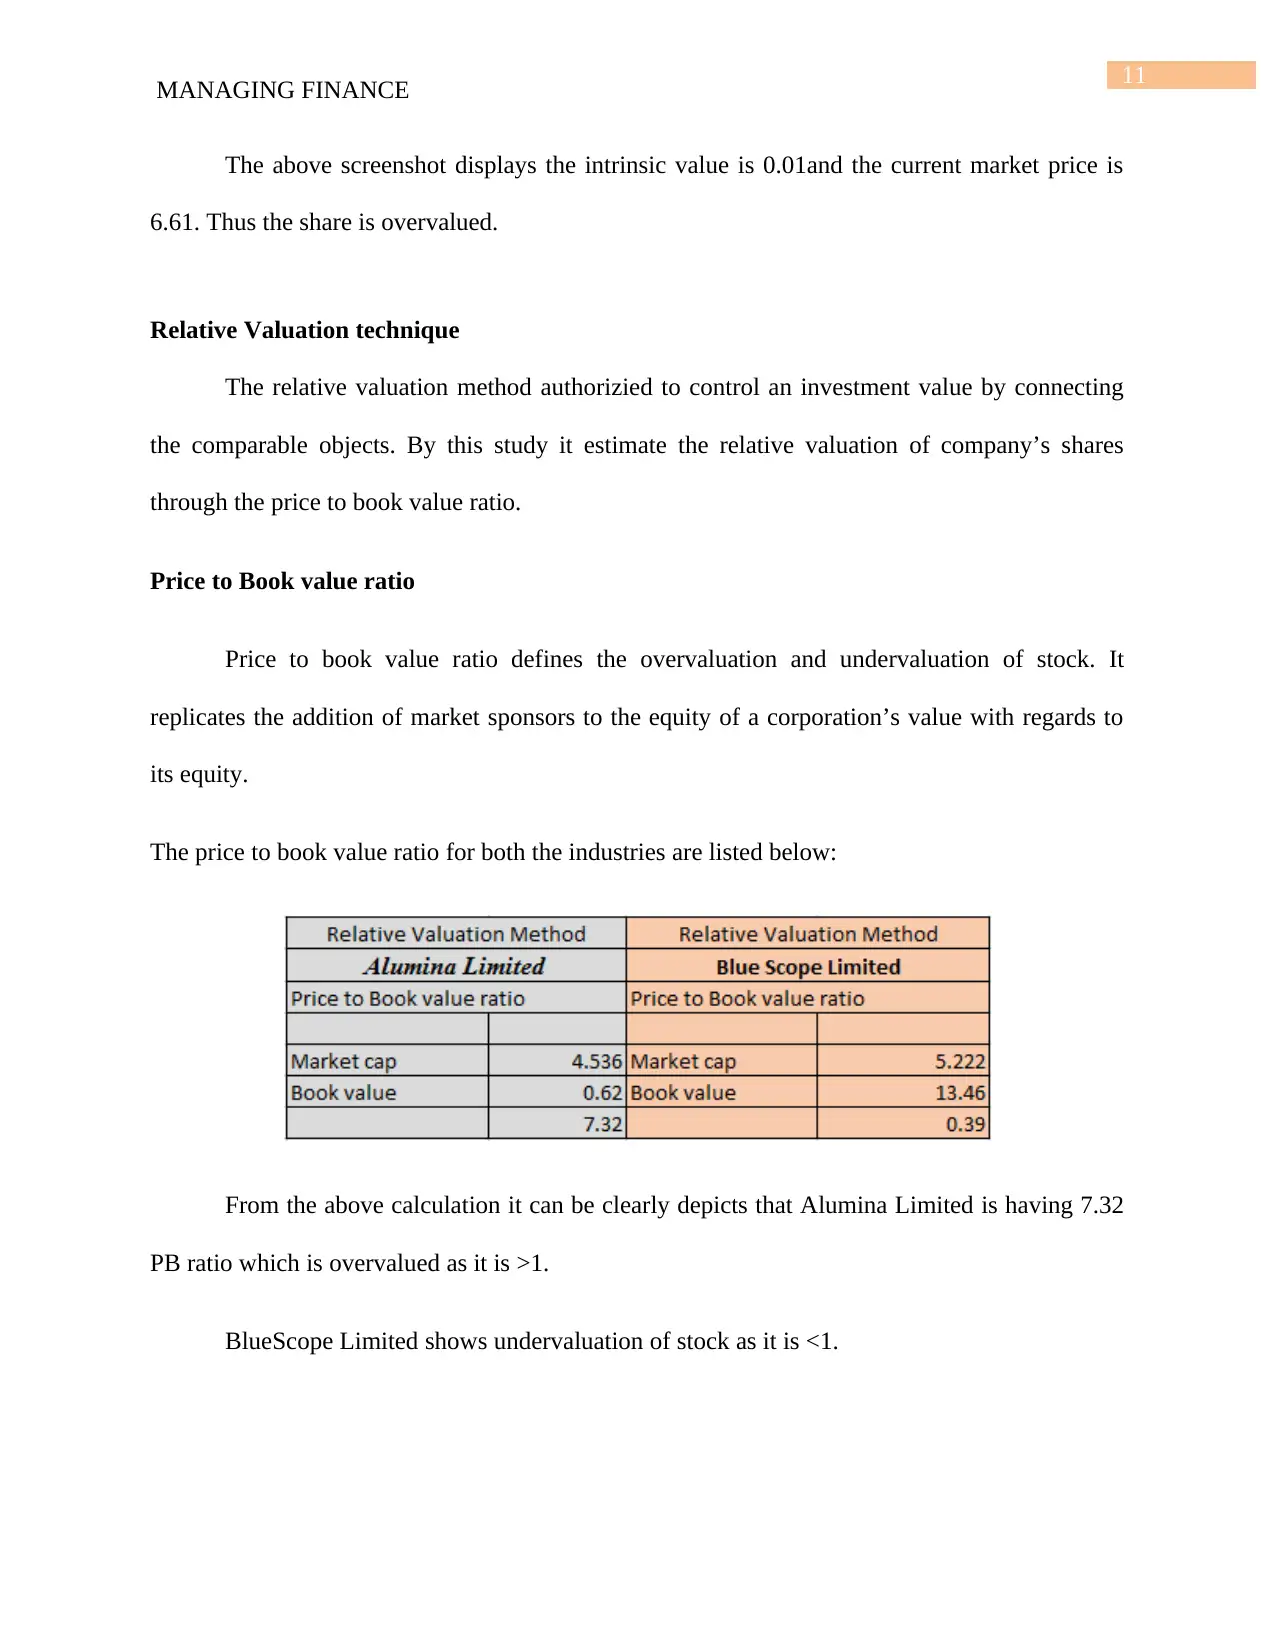
The above screenshot displays the intrinsic value is 0.01and the current market price is
6.61. Thus the share is overvalued.
Relative Valuation technique
The relative valuation method authorizied to control an investment value by connecting
the comparable objects. By this study it estimate the relative valuation of company’s shares
through the price to book value ratio.
Price to Book value ratio
Price to book value ratio defines the overvaluation and undervaluation of stock. It
replicates the addition of market sponsors to the equity of a corporation’s value with regards to
its equity.
The price to book value ratio for both the industries are listed below:
From the above calculation it can be clearly depicts that Alumina Limited is having 7.32
PB ratio which is overvalued as it is >1.
BlueScope Limited shows undervaluation of stock as it is <1.
MANAGING FINANCE
The above screenshot displays the intrinsic value is 0.01and the current market price is
6.61. Thus the share is overvalued.
Relative Valuation technique
The relative valuation method authorizied to control an investment value by connecting
the comparable objects. By this study it estimate the relative valuation of company’s shares
through the price to book value ratio.
Price to Book value ratio
Price to book value ratio defines the overvaluation and undervaluation of stock. It
replicates the addition of market sponsors to the equity of a corporation’s value with regards to
its equity.
The price to book value ratio for both the industries are listed below:
From the above calculation it can be clearly depicts that Alumina Limited is having 7.32
PB ratio which is overvalued as it is >1.
BlueScope Limited shows undervaluation of stock as it is <1.
⊘ This is a preview!⊘
Do you want full access?
Subscribe today to unlock all pages.
Trusted by 1+ million students worldwide
1 out of 16
Related Documents


Your All-in-One AI-Powered Toolkit for Academic Success.
+13062052269
info@desklib.com
Available 24*7 on WhatsApp / Email
![[object Object]](/_next/static/media/star-bottom.7253800d.svg)
Unlock your academic potential
Copyright © 2020–2026 A2Z Services. All Rights Reserved. Developed and managed by ZUCOL.