Comprehensive Financial Analysis and Comparison of Samsung and Apple
VerifiedAdded on 2021/01/02
|19
|4389
|324
Report
AI Summary
This report provides a comparative financial analysis of Samsung and Apple, utilizing ratio analysis (profitability, liquidity, solvency, and efficiency) and common size analysis to evaluate their performance from 2014 to 2017. The analysis includes interpretations of key financial ratios, such as gross profit margin, net profit margin, current ratio, quick ratio, and debt-equity ratio, offering insights into each company's financial strengths and weaknesses. The report also examines the horizontal and vertical analyses of both companies' income statements and balance sheets, highlighting trends in sales, profitability, and asset management. Furthermore, the report discusses the strengths and weaknesses of both companies, emphasizing their market positions, brand image, and financial strategies. The conclusion summarizes the key findings and provides an overall assessment of the financial health of Samsung and Apple, making it a valuable resource for understanding their financial performance and competitive landscape.
FAME
Paraphrase This Document
Need a fresh take? Get an instant paraphrase of this document with our AI Paraphraser
TABLE OF CONTENTS
INTRODUCTION...........................................................................................................................1
1. Ratio Analysis..........................................................................................................................1
Common size analysis..................................................................................................................6
Determining financial strength and weakness for Samsung and apple........................................8
CSR section of Samsung and Apple .........................................................................................10
CONCLUSION..............................................................................................................................12
REFERENCES..............................................................................................................................13
APPENDIX....................................................................................................................................14
INTRODUCTION
Financial analysis is very important for every business entity as it helps in measuring
performance of its business. The present report will give brief discussion about Samsung and
Apple on basis of ratio analysis and common size analysis. Further, this will reflect CSR policies
of both organization in efficient manner.
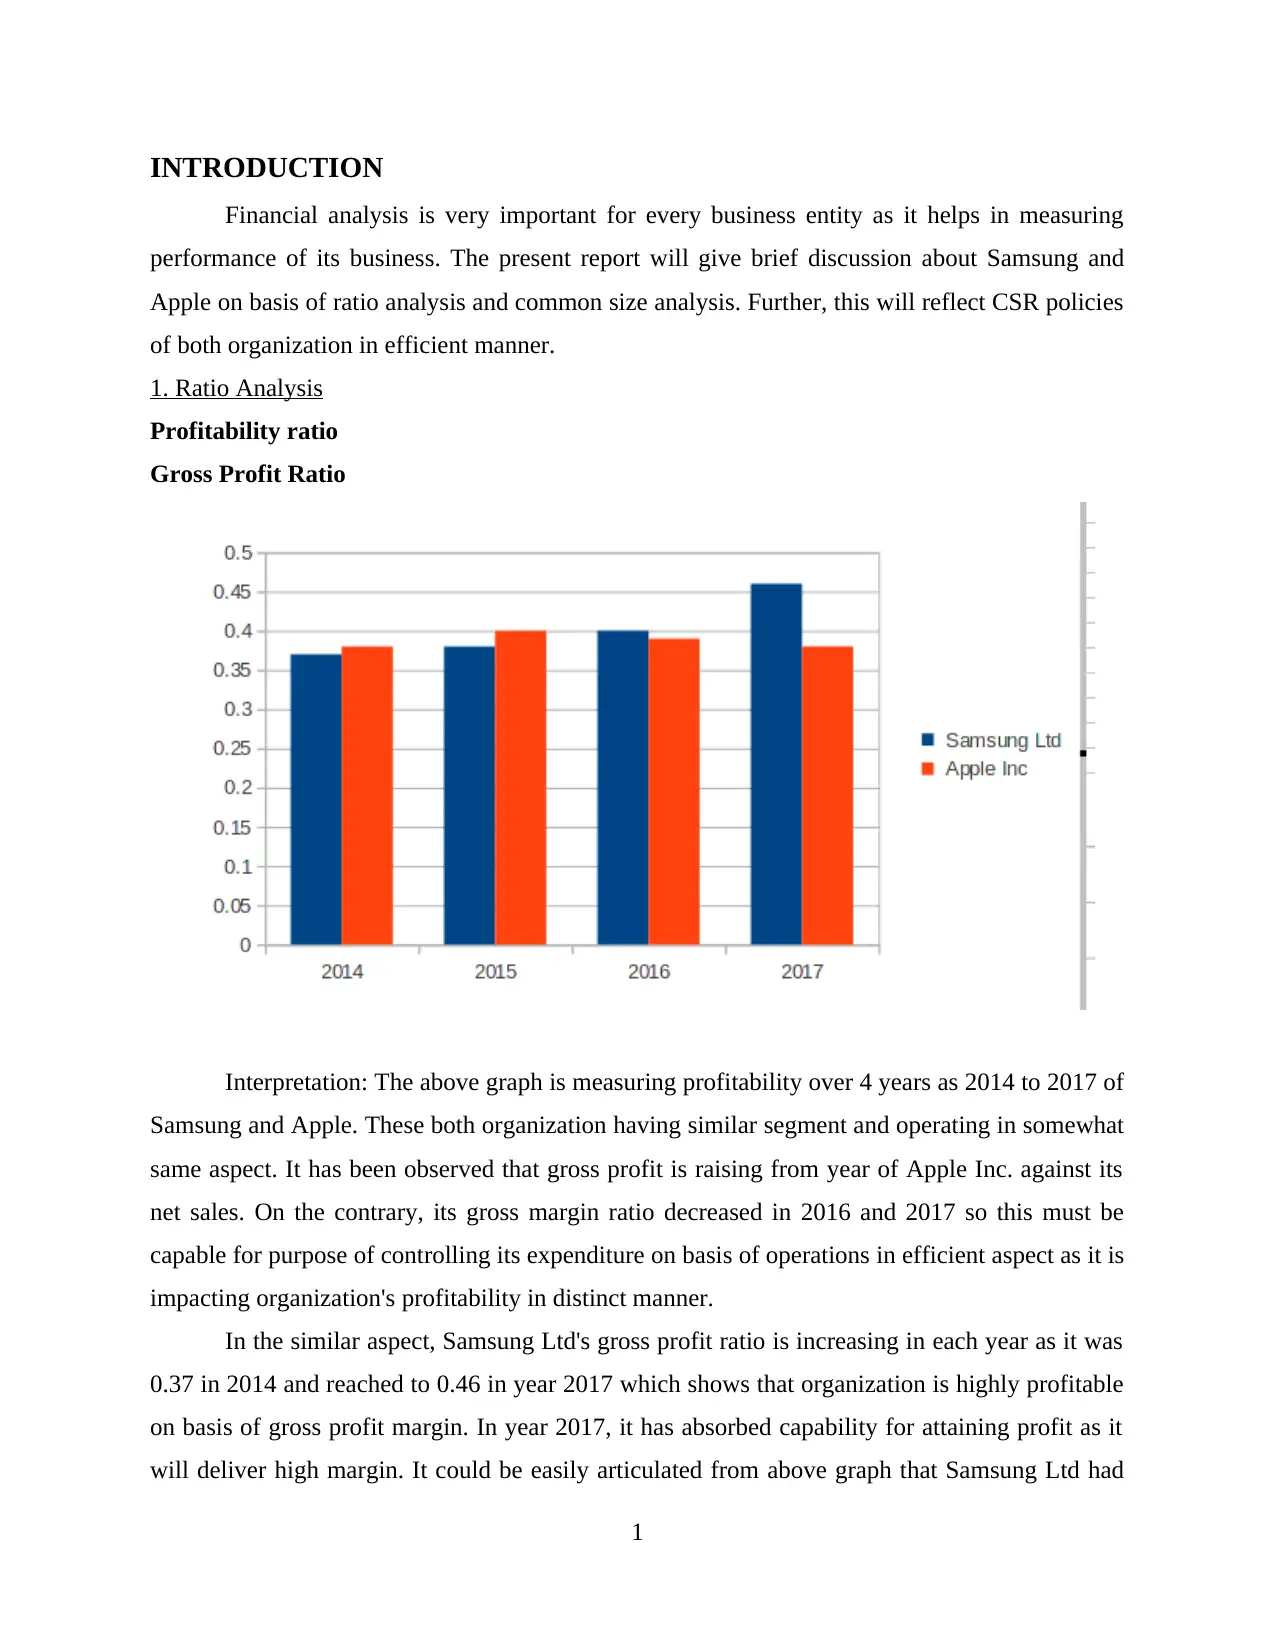
1. Ratio Analysis
Profitability ratio
Gross Profit Ratio
Interpretation: The above graph is measuring profitability over 4 years as 2014 to 2017 of
Samsung and Apple. These both organization having similar segment and operating in somewhat
same aspect. It has been observed that gross profit is raising from year of Apple Inc. against its
net sales. On the contrary, its gross margin ratio decreased in 2016 and 2017 so this must be
capable for purpose of controlling its expenditure on basis of operations in efficient aspect as it is
impacting organization's profitability in distinct manner.
In the similar aspect, Samsung Ltd's gross profit ratio is increasing in each year as it was
0.37 in 2014 and reached to 0.46 in year 2017 which shows that organization is highly profitable
on basis of gross profit margin. In year 2017, it has absorbed capability for attaining profit as it
will deliver high margin. It could be easily articulated from above graph that Samsung Ltd had
1
Financial analysis is very important for every business entity as it helps in measuring
performance of its business. The present report will give brief discussion about Samsung and
Apple on basis of ratio analysis and common size analysis. Further, this will reflect CSR policies
of both organization in efficient manner.
1. Ratio Analysis
Profitability ratio
Gross Profit Ratio
Interpretation: The above graph is measuring profitability over 4 years as 2014 to 2017 of
Samsung and Apple. These both organization having similar segment and operating in somewhat
same aspect. It has been observed that gross profit is raising from year of Apple Inc. against its
net sales. On the contrary, its gross margin ratio decreased in 2016 and 2017 so this must be
capable for purpose of controlling its expenditure on basis of operations in efficient aspect as it is
impacting organization's profitability in distinct manner.
In the similar aspect, Samsung Ltd's gross profit ratio is increasing in each year as it was
0.37 in 2014 and reached to 0.46 in year 2017 which shows that organization is highly profitable
on basis of gross profit margin. In year 2017, it has absorbed capability for attaining profit as it
will deliver high margin. It could be easily articulated from above graph that Samsung Ltd had
1
⊘ This is a preview!⊘
Do you want full access?
Subscribe today to unlock all pages.
Trusted by 1+ million students worldwide
directly attained development in its industry on basis of appropriate control along with cost of
expenditure as well. Henceforth, it will give provide fruitful outcome to business entity in terms
of profit.
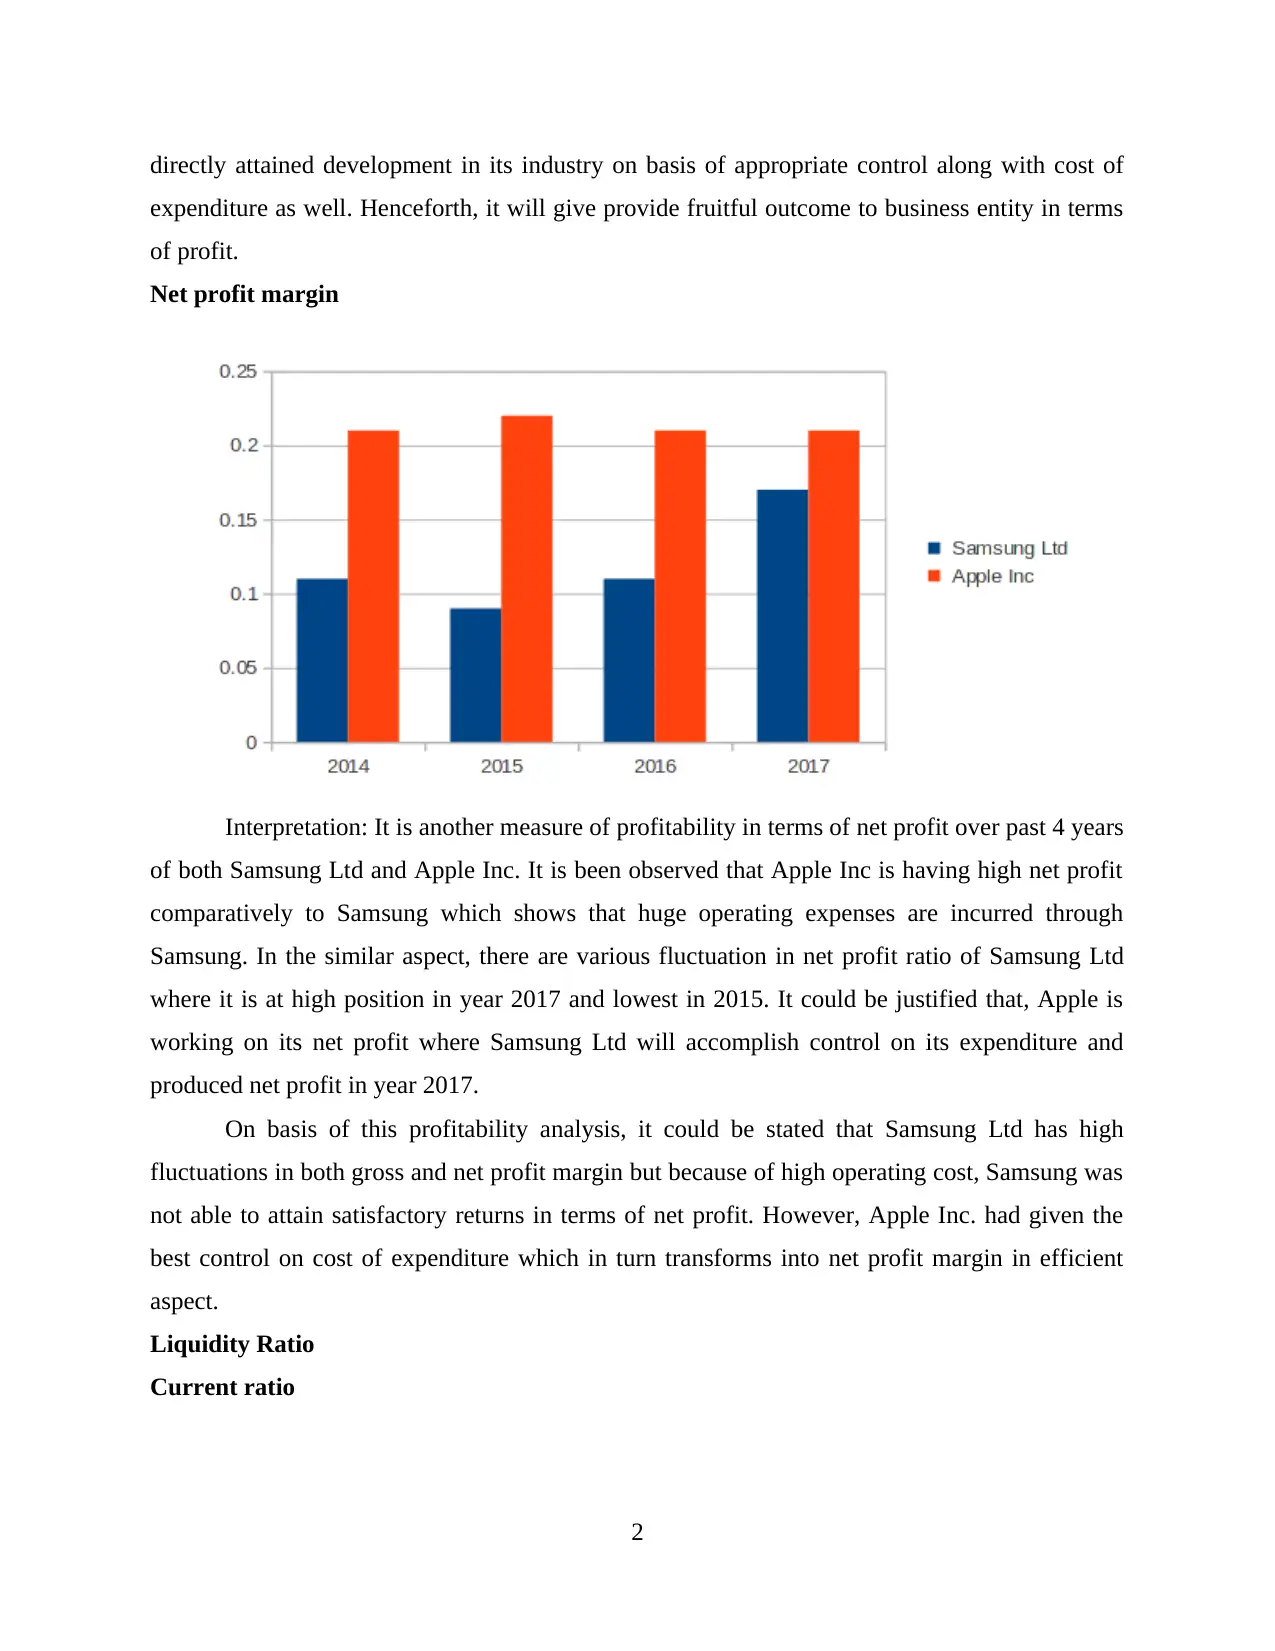
Net profit margin
Interpretation: It is another measure of profitability in terms of net profit over past 4 years
of both Samsung Ltd and Apple Inc. It is been observed that Apple Inc is having high net profit
comparatively to Samsung which shows that huge operating expenses are incurred through
Samsung. In the similar aspect, there are various fluctuation in net profit ratio of Samsung Ltd
where it is at high position in year 2017 and lowest in 2015. It could be justified that, Apple is
working on its net profit where Samsung Ltd will accomplish control on its expenditure and
produced net profit in year 2017.
On basis of this profitability analysis, it could be stated that Samsung Ltd has high
fluctuations in both gross and net profit margin but because of high operating cost, Samsung was
not able to attain satisfactory returns in terms of net profit. However, Apple Inc. had given the
best control on cost of expenditure which in turn transforms into net profit margin in efficient
aspect.
Liquidity Ratio
Current ratio
2
expenditure as well. Henceforth, it will give provide fruitful outcome to business entity in terms
of profit.
Net profit margin
Interpretation: It is another measure of profitability in terms of net profit over past 4 years
of both Samsung Ltd and Apple Inc. It is been observed that Apple Inc is having high net profit
comparatively to Samsung which shows that huge operating expenses are incurred through
Samsung. In the similar aspect, there are various fluctuation in net profit ratio of Samsung Ltd
where it is at high position in year 2017 and lowest in 2015. It could be justified that, Apple is
working on its net profit where Samsung Ltd will accomplish control on its expenditure and
produced net profit in year 2017.
On basis of this profitability analysis, it could be stated that Samsung Ltd has high
fluctuations in both gross and net profit margin but because of high operating cost, Samsung was
not able to attain satisfactory returns in terms of net profit. However, Apple Inc. had given the
best control on cost of expenditure which in turn transforms into net profit margin in efficient
aspect.
Liquidity Ratio
Current ratio
2
Paraphrase This Document
Need a fresh take? Get an instant paraphrase of this document with our AI Paraphraser
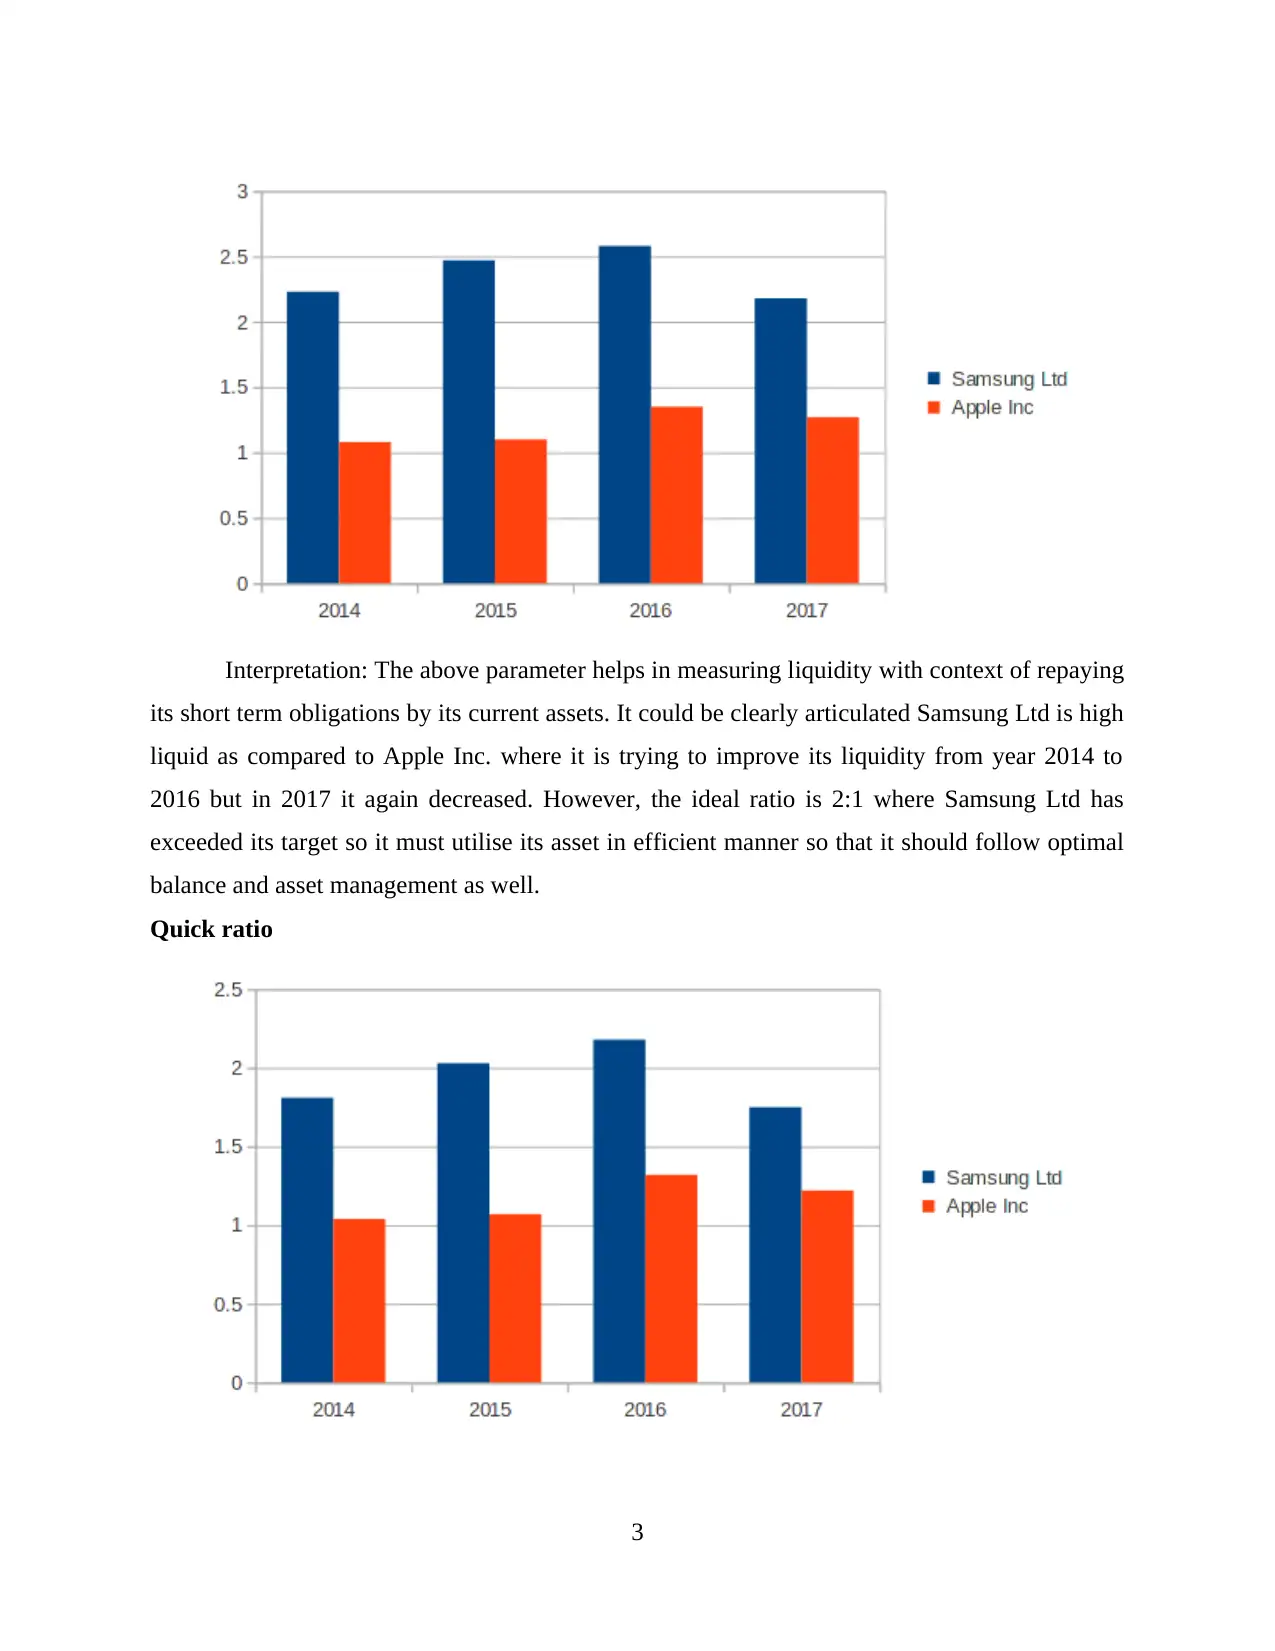
Interpretation: The above parameter helps in measuring liquidity with context of repaying
its short term obligations by its current assets. It could be clearly articulated Samsung Ltd is high
liquid as compared to Apple Inc. where it is trying to improve its liquidity from year 2014 to
2016 but in 2017 it again decreased. However, the ideal ratio is 2:1 where Samsung Ltd has
exceeded its target so it must utilise its asset in efficient manner so that it should follow optimal
balance and asset management as well.
Quick ratio
3
Interpretation: The above graph is measuring liquidity in terms of quick ratio of year
2014 to 2017 of Samsung Ltd and Apple Inc. The ideal ratio of this parameter is 1:1, so in this
aspect both companies are capable for meeting this standard. On basis of Apple Inc. it was
approx 1 in 2014 and 2015 and then it started raising in 2016. In the similar aspect, Samsung Ltd
has more quick assets for repaying its short term obligations in short duration but in 2017, it also
decreased although it did not break ideal target but from post year it decreased.
Thus, it could be evaluated that both organization are performing in efficient aspect for
its liquidity. Comparatively, Samsung Ltd is having appropriate position and superior in this
parameter of liquidity.
Solvency Ratio
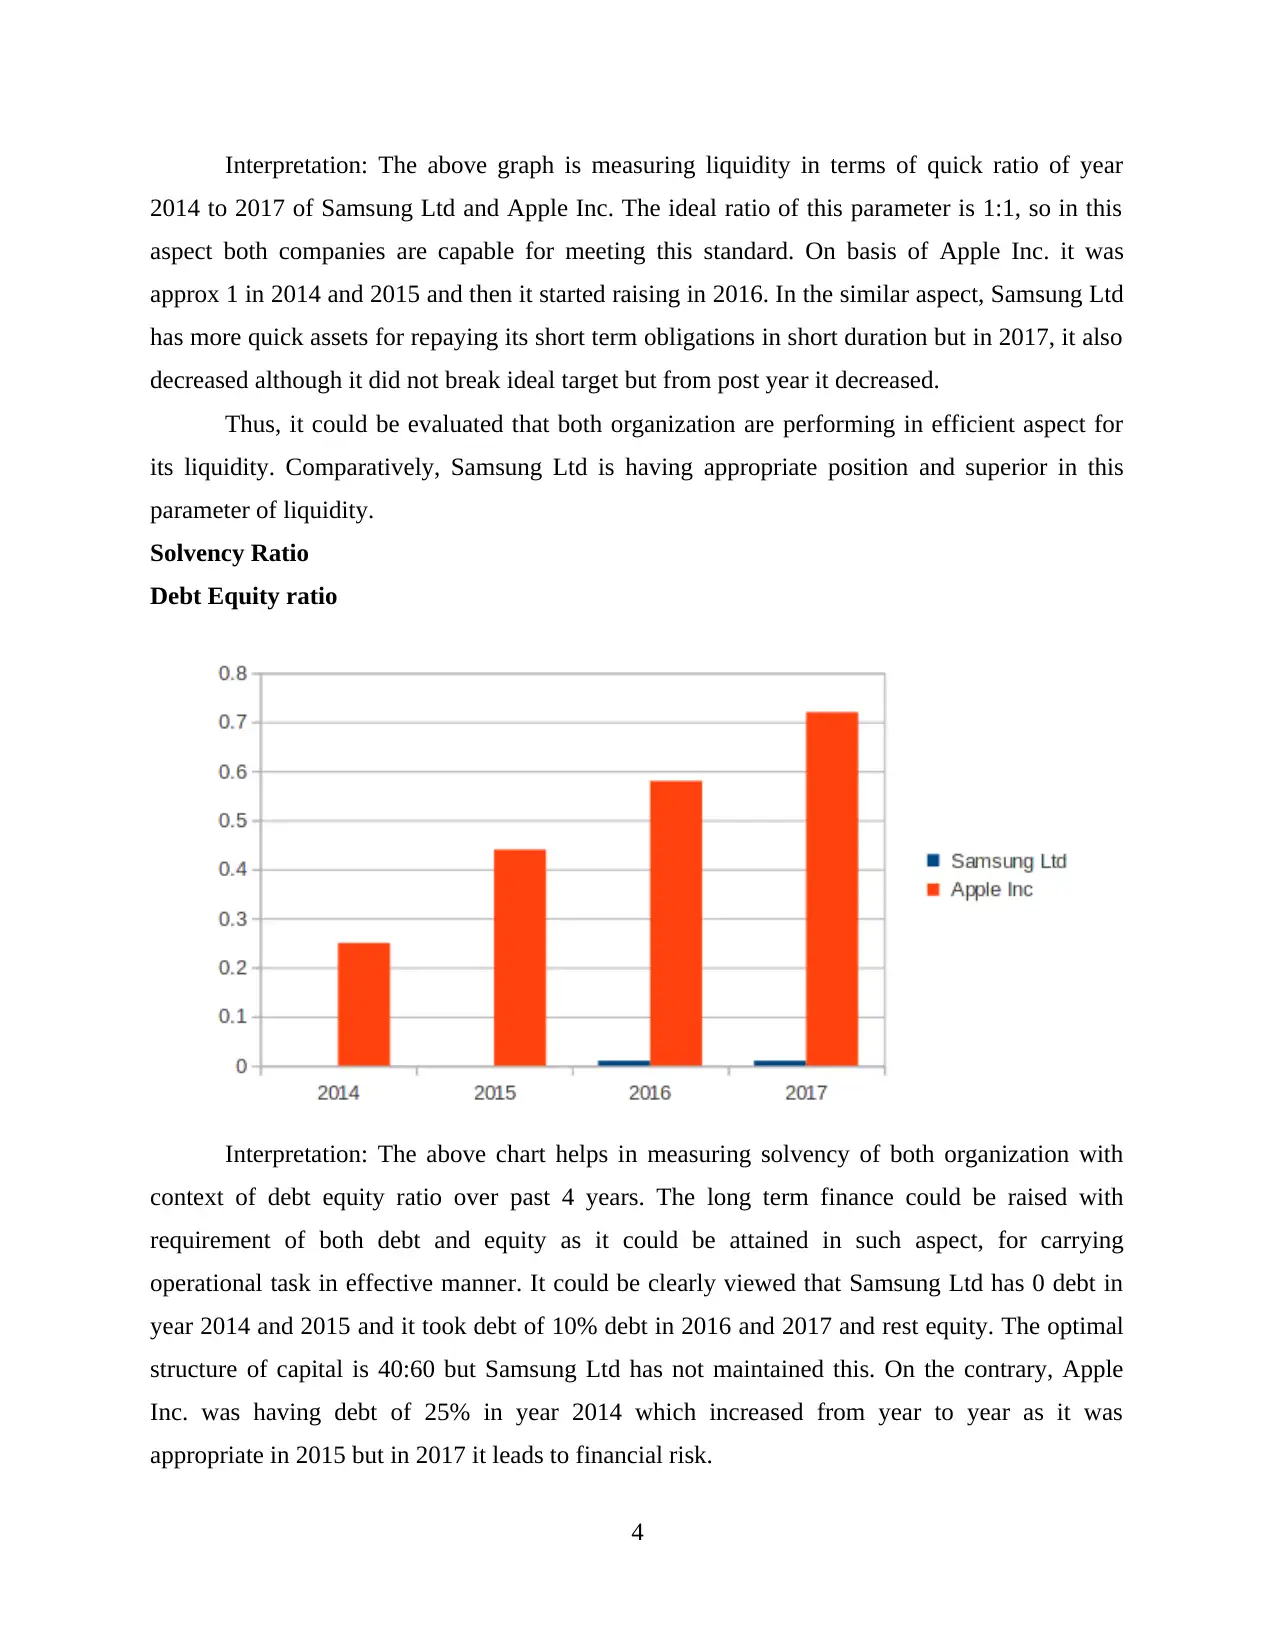
Debt Equity ratio
Interpretation: The above chart helps in measuring solvency of both organization with
context of debt equity ratio over past 4 years. The long term finance could be raised with
requirement of both debt and equity as it could be attained in such aspect, for carrying
operational task in effective manner. It could be clearly viewed that Samsung Ltd has 0 debt in
year 2014 and 2015 and it took debt of 10% debt in 2016 and 2017 and rest equity. The optimal
structure of capital is 40:60 but Samsung Ltd has not maintained this. On the contrary, Apple
Inc. was having debt of 25% in year 2014 which increased from year to year as it was
appropriate in 2015 but in 2017 it leads to financial risk.
4
2014 to 2017 of Samsung Ltd and Apple Inc. The ideal ratio of this parameter is 1:1, so in this
aspect both companies are capable for meeting this standard. On basis of Apple Inc. it was
approx 1 in 2014 and 2015 and then it started raising in 2016. In the similar aspect, Samsung Ltd
has more quick assets for repaying its short term obligations in short duration but in 2017, it also
decreased although it did not break ideal target but from post year it decreased.
Thus, it could be evaluated that both organization are performing in efficient aspect for
its liquidity. Comparatively, Samsung Ltd is having appropriate position and superior in this
parameter of liquidity.
Solvency Ratio
Debt Equity ratio
Interpretation: The above chart helps in measuring solvency of both organization with
context of debt equity ratio over past 4 years. The long term finance could be raised with
requirement of both debt and equity as it could be attained in such aspect, for carrying
operational task in effective manner. It could be clearly viewed that Samsung Ltd has 0 debt in
year 2014 and 2015 and it took debt of 10% debt in 2016 and 2017 and rest equity. The optimal
structure of capital is 40:60 but Samsung Ltd has not maintained this. On the contrary, Apple
Inc. was having debt of 25% in year 2014 which increased from year to year as it was
appropriate in 2015 but in 2017 it leads to financial risk.
4
⊘ This is a preview!⊘
Do you want full access?
Subscribe today to unlock all pages.
Trusted by 1+ million students worldwide
Efficiency Ratios
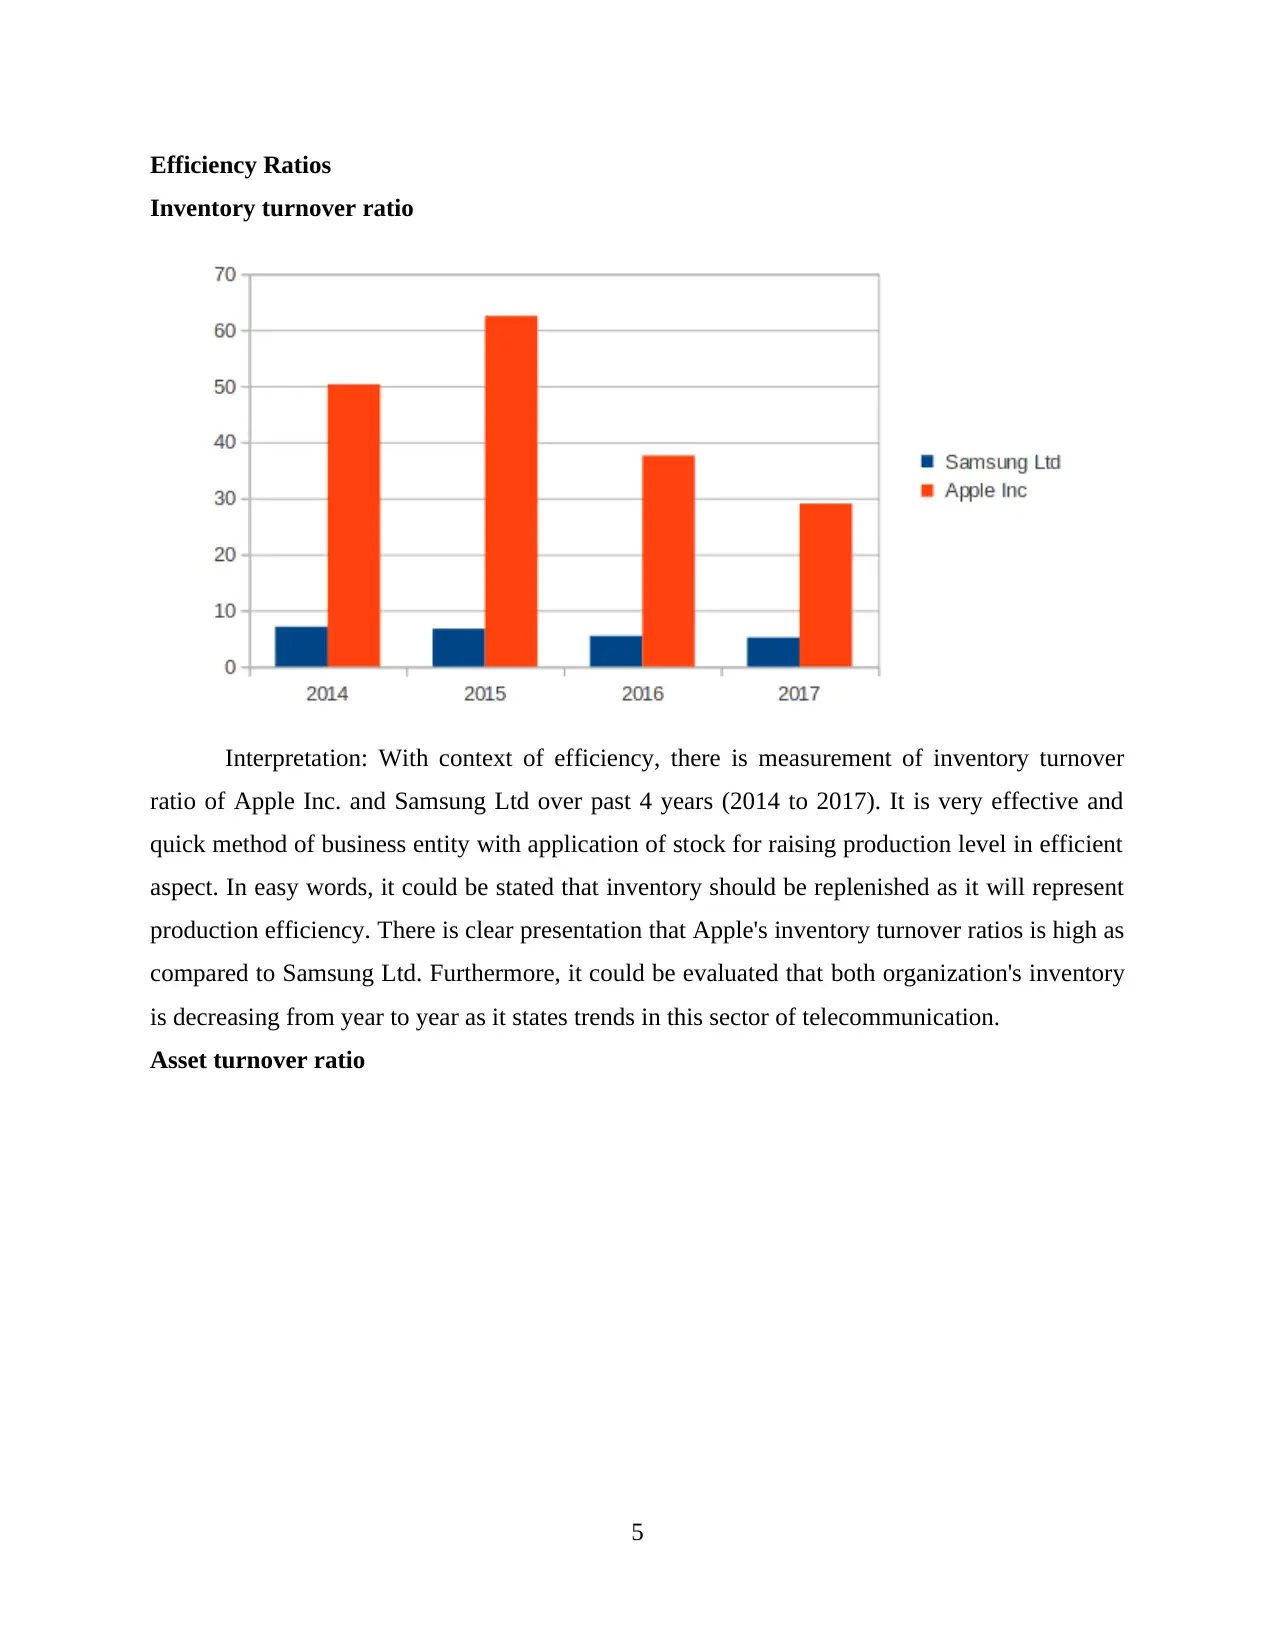
Inventory turnover ratio
Interpretation: With context of efficiency, there is measurement of inventory turnover
ratio of Apple Inc. and Samsung Ltd over past 4 years (2014 to 2017). It is very effective and
quick method of business entity with application of stock for raising production level in efficient
aspect. In easy words, it could be stated that inventory should be replenished as it will represent
production efficiency. There is clear presentation that Apple's inventory turnover ratios is high as
compared to Samsung Ltd. Furthermore, it could be evaluated that both organization's inventory
is decreasing from year to year as it states trends in this sector of telecommunication.
Asset turnover ratio
5
Paraphrase This Document
Need a fresh take? Get an instant paraphrase of this document with our AI Paraphraser
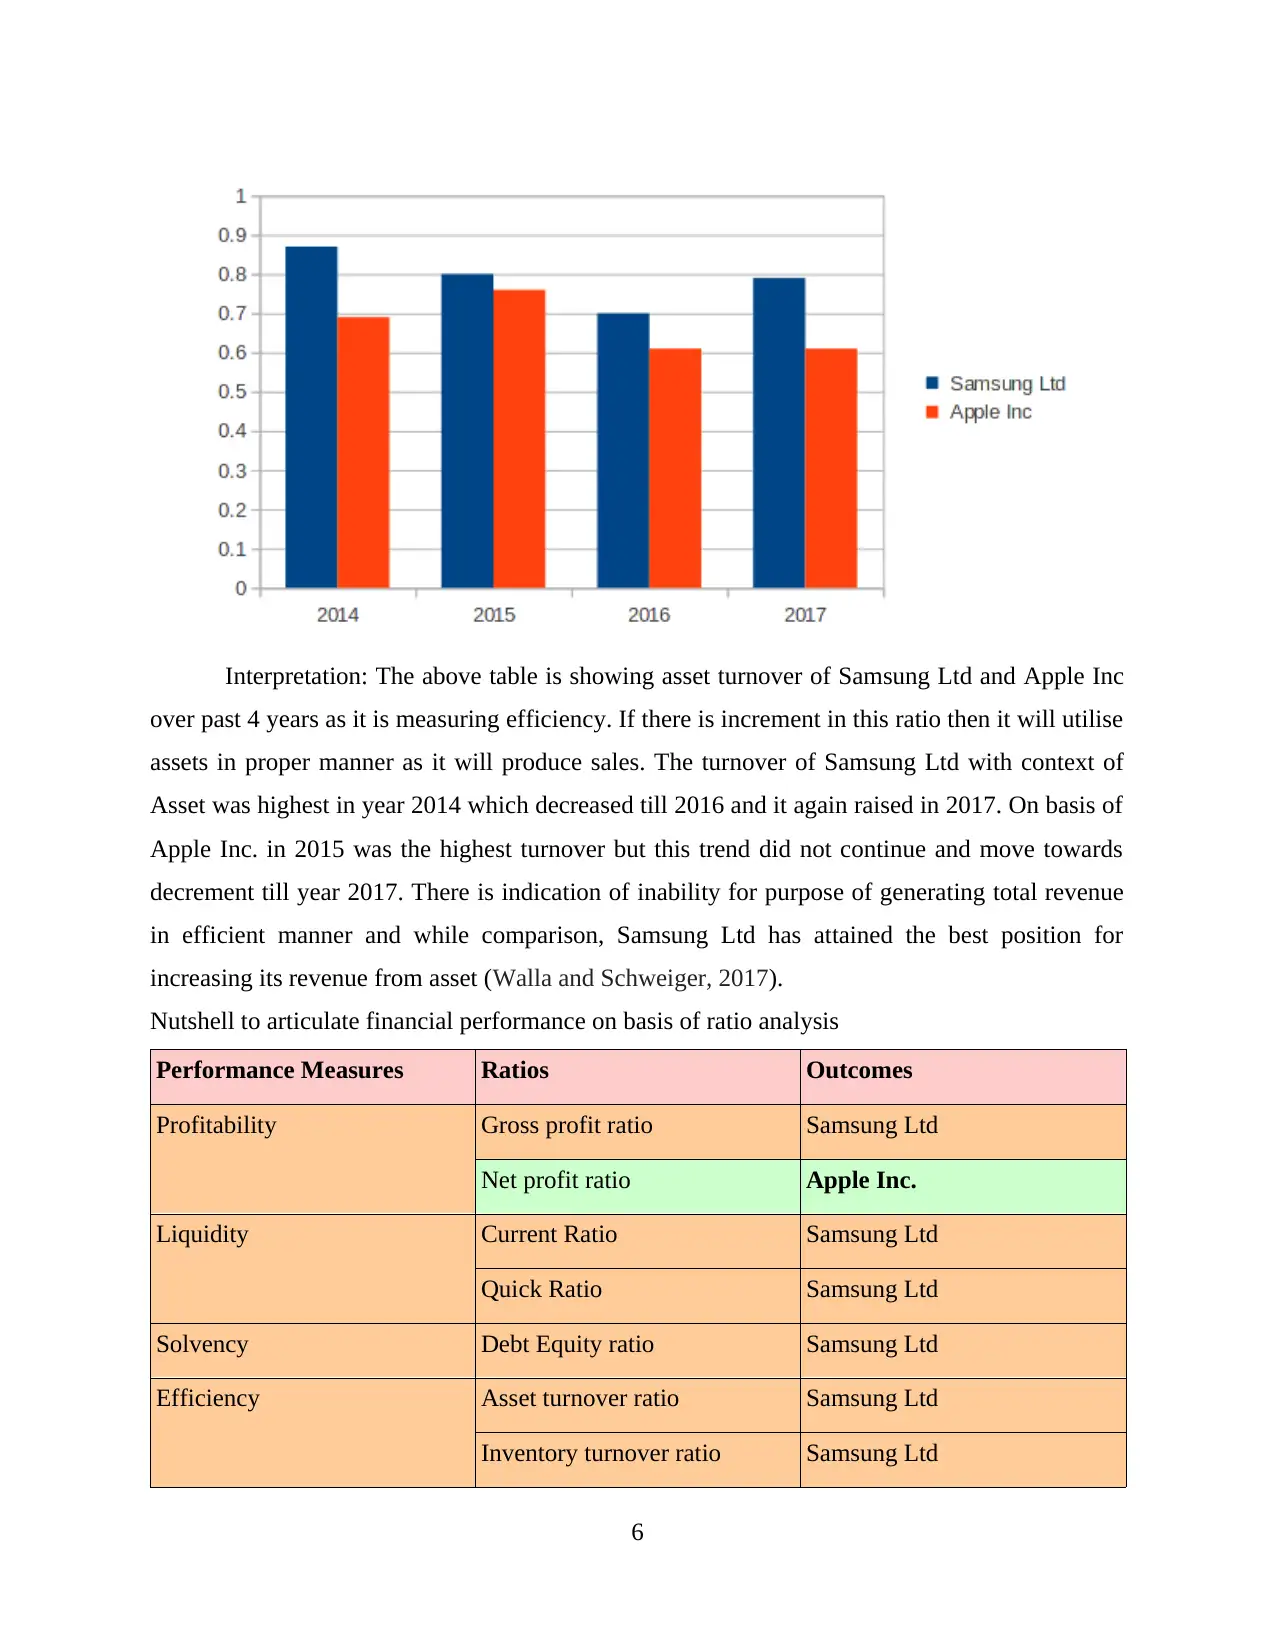
Interpretation: The above table is showing asset turnover of Samsung Ltd and Apple Inc
over past 4 years as it is measuring efficiency. If there is increment in this ratio then it will utilise
assets in proper manner as it will produce sales. The turnover of Samsung Ltd with context of
Asset was highest in year 2014 which decreased till 2016 and it again raised in 2017. On basis of
Apple Inc. in 2015 was the highest turnover but this trend did not continue and move towards
decrement till year 2017. There is indication of inability for purpose of generating total revenue
in efficient manner and while comparison, Samsung Ltd has attained the best position for
increasing its revenue from asset (Walla and Schweiger, 2017).
Nutshell to articulate financial performance on basis of ratio analysis
Performance Measures Ratios Outcomes
Profitability Gross profit ratio Samsung Ltd
Net profit ratio Apple Inc.
Liquidity Current Ratio Samsung Ltd
Quick Ratio Samsung Ltd
Solvency Debt Equity ratio Samsung Ltd
Efficiency Asset turnover ratio Samsung Ltd
Inventory turnover ratio Samsung Ltd
6
Common size analysis
Horizontal analysis of Samsung Ltd
Its total assets in 2014 were approx 50% which raised from year to year but in 2017 it
decreased to 48.71%.
In context of current liabilities, were contributing minimum percentage which is approx
20% in 2014 to 2016 and in 2017 it was 0%.
It has huge equity which is increasing from year to year but in 2017 it was 71% as lowest
one.
Horizontal analysis of Income statement Samsung Ltd
The sales were decreasing from year to year but in 2017 it rose by 21.70% and this trend
continued with context of gross profit as well.
It has been observed that operating income was increasing in each year by huge
proportion as in 2017 it was about 88.12% which is the highest proportion among 4
years.
Henceforth, it could be evaluated that, all these factors are impacting net profit which is
decreasing in 2015 but in 2016 and 2017, it rose by 16.30% and 90.35% respectively.
Vertical Analysis of Apple Inc. income statement
The gross profit is contributing 38.47% of it total sales which is increasing from year to
year as it was approx 39% in 2017.
In context of operating profit is also contributing 26.76% of sales as it raised by 30.48%
and 28.72% in 2016 and 2017 respectively.
On basis of net income, the contribution to sales is stable over these past 4 years.
Vertical Analysis of Apple Inc. Balance sheet
The total current assets are 29.56% of its total assets in 2014 which raised to 34.28% in
2017.
The current liability was 27.31% in 2014 as in 2015 it raised to 35.72%.
On basis of equity, it was 41.09% in 2014 and decreased to 35.72% in year 2017.
Horizontal Analysis of Apple Inc. Income statement
On basis of sales, it raised by 27.86% and decreased to 7.73% in 2016 and raised to
6.30% in 2017.
7
⊘ This is a preview!⊘
Do you want full access?
Subscribe today to unlock all pages.
Trusted by 1+ million students worldwide
This trend continued with context of gross, operating and net profit as well.
Horizontal Analysis of Apple Inc. Balance sheet
The total current assets were higher in 2015 which had various fluctuation as in 2017 it
was about 20.38%.
The total assets' percentage change was increasing from year to year till 2017.
In the similar aspect, its total liabilities and equities were also raising which is not good
indicator (Cooke, 2017).
Determining financial strength and weakness for Samsung and apple
Strength and Weakness are the internal factors which have their influence on the working
of the organization. Strength of the organization helps the firm in increasing their profitability
and growth of organization whereas Weakness reduce its profitability and reduce its growth rate.
Strength of Samsung : These are the internal factors which affect the organization
positively. Strength of Samsung helps in increasing its profitability and provide assistance in
increasing organization performance in the market. Strength of Samsung includes its high brand
image, It has global leadership across all mobile and smart phones markets it includes 217
operation hubs operating globally. It has strong financial position which act as strength for
organization. It is the leading brand with 21.4 % of the worlds the largest market share. It has
strong manufacturing and marketing capabilities.
Weakness of Samsung : Weakness are the factors which affect the operation or
organization which hampers the working environment and profitability of the firm. Weakness of
Samsung include Weak position in PC market as HP, Lenovo , dell and Apple are the leading
brands in providing PC and Samsung market share for PC is much lower than these brands. It
also has a weakness as it highly depends on American market. It has extensive product portfolio
which act as weakness for Samsung. It has absence of its own OS and software which is a
weakness for Samsung.
Strength of Apple : Strength of the Apple include its high brand image which helps in
increasing its profitability effectively and efficiently. Apple is involved in creation of innovative
ideas which helps in increasing its customer base and its gaining market in different countries
due to its high demands in counties(SWOT analysis of Samsung, 2015). Apple has high
marketing capabilities and it also has high profit margins on the products manufactured by
Apple(Apple Inc. SWOT Analysis & Recommendations, 2018). It also has large customer base in
8
Paraphrase This Document
Need a fresh take? Get an instant paraphrase of this document with our AI Paraphraser
all over the regions which helps in achieving its objectives effectively and efficiently. Apple is
having highly skilled workforce which assist in performing its various functions easily and also
helps in improving its performance in the market. Apple offers wide range of products to its
customers which act as strength for organization as it will increase its customers.
Weakness of Apple : Weakness of the organization affect its internal functions and also
have its impact on the functioning of various operation of business. Apple is offering high prices
for its product due to which many people are not able to afford its price that have its impact on
its customers base which is facing reduction due to its high prices of its product. Apple is
overdependent on the sale of iPhone due to which other products are not given priority and only I
phone are given more importance(Kane, Dikeç and Park, 2017). Apple also have weakness due
to incompatibility of its products with other products and services for users. Apple also have
narrow product range which affect is profitability margin and customers base.
On the basis of Above findings about the strength and weakness of Samsung and
weakness it can be identified that Samsung is having higher market share than Apple as later
contains 13.9% and former contains 21.4 % market share. Also, some consumer views that
Apple phones are more advanced than Samsung. Apple provides high quality products than
Samsung. Moreover, Samsung device uses google Android Open source operating system and
Apple use iOS which is more advances and thus Apple is more preferable than the Samsung.
CSR section of Samsung and Apple
CSR section of Samsung
Corporate social responsibility refers to developing social responsibility for -providing
benefit to the society. CSR policy is adopted by organization in order to increase brand
recognition, increase goodwill, sales and profitability(Foscht, Lin and Eisingerich, 2018.).
Corporate social responsibility programs are facilitated by Samsung through Sustainable
management council. It consists of various departments which manage the issues relating to
society and environment.
Global code of Conduct for Samsung is based on principles that includes :
Samsung is complying with laws and Ethical standards to operate its business smoothly is
different countries.
It is involved in maintaining clean Organizational structure to fulfill its Corporate social
responsibility.
9
Samsung respects its customers , shareholders and employees to maintain healthy relation
with the customers.
It has also formulated various policies for the environmental awareness , health and
safety.
It acts as Socially responsible corporate citizen.
Corporate social responsibility matters are managed by the Samsung CSR committee. It also
releases supplier responsibility progress report in which it contains the details of CSR activities
in which organization is involved. Samsung is involved in CSR activities such as Social
contribution, green management, health and safety and sharing growth.
Samsung Core focus areas are :
Education : Samsung created Smart class which provide support to education with the
use of Samsung technology. With the help of smart class Samsung is increasing scope of
learning. With the help of Samsung smart class students are able to learn their concept
easily from their place(Mach, Atlason and Gerstlberger, 2016.). It provides smart
education environment with the help of this technology innovation is increased and
society is benefited by this technology.
Employment : Samsung in order to reduce the issues of employment which is increasing
in society and also there is a shortage of skilled labor in industry . There are different
causes of unemployment which includes Societal inequalities, Inadequate education
infrastructure etc. Samsung with the use of Its technical schools provide assistance to the
youth in designing their future by providing them systematic vocational education and
local employment.
Health and medical care : health issues and accidental issues are increasing day by day
and to reduce this Samsung is providing smart health care through its aim at enhancing
hospital care through its medical equipment and technology(Lau, Lee and Jung, 2018).
Samsung installation of automated biochemistry and immunology equipment will assist
in emergencies.
CSR section of apple :
There are various programs undertaken by apple as part of its corporate social
responsibility. It includes promoting education including special education and employment
10
⊘ This is a preview!⊘
Do you want full access?
Subscribe today to unlock all pages.
Trusted by 1+ million students worldwide
1 out of 19
Related Documents


Your All-in-One AI-Powered Toolkit for Academic Success.
+13062052269
info@desklib.com
Available 24*7 on WhatsApp / Email
![[object Object]](/_next/static/media/star-bottom.7253800d.svg)
Unlock your academic potential
Copyright © 2020–2026 A2Z Services. All Rights Reserved. Developed and managed by ZUCOL.