Strategic and Comparative HRM Report: Population Demographics Analysis

Verified

Added on  2022/11/11

|8
|1142
|297
Report
AI Summary
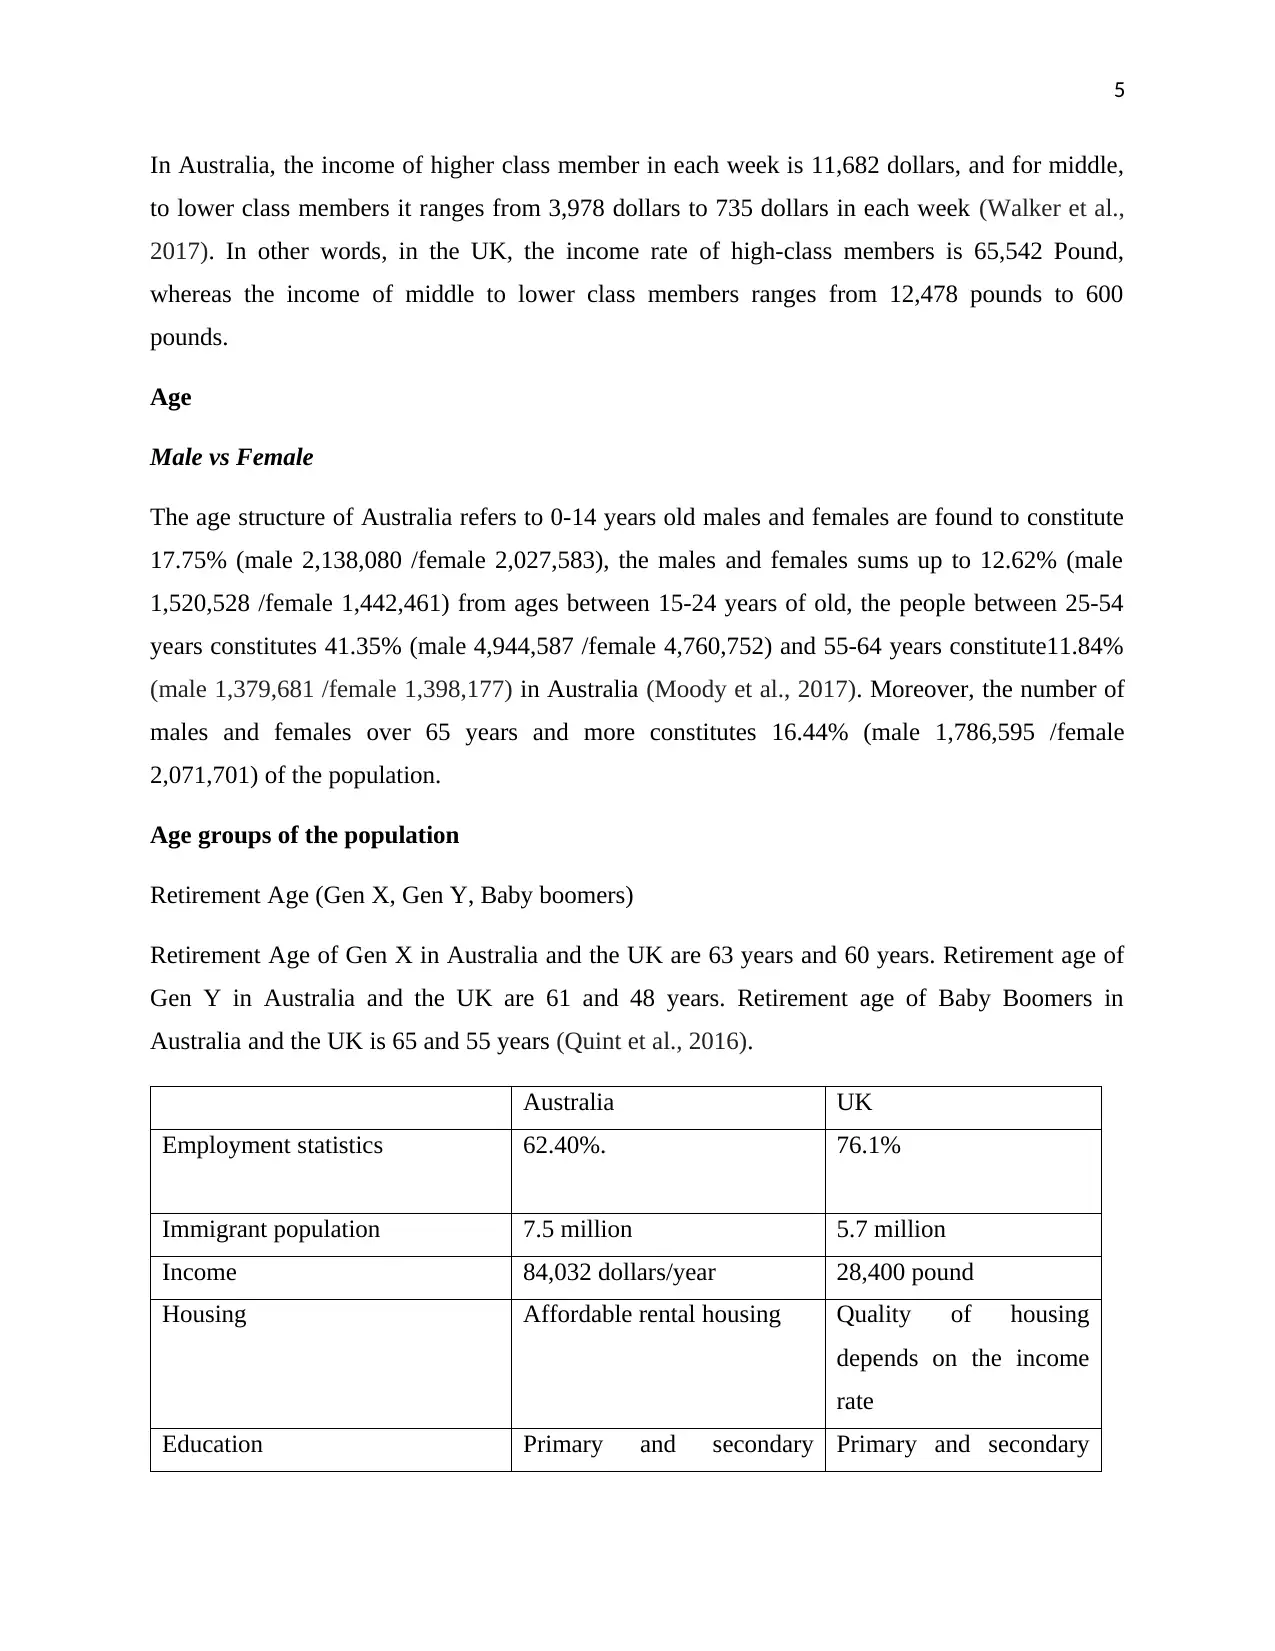
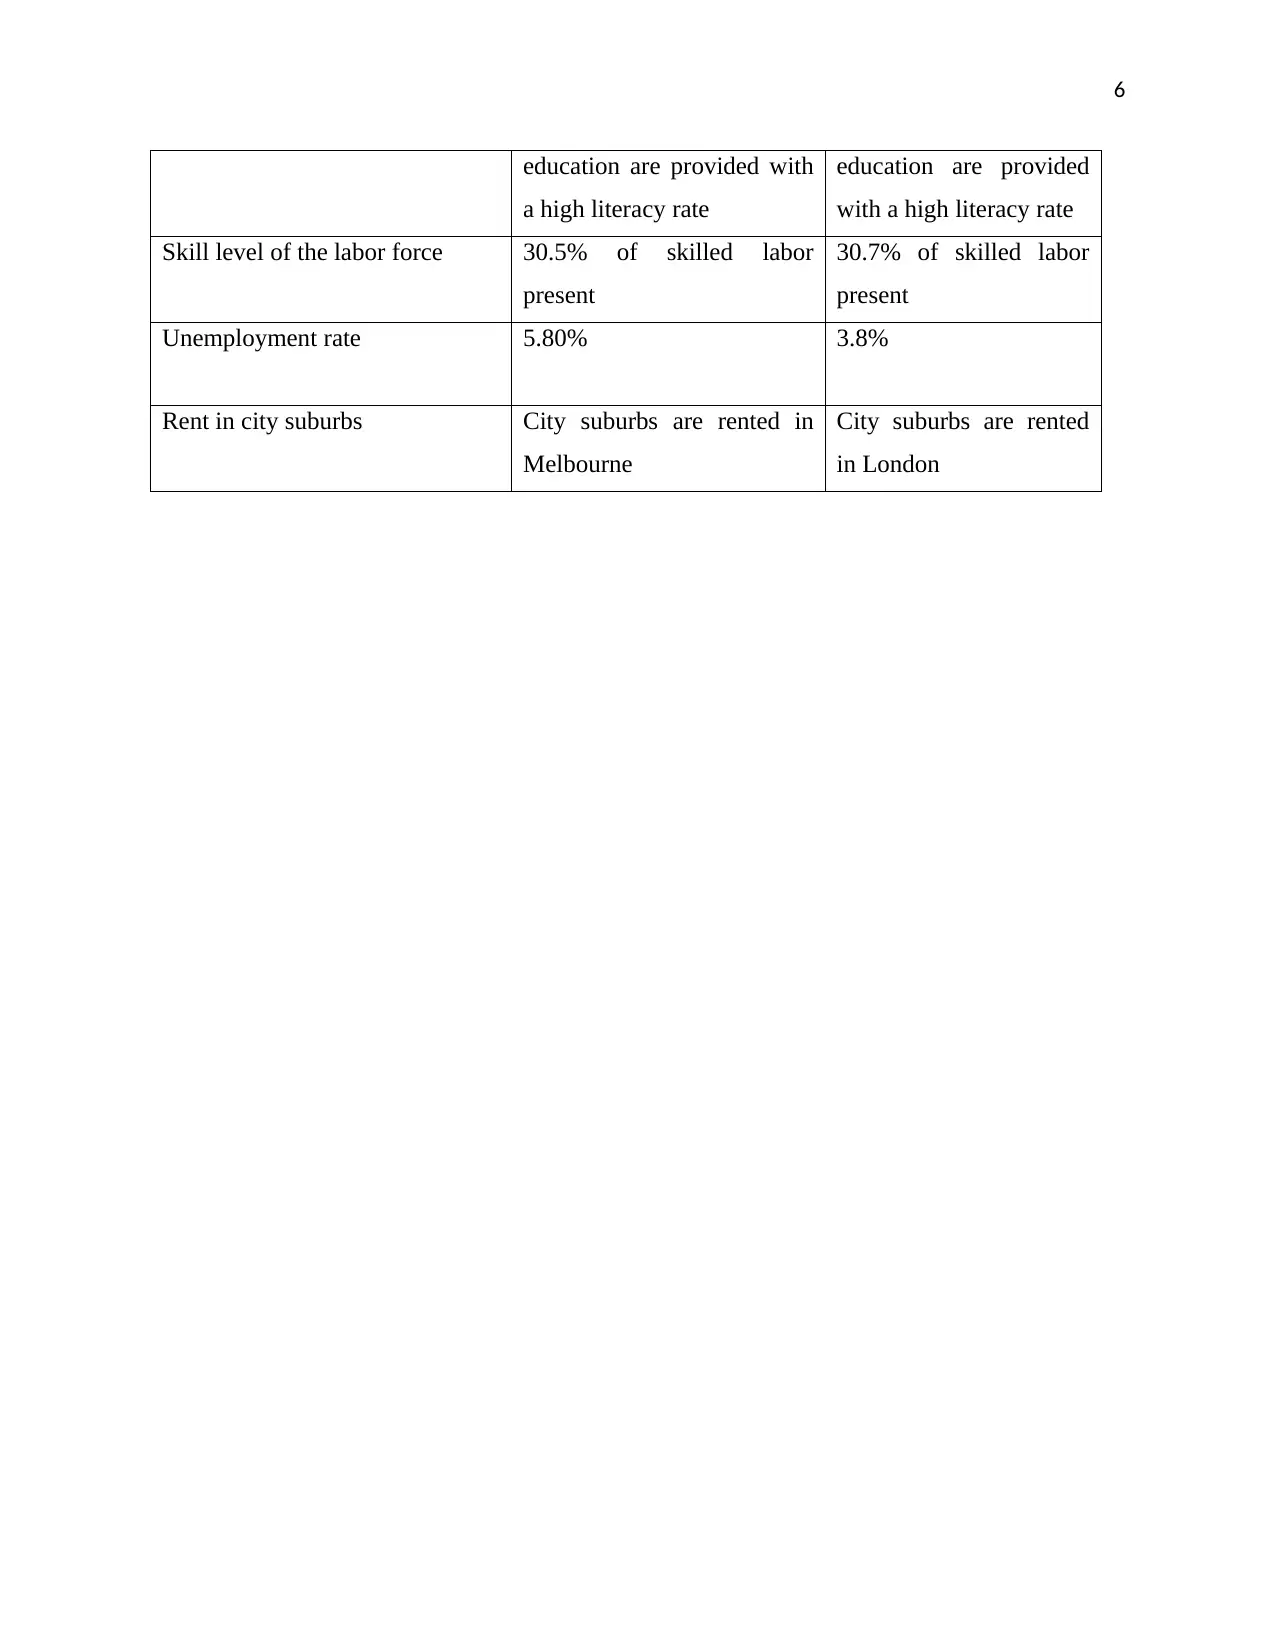
This report provides a comparative analysis of population demographics in Human Resource Management (HRM), focusing on Australia and the United Kingdom (UK). It examines key aspects such as population size, age group distributions, workforce demographics, cultural diversity, income distribution and equality, and employment statistics. The analysis includes graphical representations of age groups and data on the working population, immigrant populations, income levels, and retirement ages (Gen X, Gen Y, and Baby Boomers). The report highlights the implications of younger and older workforces, discussing their respective advantages and disadvantages. It also compares employment rates, income levels, and housing affordability in the two countries. The report draws upon various sources to provide a comprehensive overview of the demographic landscape relevant to strategic and comparative HRM practices. The report helps students understand the importance of population demographics for effective HRM strategies.
Document Page
Strategic and comparative
Human resource management
tabler-icon-diamond-filled.svg

Secure Best Marks with AI Grader

Need help grading? Try our AI Grader for instant feedback on your assignments.
Document Page
1
Table of Contents
1. Population................................................................................................................................................2
References...................................................................................................................................................6
Document Page
2
1. Population
Demographics
The demographics of Australia reveals its population to be 25,369,400 approximately, and it is
considered as 53rd rank in the world. The GDP (PPP) per capita is found to be at 19th rank in the
world, and it is estimated to be $63,999 (Raymer et al., 2018). On comparing it with the United
Kingdom, it has been found that the total population is 66,919,534 approximately, and it is
considered as the 21st largest populated country of the world. It is currently growing at a rate
of .61% each year.
Cultural diversity population is the quality of the different types of cultures when opposed to the
monoculture, the international monoculture or the homogenization of the cultures similar to the
cultural decay. It can also be defined as the gathering of different types of cultures with respect
to each other culture’s differences. The reason for the cultural diversity across Australia and
United States are race, age, ability, nationality, ethnicity, gender, religion, sexual orientation and
socioeconomic status.
Total Population, age groups graphs, size of population/ workforce, cultural diversity
population
The total population of Australia is estimated to be 25,052,184, whereas that of the UK is
66,867,335. The working population of Australia is 12.5 million, whereas that of the UK is 33.4
million. The cultural diversity population in the UK is 64.6 million, where 56.2 million of the
people are British. Besides this, in Australia, this percentage is 23.4 million, and it is considered
as to a culturally diverse population throughout the world (Raymer et al., 2018).
Document Page
3
Figure 1: The Age group graph of United Kingdom till 2016
(Source: Quint et al., 2016)
tabler-icon-diamond-filled.svg

Secure Best Marks with AI Grader

Need help grading? Try our AI Grader for instant feedback on your assignments.
Document Page
4
Figure 1: The Age group graph of Australia until 2016
(Source: Quint et al., 2016)
From the graph, it is seen that the maximum population of UK is in the age between 45 to 54
years whereas the maximum population of Australia is in the age between 25 to 34 years till
2016 (Moody et al., 2017). The implication of younger and older workforce helps in enhancing
the effectiveness of the work processes.
Younger workforce in Australia
Advantage
They have great energy levels and they try to bring creativity and innovation in their work
processes.
Disadvantage
Sometimes the younger workforce from lack of experience and lack of proper direction.
Older workforce in UK
Advantage
Older population retains vast experience and good leadership skills that helps in boosting the
overall growth of the concerned organization.
Disadvantage
The older population is significantly exposed to several diseases including mental and physical
issues which results in absenteeism.
Income distribution
The majority of the household income in the UK is in between 17,000 to 18,000 Pound, whereas
the average income distribution of Australian people is 480,000 dollars (Walker et al., 2017).
Income Equality
Document Page
5
In Australia, the income of higher class member in each week is 11,682 dollars, and for middle,
to lower class members it ranges from 3,978 dollars to 735 dollars in each week (Walker et al.,
2017). In other words, in the UK, the income rate of high-class members is 65,542 Pound,
whereas the income of middle to lower class members ranges from 12,478 pounds to 600
pounds.
Age
Male vs Female
The age structure of Australia refers to 0-14 years old males and females are found to constitute
17.75% (male 2,138,080 /female 2,027,583), the males and females sums up to 12.62% (male
1,520,528 /female 1,442,461) from ages between 15-24 years of old, the people between 25-54
years constitutes 41.35% (male 4,944,587 /female 4,760,752) and 55-64 years constitute11.84%
(male 1,379,681 /female 1,398,177) in Australia (Moody et al., 2017). Moreover, the number of
males and females over 65 years and more constitutes 16.44% (male 1,786,595 /female
2,071,701) of the population.
Age groups of the population
Retirement Age (Gen X, Gen Y, Baby boomers)
Retirement Age of Gen X in Australia and the UK are 63 years and 60 years. Retirement age of
Gen Y in Australia and the UK are 61 and 48 years. Retirement age of Baby Boomers in
Australia and the UK is 65 and 55 years (Quint et al., 2016).
Australia UK
Employment statistics 62.40%. 76.1%
Immigrant population 7.5 million 5.7 million
Income 84,032 dollars/year 28,400 pound
Housing Affordable rental housing Quality of housing
depends on the income
rate
Education Primary and secondary Primary and secondary
Document Page
6
education are provided with
a high literacy rate
education are provided
with a high literacy rate
Skill level of the labor force 30.5% of skilled labor
present
30.7% of skilled labor
present
Unemployment rate 5.80% 3.8%
Rent in city suburbs City suburbs are rented in
Melbourne
City suburbs are rented
in London
tabler-icon-diamond-filled.svg

Paraphrase This Document

Need a fresh take? Get an instant paraphrase of this document with our AI Paraphraser
Document Page
7
References
Moody, V., Stillwell, J., Dymond-Green, R., and Hayes, J., 2017. UK census aggregate statistics:
Characteristics and access. In The Routledge Handbook of Census Resources, Methods, and
Applications (pp. 109-125).
Quint, J.K., Millett, E.R., Joshi, M., Navaratnam, V., Thomas, S.L., Hurst, J.R., Smeeth, L. and
Brown, J.S., 2016. Changes in the incidence, prevalence, and mortality of bronchiectasis in the
UK from 2004 to 2013: a population-based cohort study. European Respiratory Journal, 47(1),
pp.186-193.
Raymer, J., Shi, Y., Guan, Q., Baffour, B., and Wilson, T., 2018. The Sources and Diversity of
Immigrant Population Change in Australia, 1981–2011. Demography, 55(5), pp.1777-1802.
Walker, C.E., Mahede, T., Davis, G., Miller, L.J., Girschik, J., Brameld, K., Sun, W., Rath, A.,
Aymé, S., Zubrick, S.R. and Baynam, G.S., 2017. The collective impact of rare diseases in
Western Australia: an estimate using a population-based cohort. Genetics in Medicine, 19(5),
p.546.
chevron_up_icon
1 out of 8
circle_padding
hide_on_mobile
zoom_out_icon
[object Object]