Comparative Study of Custom Wind Augmentation Shrouds on Wind Turbines
VerifiedAdded on 2019/09/16
|10
|2219
|127
Project
AI Summary
This project presents a comparative experimental study on custom-constructed wind augmentation shrouds for small-scale wind turbines. The research investigates the impact of cone-shaped wind guides and flanged diffuser shrouds on wind velocity and power output. Conducted in a laboratory setting, the study involved testing the shrouds at various wind velocities (5 to 15 mph) using a 400-Watt horizontal axis wind turbine. The methodology included 3D printing, data collection using an anemometer, and statistical analysis with IBM's SPSS software, including One Way ANOVA and t-tests. The results showed that the 30-degree angled shroud was the most efficient in increasing wind velocity, and while the flanged diffuser did not show significant improvement, the study provides valuable insights for future shroud designs and turbine performance enhancement, including the potential for larger-scale applications.

Comparative Study of custom-constructed Wind Augmentation Shrouds on a
small-scale Wind Turbine
Abstract
Wind shrouding experiments are conducted to investigate the influences of two custom-
constructed wind augmentation devices: cone-shaped wind guide and a flanged diffuser shroud.
A group of Industrial Technology students will develop both diffuser shrouds that will collect
and accelerate the incoming wind. The tests will be carried out for three wind velocities (5 mph
to 15 mph) in a laboratory setting to compare the influences of two shrouding devices on the
power output. A small scale horizontal axis wind turbine will be used with 400 Watt power
rating. The study will report the comparative measurements performed on an experimental small-
scale wind turbine attached for both shrouding devices.
Introduction
Large scale wind shrouding devices are expensive to build and maintain, however, if used
properly, the wind power is great source of renewable energy that gives the incentive to work on
improving the technology (Foote, 2011). A recent study with a cone shaped wind guide system
inside the shrouding resulted in more than 60% power outcome compared to a conventional bare
wind turbine (Dakeev, 2014). Additionally, researchers reported that the wind augmentation
device significantly influences power generation (Kosasih & Tondelli, 2012; Dakeev, 2011).
The Betz Law states that no wind turbine can capture more than 59.3% of the kinetic
energy in wind (Betz, 1966). Utility scale wind turbines achieve approximately 75% to 80% of
the Betz limit at their peak (Burton, 2001). Although Betz Law limits the wind turbines from
Paraphrase This Document
Need a fresh take? Get an instant paraphrase of this document with our AI Paraphraser

producing no more than 59.3% Hansen (2000) reported that enclosing the wind turbine within
the shroud can improve the power generation beyond the Betz limit (Hansen, 2000). The purpose
of this study is to design and construct the optimal wind shrouding device to amplify the
incoming wind velocity for more efficient power generation. The authors of this study, all three
with different backgrounds, constructed four custom designed wind augmentation devices to
investigate the potential wind increase. One of the authors, a student with Business background,
was given the opportunity to work on this project and be exposed to both 3D modeling and
printing, building, testing the models, as well as data analysis.
Literature Review
Constantly changing wind velocities require building a dynamic wind shroud with
sensors to determine the optimal relationship between wind velocity and angle wind shrouding
adjusts to for better power generation. However, determination of the optimal design of the wind
augmentation device plays a crucial role on the efficiency of power generation. Ohya and
Karasudari developed a collection-acceleration device for wind in 2010, which was a diffuser
shroud equipped with brim, called wind – lens (Ohya & Karasudari, 2010). They tested two
types of hollow-structure models; a nozzle, and a diffuser type. Their experiments revealed that
the diffuser-shaped structure could accelerate the wind at the inlet. Another research in 2014
reported that the power generated by an experimental small-scale wind turbine increased more
than 60% (Dakeev, 2014) when the shroud was introduced. The researcher tested and analyzed
the wind shrouding to evaluate the performance of the wind turbine at various wind velocities.
Dakeev and his team concluded that power generation significantly increased with the wind
shrouding system (Dakeev, 2014; Dakeev & Mazumder, 2015). Additionally, Tondelli and
Kosasih in 2012 approached the wind shrouding with a different design. They added a flange to

the exit of the diffuser and suggested the brim design should be incorporated in the shroud
designs (Kosiah & Tondelli, 2012). This paper discusses how various designs of the shrouds can
affect the wind velocity at the inlet and the outlet of the wind augmentation devices.
Methodology
The study involves both testing and analyzing the custom designed wind augmentation
devices (Figure 1) to evaluate the efficiency of air flow. For the phase one, the designs of three
shrouds, 200, 250, and 300, were 3D printed to investigate the wind velocity change between inlet
and the outlet. This study was very beneficial for the authors themselves, knowing they are all
with different background experiences. One of the authors with Civil Engineering background,
was provided with the ability to learn 3D modeling, as well as 3D printing.
A miniature blower, with the outlet diameter of 7 inches, was utilized to produce an
artificial wind in a closed environment as shown in Figure 1. A total number of 90 readings from
the anemometer were collected in the laboratory setting for all three designs as illustrated in
Figure 1: Construction of wind augmentation devices
⊘ This is a preview!⊘
Do you want full access?
Subscribe today to unlock all pages.
Trusted by 1+ million students worldwide

Figure 2 below. The Industrial Technology students collected the wind speed readings to transfer
the collected data to IBM’s SPSS for One Way ANOVA test.
The phase two compared a custom constructed wind shroud with a flange at the exit of
the device with the most optimal design previously designed. In other words, the researchers
identified the most optimal design for the wind shroud during the phase one and added a flange
to the same shroud to collect wind data (Figure 3). Collected data was sent to SPSS for t-Test
analysis to compare the flange design wind readings with the proven design from phase one.
Speaking of SPSS software, the author with Mechanical Engineering background had the chance
to learn how to use the software and conduct a statistical analysis.
Figure 2: Wind Speed Data collection
Paraphrase This Document
Need a fresh take? Get an instant paraphrase of this document with our AI Paraphraser
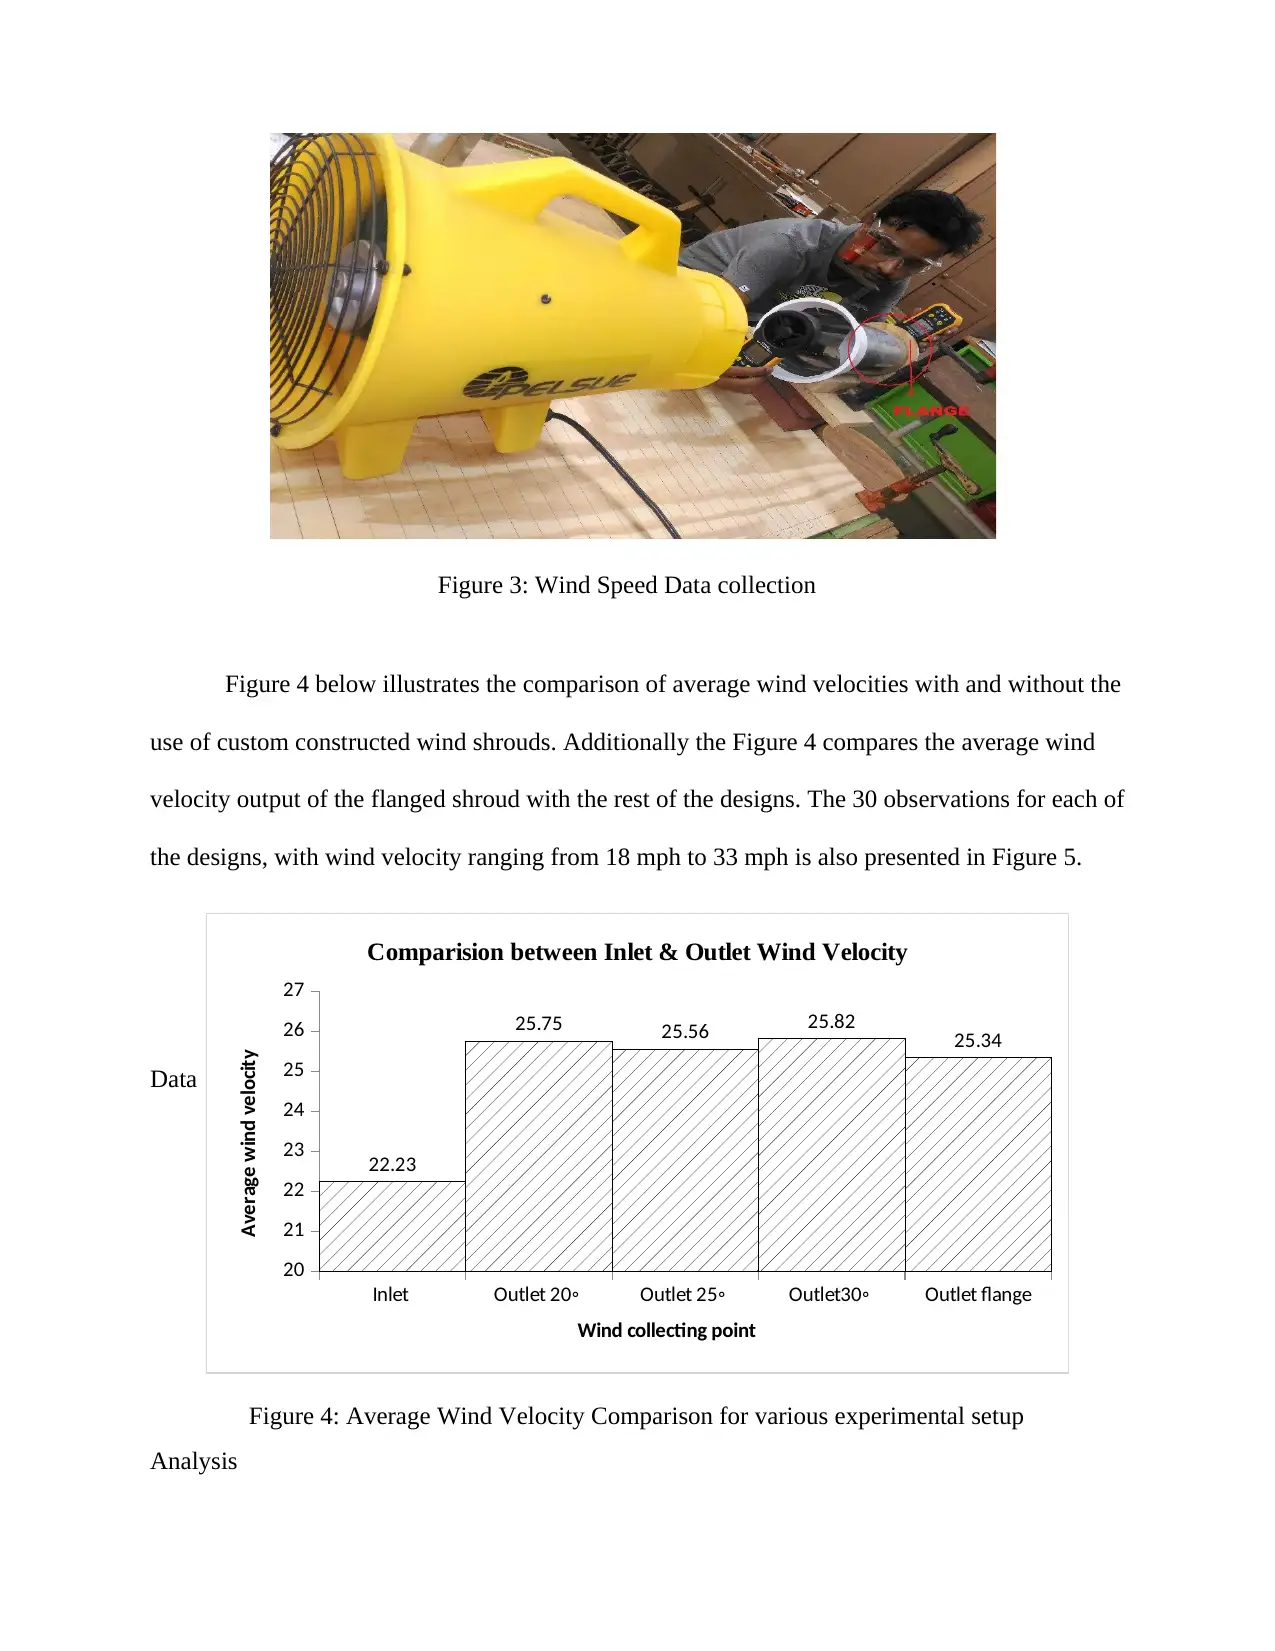
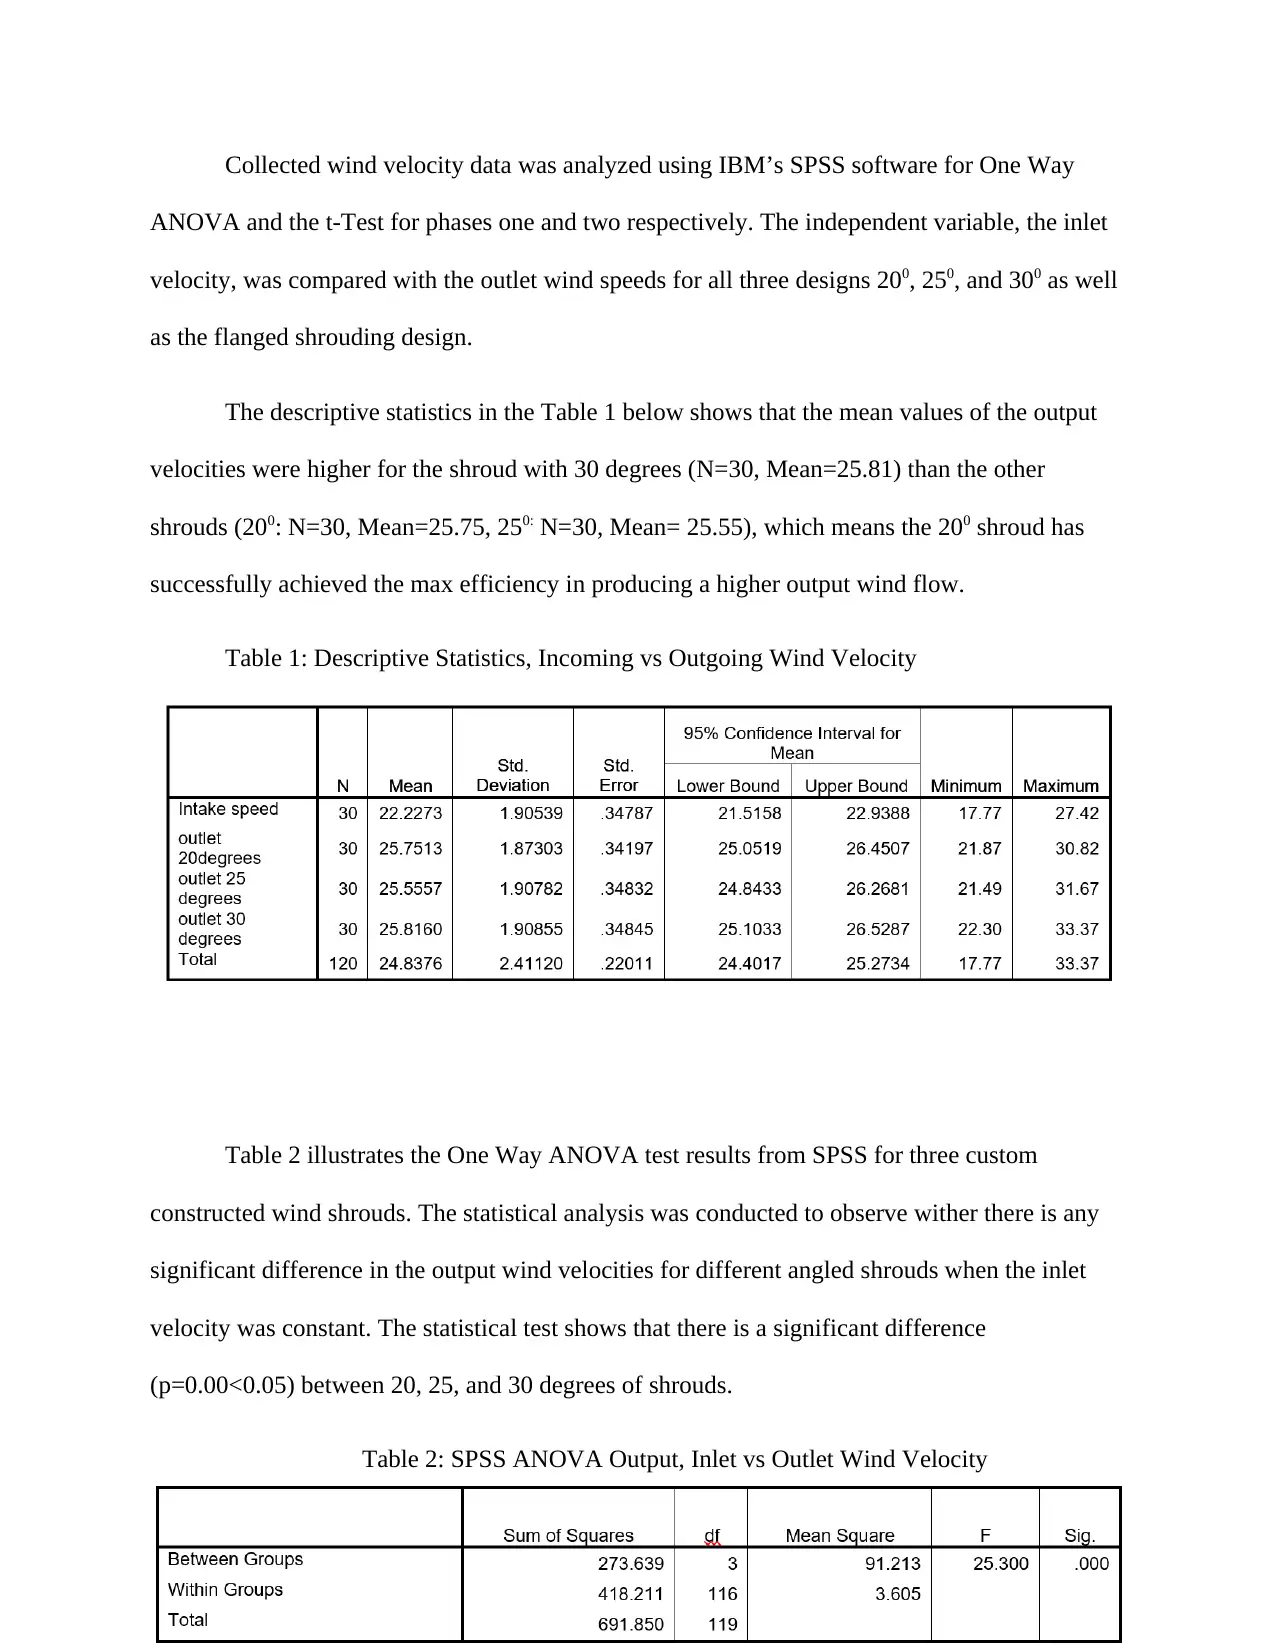
Figure 4 below illustrates the comparison of average wind velocities with and without the
use of custom constructed wind shrouds. Additionally the Figure 4 compares the average wind
velocity output of the flanged shroud with the rest of the designs. The 30 observations for each of
the designs, with wind velocity ranging from 18 mph to 33 mph is also presented in Figure 5.
Data
Analysis
Figure 3: Wind Speed Data collection
Figure 4: Average Wind Velocity Comparison for various experimental setup
Inlet Outlet 20◦ Outlet 25◦ Outlet30◦ Outlet flange
20
21
22
23
24
25
26
27
22.23
25.75 25.56 25.82 25.34
Comparision between Inlet & Outlet Wind Velocity
Wind collecting point
Average wind velocity
Collected wind velocity data was analyzed using IBM’s SPSS software for One Way
ANOVA and the t-Test for phases one and two respectively. The independent variable, the inlet
velocity, was compared with the outlet wind speeds for all three designs 200, 250, and 300 as well
as the flanged shrouding design.
The descriptive statistics in the Table 1 below shows that the mean values of the output
velocities were higher for the shroud with 30 degrees (N=30, Mean=25.81) than the other
shrouds (200: N=30, Mean=25.75, 250: N=30, Mean= 25.55), which means the 200 shroud has
successfully achieved the max efficiency in producing a higher output wind flow.
Table 1: Descriptive Statistics, Incoming vs Outgoing Wind Velocity
Table 2 illustrates the One Way ANOVA test results from SPSS for three custom
constructed wind shrouds. The statistical analysis was conducted to observe wither there is any
significant difference in the output wind velocities for different angled shrouds when the inlet
velocity was constant. The statistical test shows that there is a significant difference
(p=0.00<0.05) between 20, 25, and 30 degrees of shrouds.
Table 2: SPSS ANOVA Output, Inlet vs Outlet Wind Velocity
⊘ This is a preview!⊘
Do you want full access?
Subscribe today to unlock all pages.
Trusted by 1+ million students worldwide

The Tukey analysis drew further conclusions to determine the shroud with the maximum
significant difference in the means of inlet and outlet wind data. Table 3 below shows that there
is a maximum mean difference (MD=3.58) in wind speeds for the 300 shroud and the intake,
meaning that 300 design achieved the maximum efficiency and could produce higher output wind
flow.
Table 3: Tukey HSD Multiple Comparison
The second phase of the analysis was to introduce the flange to the custom wind
shrouding (Figure 3). Twenty degree shroud was selected to compare the wind speed outcomes
between the flanged design and without flange. Since the researchers already had 200 design
Paraphrase This Document
Need a fresh take? Get an instant paraphrase of this document with our AI Paraphraser
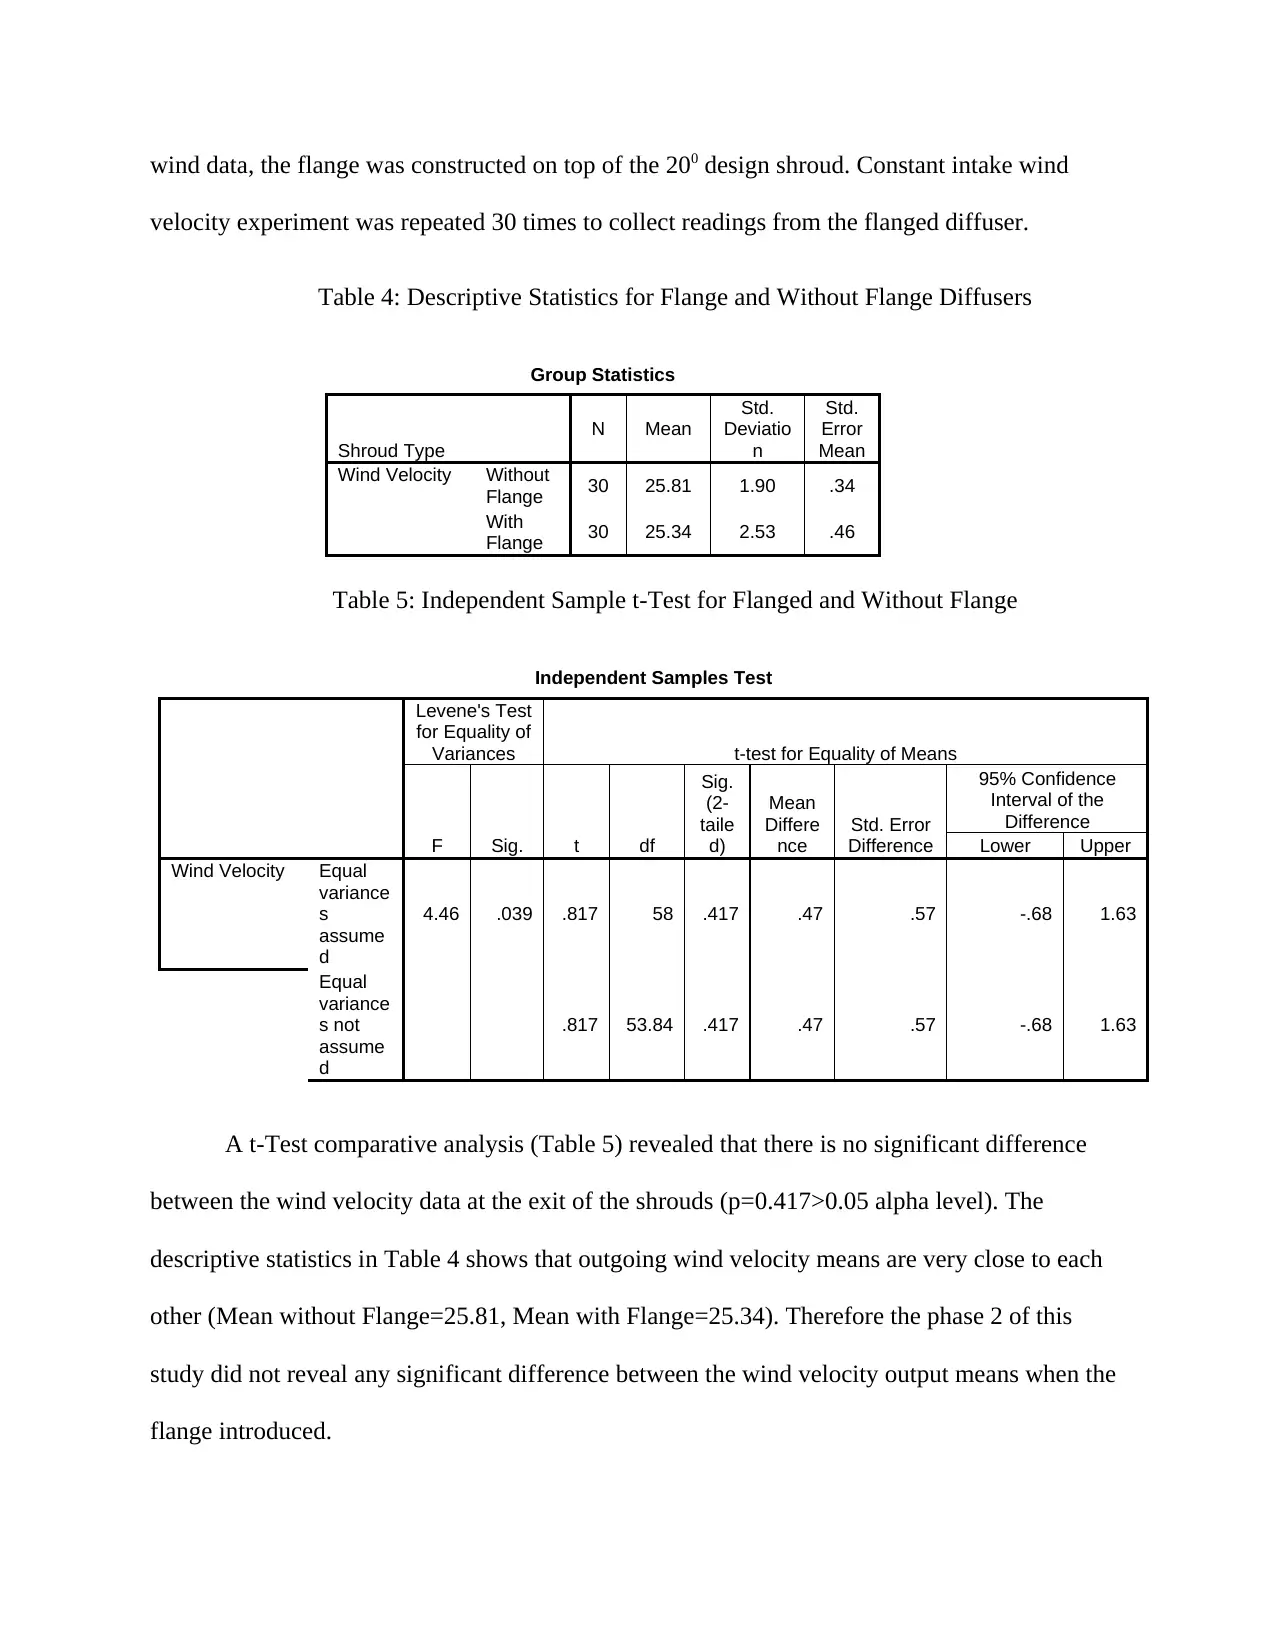
wind data, the flange was constructed on top of the 200 design shroud. Constant intake wind
velocity experiment was repeated 30 times to collect readings from the flanged diffuser.
Table 4: Descriptive Statistics for Flange and Without Flange Diffusers
Group Statistics
Shroud Type
N Mean
Std.
Deviatio
n
Std.
Error
Mean
Wind Velocity Without
Flange 30 25.81 1.90 .34
With
Flange 30 25.34 2.53 .46
Table 5: Independent Sample t-Test for Flanged and Without Flange
Independent Samples Test
Levene's Test
for Equality of
Variances t-test for Equality of Means
F Sig. t df
Sig.
(2-
taile
d)
Mean
Differe
nce
Std. Error
Difference
95% Confidence
Interval of the
Difference
Lower Upper
Wind Velocity Equal
variance
s
assume
d
4.46 .039 .817 58 .417 .47 .57 -.68 1.63
Equal
variance
s not
assume
d
.817 53.84 .417 .47 .57 -.68 1.63
A t-Test comparative analysis (Table 5) revealed that there is no significant difference
between the wind velocity data at the exit of the shrouds (p=0.417>0.05 alpha level). The
descriptive statistics in Table 4 shows that outgoing wind velocity means are very close to each
other (Mean without Flange=25.81, Mean with Flange=25.34). Therefore the phase 2 of this
study did not reveal any significant difference between the wind velocity output means when the
flange introduced.

Conclusion
The purpose of this study was to investigate the optimal design for wind augmentation
devices. The researcher developed three designs with various inlet angles for comparison
reasons. Additionally a flange was introduced to a diffuser to investigate if there was a
significant difference when the flange had been introduced. One way ANOVA test resulted that
the 300 degree angled shroud was increasing wind velocity significantly differently compared to
the inlet wind velocity. Moreover, the 300 degree shroud was the most efficient with the highest
mean values of wind speeds at the exit of the shroud. However, all of the designs (20, 25, and
30) were capable of increasing the wind velocity significantly. On the other hand, the flanged
diffuser did not reveal significant difference in mean wind speeds when compared to a regular
200 degree design.
Future work
The analyses of various shroud designs revealed important information on the future
construction of the shroud. Although the abstract initially said a wind turbine would be included
⊘ This is a preview!⊘
Do you want full access?
Subscribe today to unlock all pages.
Trusted by 1+ million students worldwide

to investigate the power generation with the shrouds the custom constructed designs were too
small to test with the 400W rating wind turbine. The researchers will be developing a custom
shroud with 300 degree angle to investigate the power generation by a small scale wind turbine.
The next phase of the study will include constructing a bigger scale wind shroud with 45-50
diameter outlet for 400W to 1.2kW wind turbine. The outcomes of the next study will be
reported in various conferences/publications.
References
Betz, A. (1966) Introduction to the Theory of Flow Machines. (D. G. Randall, Trans.) Oxford:
Pergamon Press
Burton T., Jenkins, N., Sharpe, D. & Bossanyi, E., (2011), Wind Energy Handbook, Wiley
Publications, ISBN 9780470699751
Dakeev, U. (2011). “Management of Wind Power Generation with the Attachment of Wind
Tunnel”. IBSU Scientific Journal, Vol. 5 No.2, pp 71-82, 2011, ISSN: 1512-3731
Dakeev, U., Lam, C., Pung, J. (2014). “Analysis of Wind Power Generation with Wind Guide
Attachment”. International Journal of Engineering Research and Innovation. ISSN: 2152-
4165, Vol 7, 1, 43-47
Dakeev, U., Mazumder, Q., Yildiz, F., Baltaci, K., (2015). “Design and Development of a New
Small-Scale Wind Turbine Blade”. ASEE Annual Conference, 2015, Seattle
Hansen, M.O.L., Sorensen, N. N. & Flay, R. G. J., (2000). “Effect of Placing a Diffuser around
a Wind Turbine.” Wind Energy, 3, pp.207-213, 2000
Kosasih, B. & Tondelli, A., (2012). Experimental study of shrouded micro-wind turbine.
Evolving Energy-IEF International Energy Congress. [Electronic version]. Procedia
Engineering 49 (2012) 92-98
1 out of 10
Related Documents


Your All-in-One AI-Powered Toolkit for Academic Success.
+13062052269
info@desklib.com
Available 24*7 on WhatsApp / Email
![[object Object]](/_next/static/media/star-bottom.7253800d.svg)
Unlock your academic potential
Copyright © 2020–2026 A2Z Services. All Rights Reserved. Developed and managed by ZUCOL.