Optimal Design of Wind Augmentation Shrouds: A Comparative Study
VerifiedAdded on 2019/09/20
|8
|2597
|203
Report
AI Summary
This report presents a comparative analysis of custom-constructed wind augmentation shrouds, designed to enhance wind turbine efficiency. Researchers from Texas A&M University-Kingsville designed and 3D-printed shrouds with varying inlet angles (35, 40, and 45 degrees) and performed statistical analysis using IBM SPSS to determine the optimal design for maximizing wind energy generation. The study builds upon previous research, using a blower to simulate wind and anemometers to measure wind velocities at the inlet and outlet of the shrouds. The results, analyzed using One-way ANOVA and Tukey tests, revealed that the 35-degree inlet angle shroud demonstrated the highest efficiency, amplifying wind velocity significantly compared to the inlet wind velocity, followed by 30-degree and 20-degree shrouds. The study highlights the potential of these shrouds to improve wind turbine power output, addressing the growing global demand for renewable energy and the need to mitigate the environmental impact of fossil fuels. The report includes a literature review discussing global warming, wind energy's role, and the benefits of Concentrator Augmented Wind Turbines (CWTs).
Comparative study of various custom constructed wind augumentation
shrouds for optimal design
Ulan Dakeev
Assistant Professor in Industrial Management & Technology, Texas A&M University -
Kingsville
Ulan.dakeev@tamuk.edu
Farzin Heidari
Associate Professor in Industrial Management & Technology, Texas A&M University -
Kingsville
Farzin.heidari@tamuk.edu
Mohammad Mustaq Bijapur
Masters in Industrial Management & Technology, Texas A&M University Kingsville
Mohammad.bijapur@students.tamuk.edu
Sumanth Yanamala
Masters in Industrial Management & Technology, Texas A&M University Kingsville
sumanth.yanamala@students.tamuk.edu
Abstract
This study represents the impact of wind velocities on the power generation and how the
wind energy is dependent on the various flow behaviors of the wind subjected to the medium
it is allowed to flow through. A rapid growth and improvement in the utilization of wind
energy to produce electricity is observed in the last two decades because of the concerns
relating to global warming and continuous increase in the prices of fossil fuels[1].Wind power
generated increases by a factor of eight when the wind speed is doubled which shows that
energy available in the wind directly reflects to the wind power[2].The amount of power
which the wind is capable of generating is given by the equation V3.The wind
power equation shows that the wind power is largely influenced by the wind speed as it is
directly proportional to cube of the wind speed. Previous studies have successfully revealed
that for constant wind available the shroud with inlet angle 30 degrees has been delivering
the maximum wind energy among three different shrouds of inlet angles 20, 25 and 30
degrees[3]. In continuation and further investigation to the previous research[3] conducted, in
this study researchers have designed and analyzed three different shrouds with varying inlet
angles of 35, 40 and 45 degrees by performing statistical tests using IBM SPSS statistics 22
version software in order to determine the best optimal design of the shroud generating
maximum wind energy. The statistical analysis performed on the data collected from this
experiment have successfully showed that for constant wind available the shroud with inlet
angle 45 degrees has been delivering the maximum wind energy among three different
shrouds of inlet angles 35, 40 and 45 degrees which projects that the shroud with inlet angle
45 degrees is the best optimal design for the shroud to achieve maximum wind energy
among the three shrouds.
Proceedings of The 2016 IAJC-ISAM International Conference
ISBN 978-1-60643-379-9
Paraphrase This Document
Need a fresh take? Get an instant paraphrase of this document with our AI Paraphraser
Introduction
Wind is one of the continuously occurring and naturally available sources to the mankind for
producing energy.The world is experiencing excessive demand for energy due to the rapid
economic growth and industrialization [4]. There is a huge increase in the consumption of
fossil fuel to produce energy. The global Carbon dioxide content in the environment has
upscaled from 280 ppm in the pre-industrialization era to 400 ppm in May 2013.This report
shows a 39 percent increase in the Carbon dioxide emissions into environment. Recent
reports submitted by National Oceanic and atmospheric administration (NOAA) on March 7
2016, the global CO2 content in the environment was 399.29 ppm in January 2015 which
increased to 402.59 ppm in January 2016[5]. The negative effects of the fossil fuels emitting
CO2 and harmful toxic gases, continuous increase in the prices of fossil fuels and heavy
consumption leading to depletion of resources for future generations, most parts of the world
has shown keen interest in wind energy technologies to produce power[6].
Impressive characteristics of the wind and its abundant nature is attracting the world to see
wind energy as the best means of source to generate electricity[7]. The power output a wind
turbine can deliver is highly depended upon the wind velocity. The wind velocity is
responsible for rotating the blades in order to convert the mechanical energy into electrical
energy. The purpose of this study is to investigate the newly augmented shroud devices with
varying inlet angles of 20, 30 and 35 degrees designed to maximize wind velocities.
Furthermore, the wind velocity is diverted towards the wind turbines to generate maximum
power. The authors of this study, one from Civil Engineering background and the other from
mechanical engineering were provided with the ability to perform statistical analysis, learn
3D modeling, as well as 3D printing technology.
Literature review
Global warming is one of the major threats to the world which everyone should be aware of
and act responsible in controlling and reducing its future causes. About 80% of the global
warming is being caused due to the CO2 emission from the fossil fuels[8]. Wind power has the
ability to stop this environmental disaster as it is pollution free and consume nearly zero
percent of water in generating electricity thus reducing CO2 emissions[9]. Recent reports have
shown an increase in the global wind power capacity to 318 GW from 39 GW between 2003
and 2013. On May 11th 2014 around 1 pm, Germany recorded 21.3 GW of wind power
capacity leaving behind solar power which was 15.2 GW indicating that wind power has the
capability of being one of the best resources to generate electricity[10]. Wind turbine is
utilized as a main source to transform wind energy to electrical energy[11]. Wind turbines are
usually categorized as horizontal axis and vertical axis based on design, and also into
offshore wind turbine and onshore wind turbine based on the installed location. Power
capacity of a wind turbine generally depends upon its design and the wind speed[12]. One
major drawback of wind turbine technology is with low wind speeds possessing less energy
density per volume of air hitting turbine blades which increases the production cost
compared to the fossil fuels[13]. Various researches conducted to improve the energy density
in wind have shown that Concentrator Augmented Wind turbines (CWTs) would be one of
Proceedings of The 2016 IAJC-ISAM International Conference
ISBN 978-1-60643-379-9
the best ways to improve power capacity and make it cost effective resource[14]. To improve
the power capacity of a wind turbine the authors of this paper have designed three different
shrouds with inlet angles of 35, 40, and 45 degrees and utilized in such a way to improve the
wind speed which ultimately increases the wind power capacity of a wind turbine.
Methodology:
To develop a new technique to improve the power efficiency of a wind turbine from low
wind velocities the authors of this paper have designed and 3D printed three different
shrouds with inlet angles 35, 40 and 45 degrees to perform the analysis. The dimensions of
the shrouds were designed such that they could produce maximum wind output from the
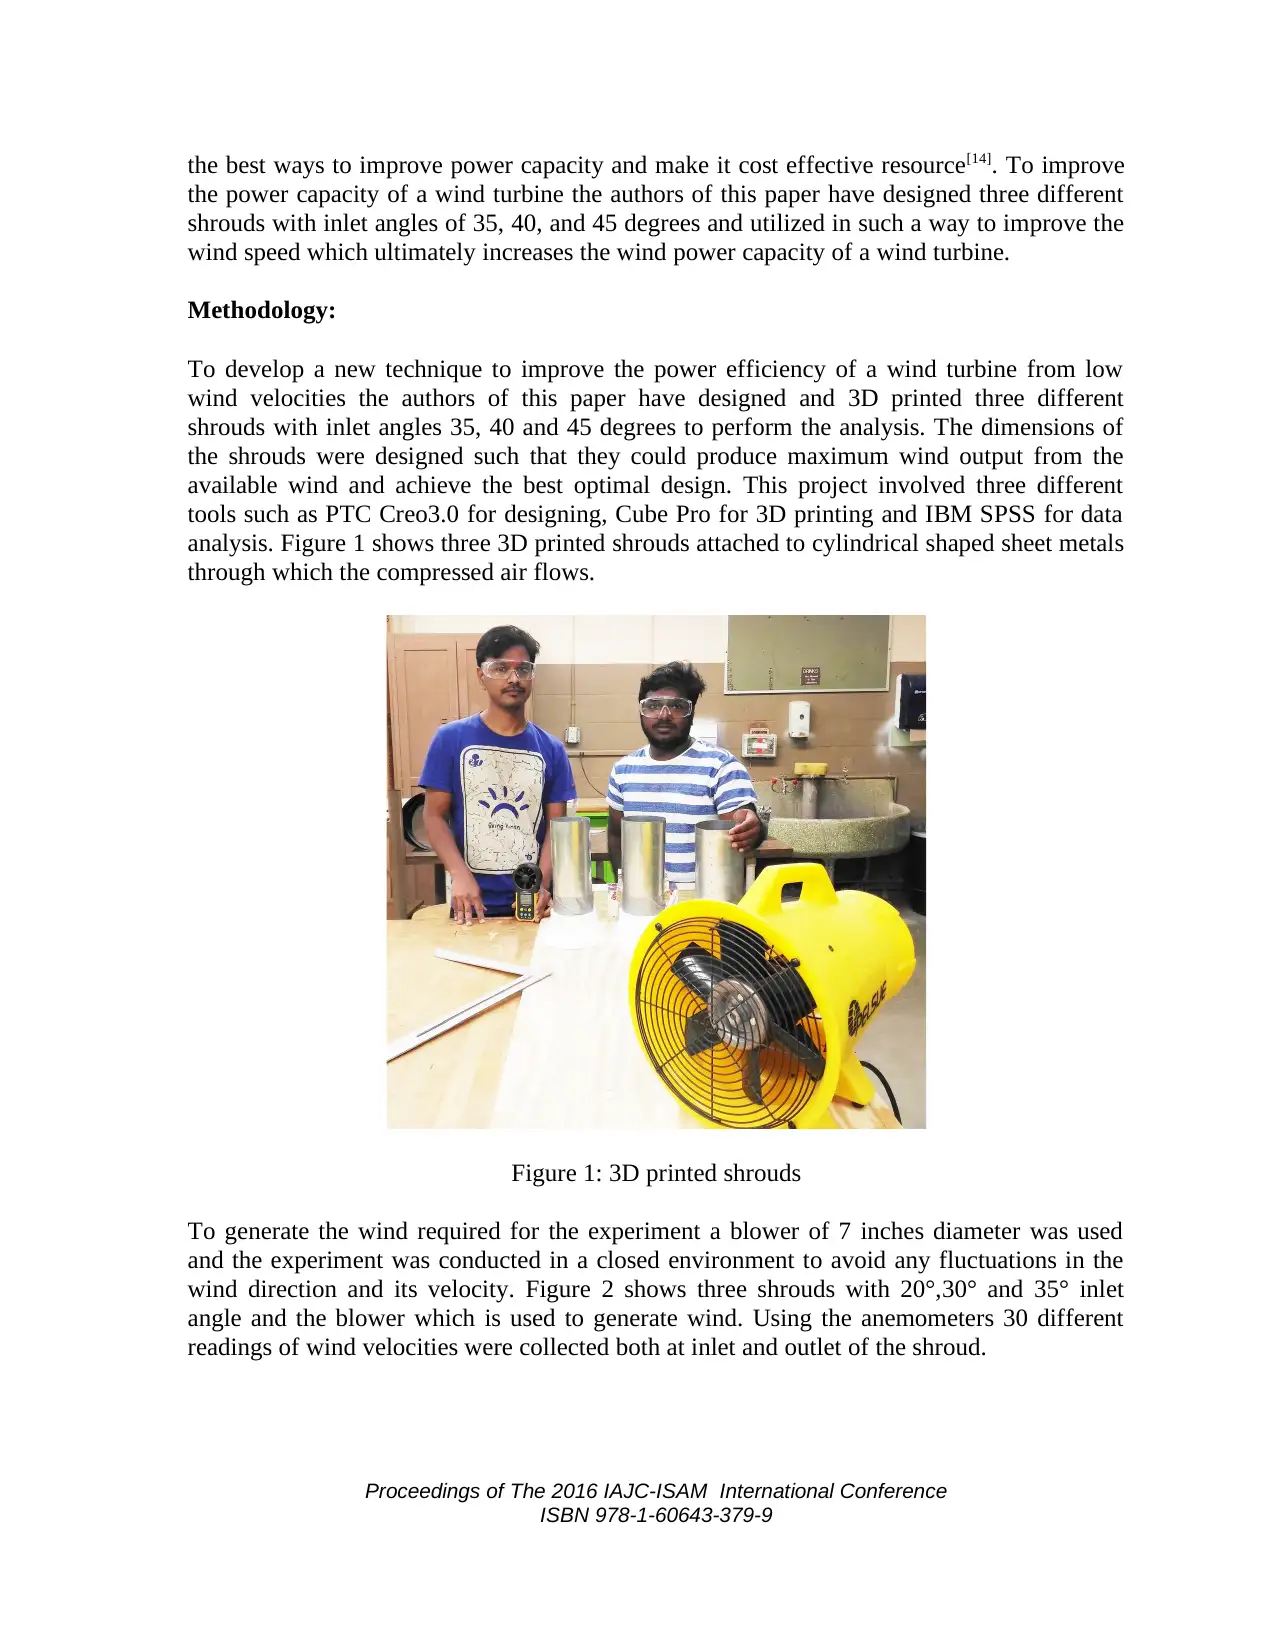
available wind and achieve the best optimal design. This project involved three different
tools such as PTC Creo3.0 for designing, Cube Pro for 3D printing and IBM SPSS for data
analysis. Figure 1 shows three 3D printed shrouds attached to cylindrical shaped sheet metals
through which the compressed air flows.
Figure 1: 3D printed shrouds
To generate the wind required for the experiment a blower of 7 inches diameter was used
and the experiment was conducted in a closed environment to avoid any fluctuations in the
wind direction and its velocity. Figure 2 shows three shrouds with 20°,30° and 35° inlet
angle and the blower which is used to generate wind. Using the anemometers 30 different
readings of wind velocities were collected both at inlet and outlet of the shroud.
Proceedings of The 2016 IAJC-ISAM International Conference
ISBN 978-1-60643-379-9
the power capacity of a wind turbine the authors of this paper have designed three different
shrouds with inlet angles of 35, 40, and 45 degrees and utilized in such a way to improve the
wind speed which ultimately increases the wind power capacity of a wind turbine.
Methodology:
To develop a new technique to improve the power efficiency of a wind turbine from low
wind velocities the authors of this paper have designed and 3D printed three different
shrouds with inlet angles 35, 40 and 45 degrees to perform the analysis. The dimensions of
the shrouds were designed such that they could produce maximum wind output from the
available wind and achieve the best optimal design. This project involved three different
tools such as PTC Creo3.0 for designing, Cube Pro for 3D printing and IBM SPSS for data
analysis. Figure 1 shows three 3D printed shrouds attached to cylindrical shaped sheet metals
through which the compressed air flows.
Figure 1: 3D printed shrouds
To generate the wind required for the experiment a blower of 7 inches diameter was used
and the experiment was conducted in a closed environment to avoid any fluctuations in the
wind direction and its velocity. Figure 2 shows three shrouds with 20°,30° and 35° inlet
angle and the blower which is used to generate wind. Using the anemometers 30 different
readings of wind velocities were collected both at inlet and outlet of the shroud.
Proceedings of The 2016 IAJC-ISAM International Conference
ISBN 978-1-60643-379-9
⊘ This is a preview!⊘
Do you want full access?
Subscribe today to unlock all pages.
Trusted by 1+ million students worldwide

Figure 2: Shroud with 35 degree inlet angle
The authors repeated the procedure and data is collected from 20 and 30 degrees shrouds. A
statistical analysis is performed using One way ANOVA to analysed the collected data to
determine if there is any significance differences between the all three shrouds.
Data Analysis
One way Anova test in the IBM SPSS statistics 22 was performed on the data recorded
during the experiment to analyze and compare the velocity differences between the inlet and
output velocities of different shrouds.
Table 1 represents the descriptive data of the velocities of different shrouds. The mean value
column of the Table 1 shows that the mean velocity for constant inlet mean velocity
(μ=22.227) was higher for the shroud with inlet angle 35°( N=30, μ=28.211) when
compared with the other shrouds of inlet angles 20°( N=30, μ=25.751) and 30° (N=30,
μ=25.816) which signifies that the 35° shroud had achieved higher efficiency in producing
greater output velocity from available constant inlet velocity.
Table 1 – Descriptive statistics, Descriptive Statistics, Incoming vs Outgoing Wind Velocity
Proceedings of The 2016 IAJC-ISAM International Conference
ISBN 978-1-60643-379-9
Paraphrase This Document
Need a fresh take? Get an instant paraphrase of this document with our AI Paraphraser
VelocityTyp
e N Mean Std.
Deviation
Std.
Error
95% Confidence
Interval for Mean Minimum Maximum
Lower
Bound
Upper
Bound
Inlet velocity 30 22.23 1.91 0.35 21.52 22.94 17.77 27.42
20° Outlet
Velocity 30 25.75 1.87 0.34 25.05 26.45 21.87 30.82
30° Outlet
Velocity 30 25.82 1.91 0.35 25.10 26.53 22.30 33.37
35° Outlet
Velocity 30 28.21 3.62 0.66 26.86 29.56 23.36 40.59
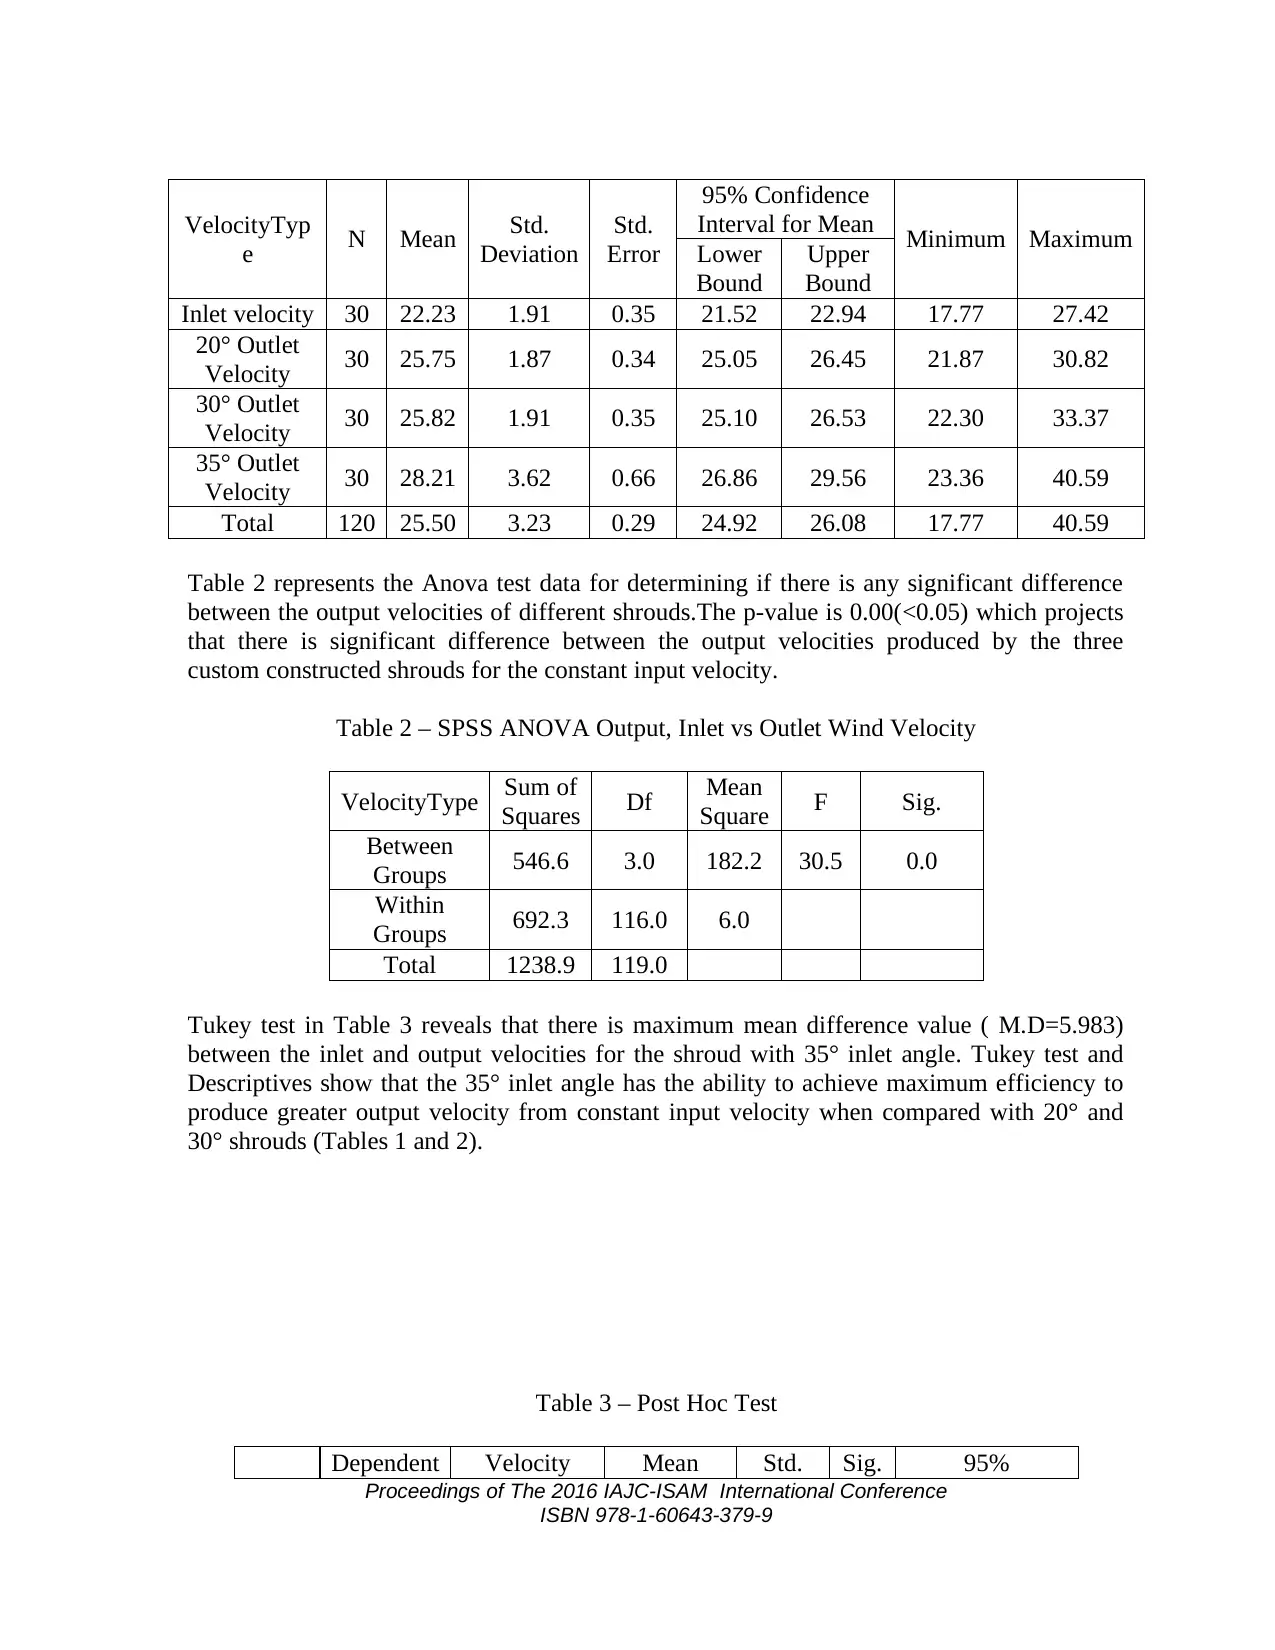
Total 120 25.50 3.23 0.29 24.92 26.08 17.77 40.59
Table 2 represents the Anova test data for determining if there is any significant difference
between the output velocities of different shrouds.The p-value is 0.00(<0.05) which projects
that there is significant difference between the output velocities produced by the three
custom constructed shrouds for the constant input velocity.
Table 2 – SPSS ANOVA Output, Inlet vs Outlet Wind Velocity
VelocityType Sum of
Squares Df Mean
Square F Sig.
Between
Groups 546.6 3.0 182.2 30.5 0.0
Within
Groups 692.3 116.0 6.0
Total 1238.9 119.0
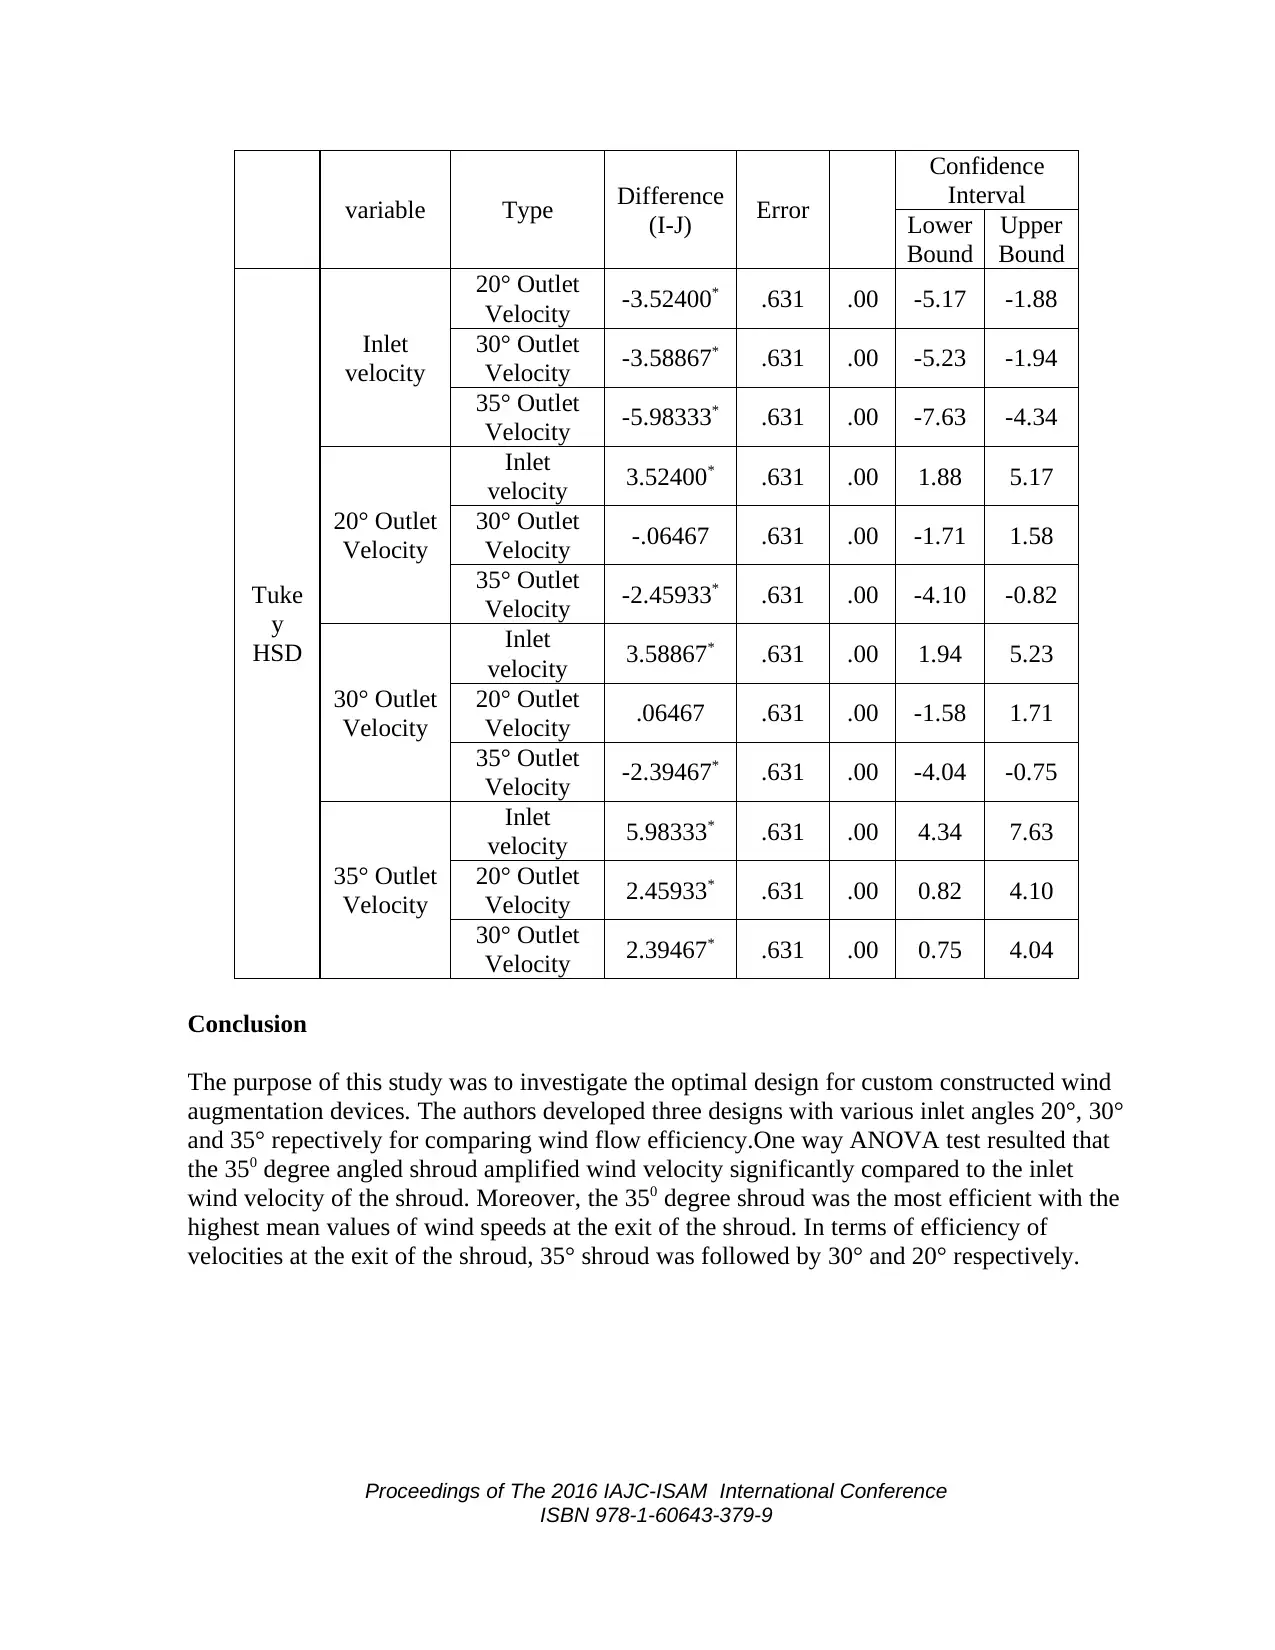
Tukey test in Table 3 reveals that there is maximum mean difference value ( M.D=5.983)
between the inlet and output velocities for the shroud with 35° inlet angle. Tukey test and
Descriptives show that the 35° inlet angle has the ability to achieve maximum efficiency to
produce greater output velocity from constant input velocity when compared with 20° and
30° shrouds (Tables 1 and 2).
Table 3 – Post Hoc Test
Dependent Velocity Mean Std. Sig. 95%
Proceedings of The 2016 IAJC-ISAM International Conference
ISBN 978-1-60643-379-9
e N Mean Std.
Deviation
Std.
Error
95% Confidence
Interval for Mean Minimum Maximum
Lower
Bound
Upper
Bound
Inlet velocity 30 22.23 1.91 0.35 21.52 22.94 17.77 27.42
20° Outlet
Velocity 30 25.75 1.87 0.34 25.05 26.45 21.87 30.82
30° Outlet
Velocity 30 25.82 1.91 0.35 25.10 26.53 22.30 33.37
35° Outlet
Velocity 30 28.21 3.62 0.66 26.86 29.56 23.36 40.59
Total 120 25.50 3.23 0.29 24.92 26.08 17.77 40.59
Table 2 represents the Anova test data for determining if there is any significant difference
between the output velocities of different shrouds.The p-value is 0.00(<0.05) which projects
that there is significant difference between the output velocities produced by the three
custom constructed shrouds for the constant input velocity.
Table 2 – SPSS ANOVA Output, Inlet vs Outlet Wind Velocity
VelocityType Sum of
Squares Df Mean
Square F Sig.
Between
Groups 546.6 3.0 182.2 30.5 0.0
Within
Groups 692.3 116.0 6.0
Total 1238.9 119.0
Tukey test in Table 3 reveals that there is maximum mean difference value ( M.D=5.983)
between the inlet and output velocities for the shroud with 35° inlet angle. Tukey test and
Descriptives show that the 35° inlet angle has the ability to achieve maximum efficiency to
produce greater output velocity from constant input velocity when compared with 20° and
30° shrouds (Tables 1 and 2).
Table 3 – Post Hoc Test
Dependent Velocity Mean Std. Sig. 95%
Proceedings of The 2016 IAJC-ISAM International Conference
ISBN 978-1-60643-379-9
variable Type Difference
(I-J) Error
Confidence
Interval
Lower
Bound
Upper
Bound
Tuke
y
HSD
Inlet
velocity
20° Outlet
Velocity -3.52400* .631 .00 -5.17 -1.88
30° Outlet
Velocity -3.58867* .631 .00 -5.23 -1.94
35° Outlet
Velocity -5.98333* .631 .00 -7.63 -4.34
20° Outlet
Velocity
Inlet
velocity 3.52400* .631 .00 1.88 5.17
30° Outlet
Velocity -.06467 .631 .00 -1.71 1.58
35° Outlet
Velocity -2.45933* .631 .00 -4.10 -0.82
30° Outlet
Velocity
Inlet
velocity 3.58867* .631 .00 1.94 5.23
20° Outlet
Velocity .06467 .631 .00 -1.58 1.71
35° Outlet
Velocity -2.39467* .631 .00 -4.04 -0.75
35° Outlet
Velocity
Inlet
velocity 5.98333* .631 .00 4.34 7.63
20° Outlet
Velocity 2.45933* .631 .00 0.82 4.10
30° Outlet
Velocity 2.39467* .631 .00 0.75 4.04
Conclusion
The purpose of this study was to investigate the optimal design for custom constructed wind
augmentation devices. The authors developed three designs with various inlet angles 20°, 30°
and 35° repectively for comparing wind flow efficiency.One way ANOVA test resulted that
the 350 degree angled shroud amplified wind velocity significantly compared to the inlet
wind velocity of the shroud. Moreover, the 350 degree shroud was the most efficient with the
highest mean values of wind speeds at the exit of the shroud. In terms of efficiency of
velocities at the exit of the shroud, 35° shroud was followed by 30° and 20° respectively.
Proceedings of The 2016 IAJC-ISAM International Conference
ISBN 978-1-60643-379-9
⊘ This is a preview!⊘
Do you want full access?
Subscribe today to unlock all pages.
Trusted by 1+ million students worldwide
References
[1] Ming-Shun Lu; Chung-Liang Chang; Wei-Jen Lee; Li Wang. IAS '08. IEEE.
Industry Applications Society Annual Meeting, 2008. DOI:10.1109/08IAS.2008.139
[2] Dakeev, U. (2016). Comparative Study of custom-constructed Wind Augmentation
Shrouds on a small-scale Wind Turbine. American Society for Engineering
Education.
[3] Iowa Energy Center- Wind Speed and power
http://www.iowaenergycenter.org/wind-energy-manual/wind-and-wind-power/wind-
speed-and-power/
[4] Dennis Y.C. Leung; GiorgiaCaramanna; M. Mercedes Maroto-Valer, Received 20
January 2014, Revised 27 May 2014, Accepted 7 July 2014, Available online 2
August 2014; doi:10.1016/j.rser.2014.07.093
[5] NOAA, National oceanic and atmospheric administration,
http://www.esrl.noaa.gov/gmd/ccgg/trends〉; 2013.
[6] Jiuping Xu; Li Li; Bobo Zheng, Accepted 27 December 2015, Available online 22
January 2016', doi:10.1016/j.rser.2015.12.271
[7] http://www2.hawaii.edu/~dsnellin/100/Researchpaper.html
[8] Afnan Mahmood Freije; Tahani Hussain; Eman Ali Salman , Global warming
awareness among the University of Bahrain science students, 23 February 2016,
doi:10.1016/j.jaubas.2016.02.002
[9] Global Wind Energy Council (GWEC), Global Statistics (2014) last accessed January
15, 2015 http://www.gwec.net/global-figures/graphs
[10] Morris, C., German power prices negative over the weekend, January 15, 2015,
http://energytransition.de/2014/05/german-power-prices-negative-over-weekend/.
[11] Wenyi Liu; Design and kinetic analysis of wind turbine blade-hub-tower coupled
system, 21 March 2016, doi:10.1016/j.renene.2016.03.068.
[12] J.O. Ojosu, R.I. Salawu, An evaluation of wind energy potential as a power
generation source in Nigeria, 3 November 1989, doi:10.1016/0741-983X(90)90041-
Y
[13] D.G. Phillips, An investigation on diffuser augmented wind turbine design (Ph.D.
thesis), The University of Auckland (2003), http://hdl.handle.net/2292/1940
[14] Chipo Shonhiwa; Golden Makaka, Concentrator Augmented Wind Turbines: A
review, 13 January 2016, doi:10.1016/j.rser.2016.01.067
Proceedings of The 2016 IAJC-ISAM International Conference
ISBN 978-1-60643-379-9
Paraphrase This Document
Need a fresh take? Get an instant paraphrase of this document with our AI Paraphraser
Biographies
Dr. ULAN DAKEEV is an Assistant Professor in Industrial Technology Department in the
College of Engineering, Texas A&M University - Kingsville. His areas of research include
renewable energy (wind energy), quality in higher education, motivation, and engagement of
students. Dr. Ulan Dakeev may be reached at Ulan.dakeev@tamuk.edu
Dr. FARZIN HEIDARI currently serves as Associate Professor of industrial management
and technology at Texas A&M University, Kingsville. Dr. Heidari has 26 years of
experience in manufacturing and CAD/CAM/CNC courses. He is currently serving as the
Graduate Coordinator for the Industrial Management program. Dr. Farzin Heidari may be
reached at farzin.heidari@tamuk.edu
BIJAPUR MOHAMMAD MUSTAQ is currently pursuing masters' degree from Texas A&M
University Kingsville in the department of Industrial Management & Technology. Having
his undergraduate degree in mechanical engineering from Jawaharlal Nehru Technological
University, strong determination and curiosity in learning new technologies paved path for
immense interest in research and development in the areas of engineering. His present job
role as a Graduate Research Assistant in the department of Industrial Management &
Technology in Texas A&M University Kingsville provided an opportunity to do research in
the areas of Renewable energy and best optimal wind turbine technologies for power
generation. Bijapur Mohammad Mustaq can be reached at
mohammad.bijapur@students.tamuk.edu.
SUMANTH YANAMALA is the currently a Graduate Teaching Assistant for Industrial
Management and Technology at Texas A&M University Kingsville. He earned his B.E
degree in Civil Engineering from Jawaharlal Nehru Technological University, Hyderabad,
India. His interests include renewable energy, wind energy, sustainability. Sumanth
Yanamala can be reached at sumanth.yanamala@students.tamuk.edu.
Proceedings of The 2016 IAJC-ISAM International Conference
ISBN 978-1-60643-379-9
1 out of 8
Related Documents


Your All-in-One AI-Powered Toolkit for Academic Success.
+13062052269
info@desklib.com
Available 24*7 on WhatsApp / Email
![[object Object]](/_next/static/media/star-bottom.7253800d.svg)
Unlock your academic potential
Copyright © 2020–2026 A2Z Services. All Rights Reserved. Developed and managed by ZUCOL.