Depreciation Methods Comparison: Straight-Line, Diminishing, and Units

Verified

Added on  2023/06/03

|5
|559
|74
Homework Assignment
AI Summary
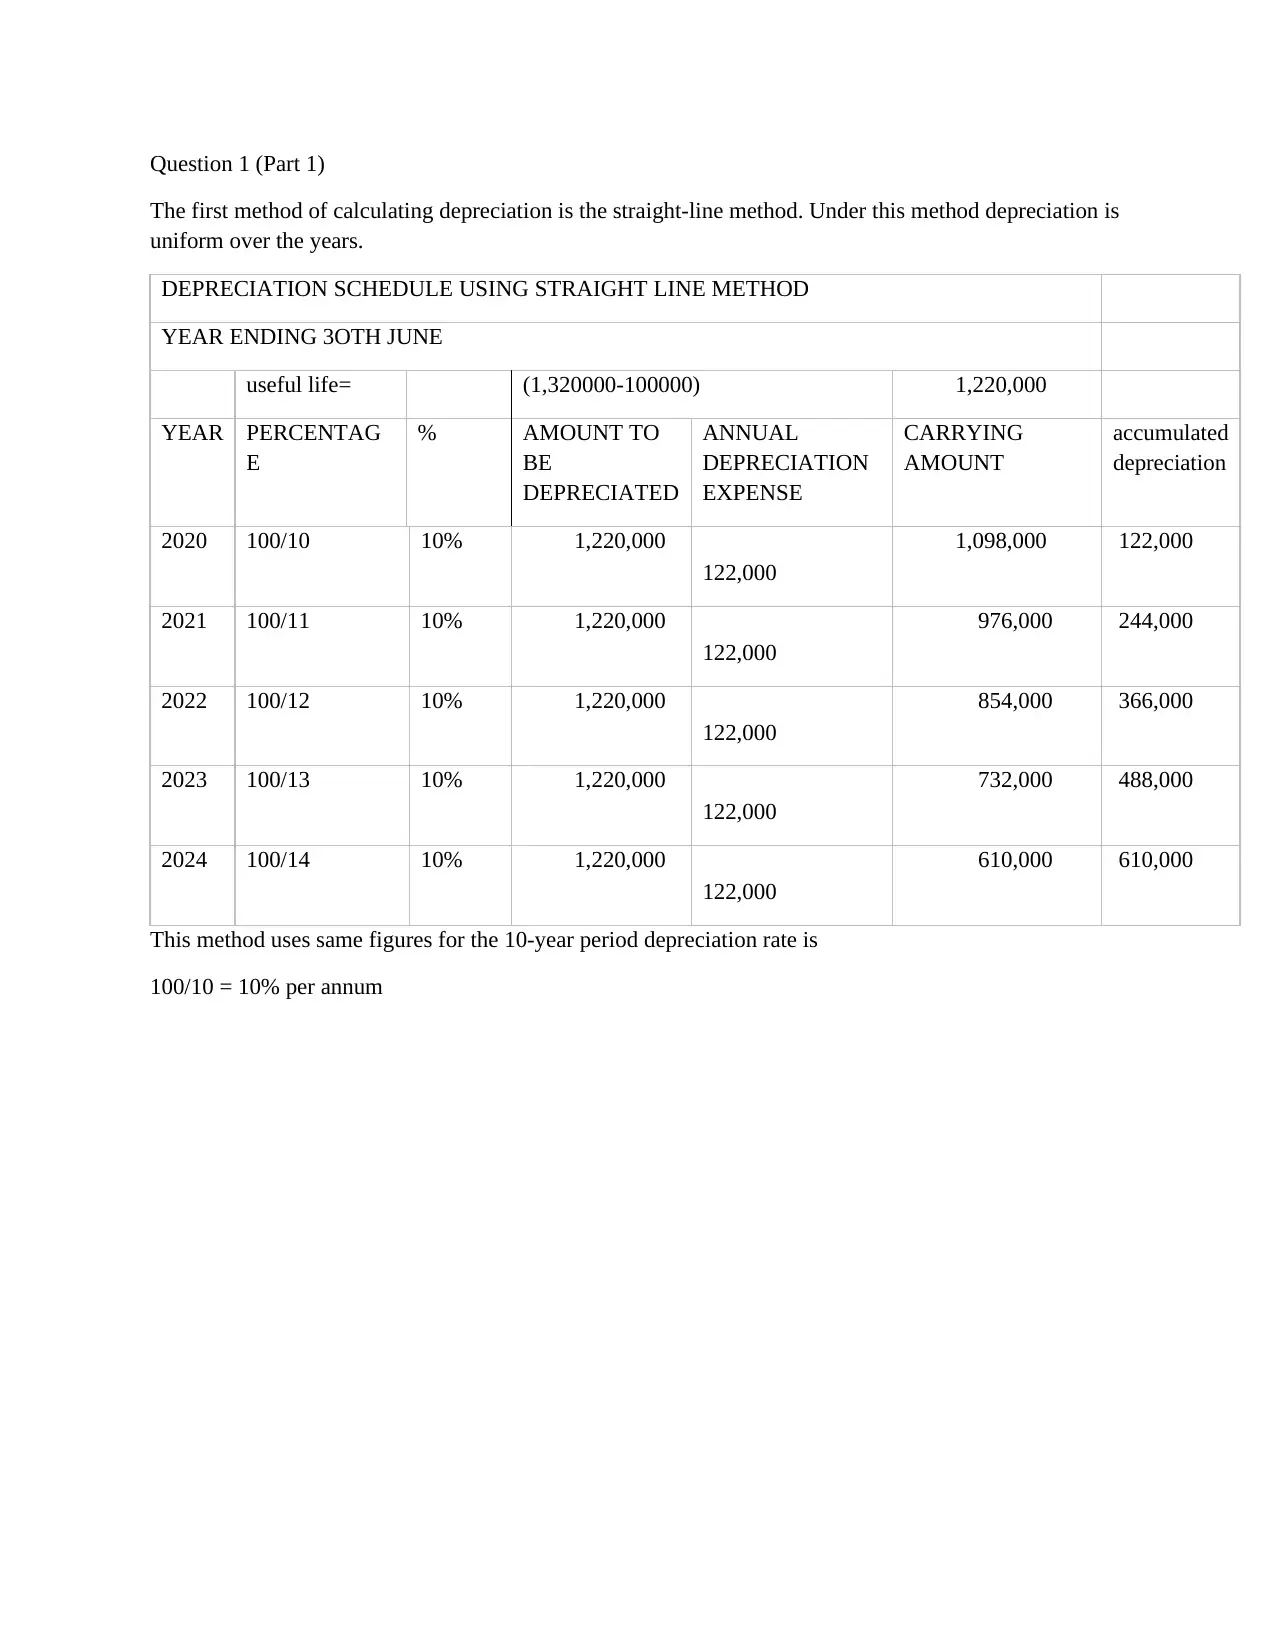
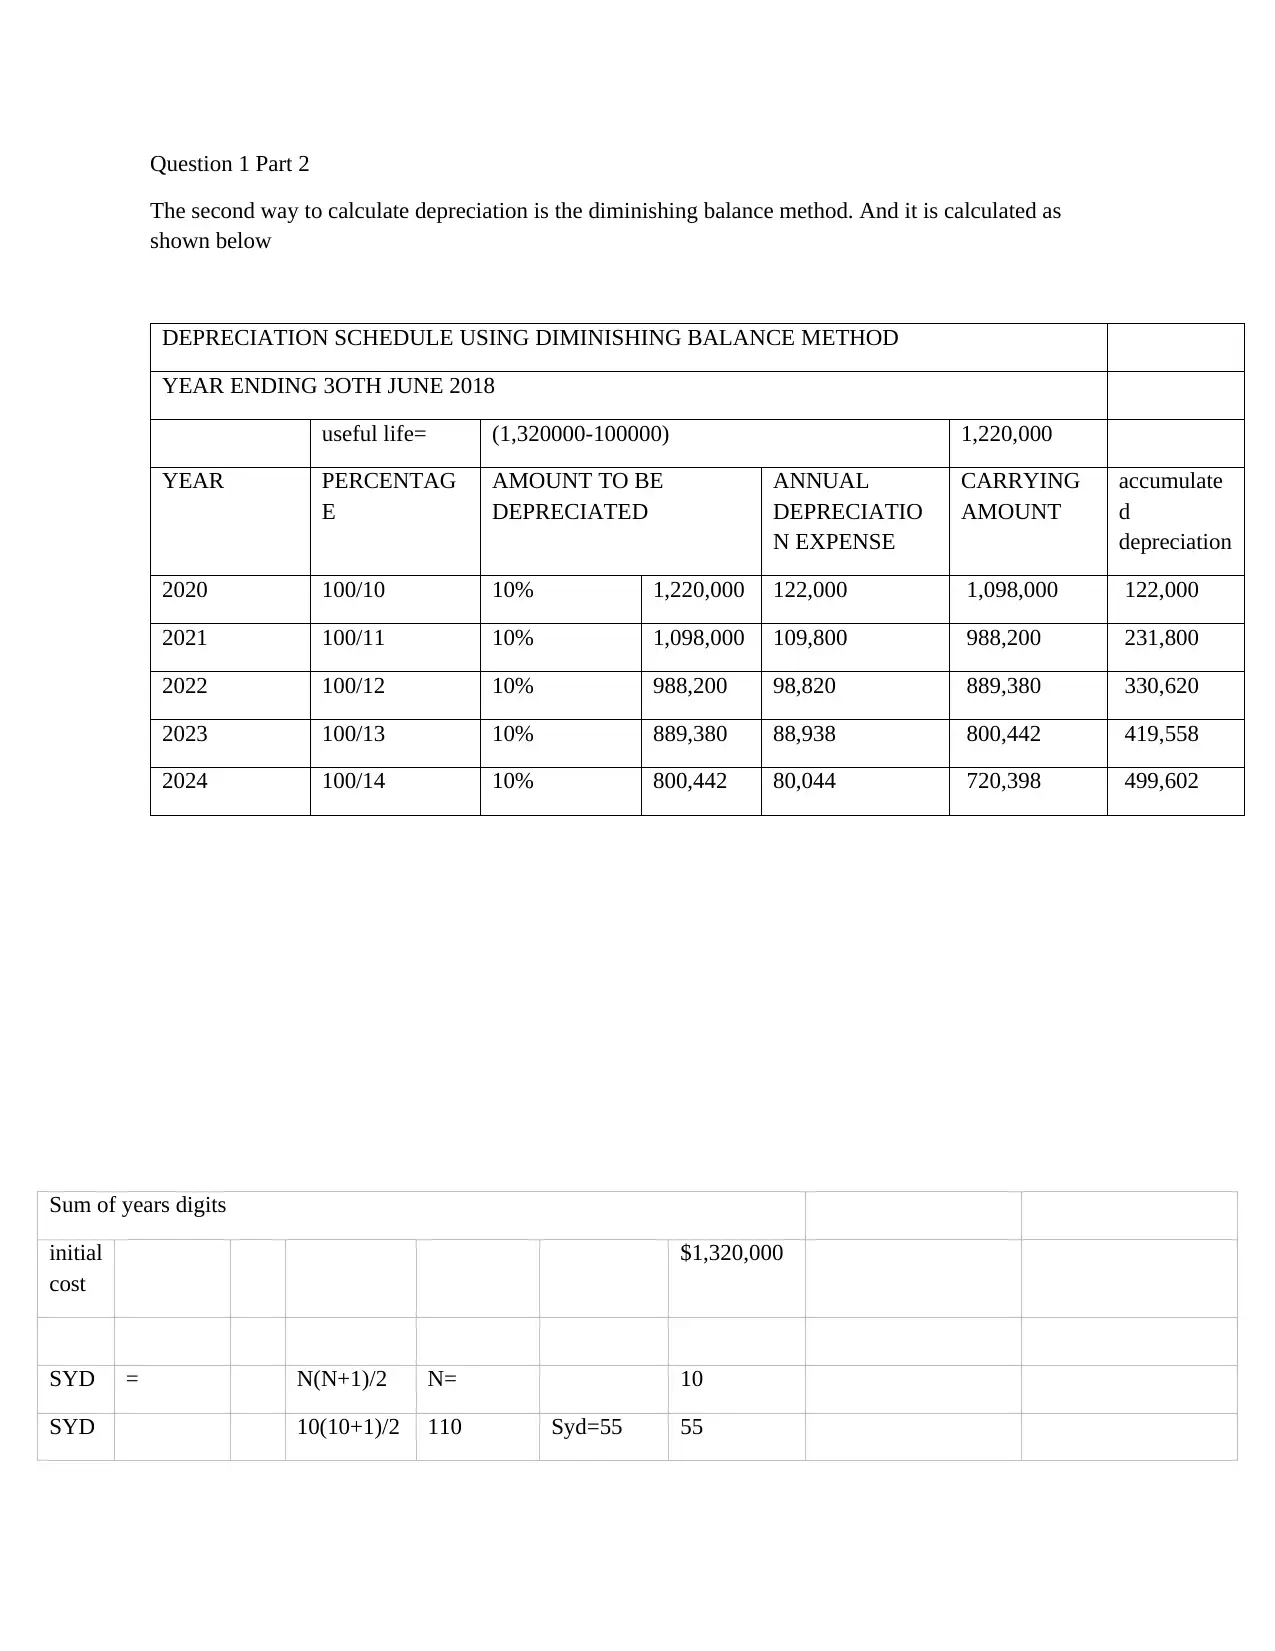
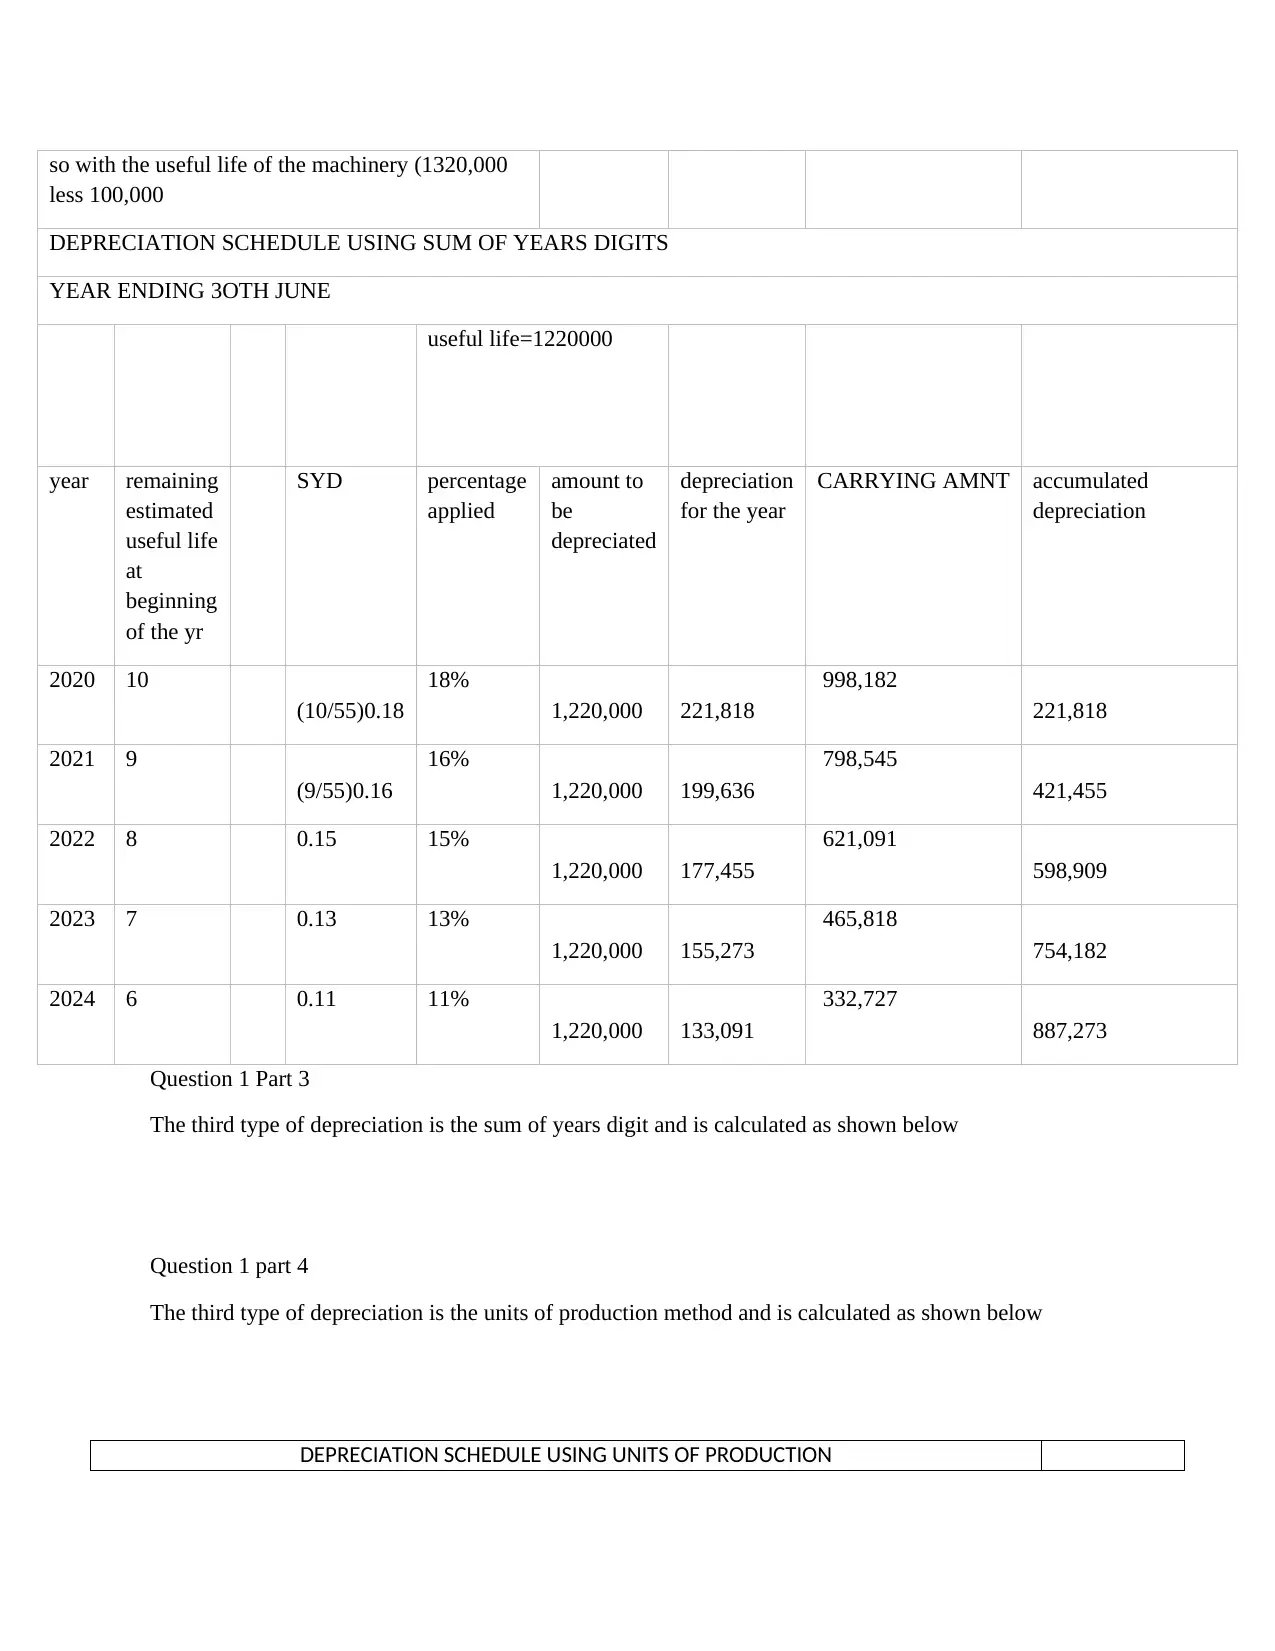
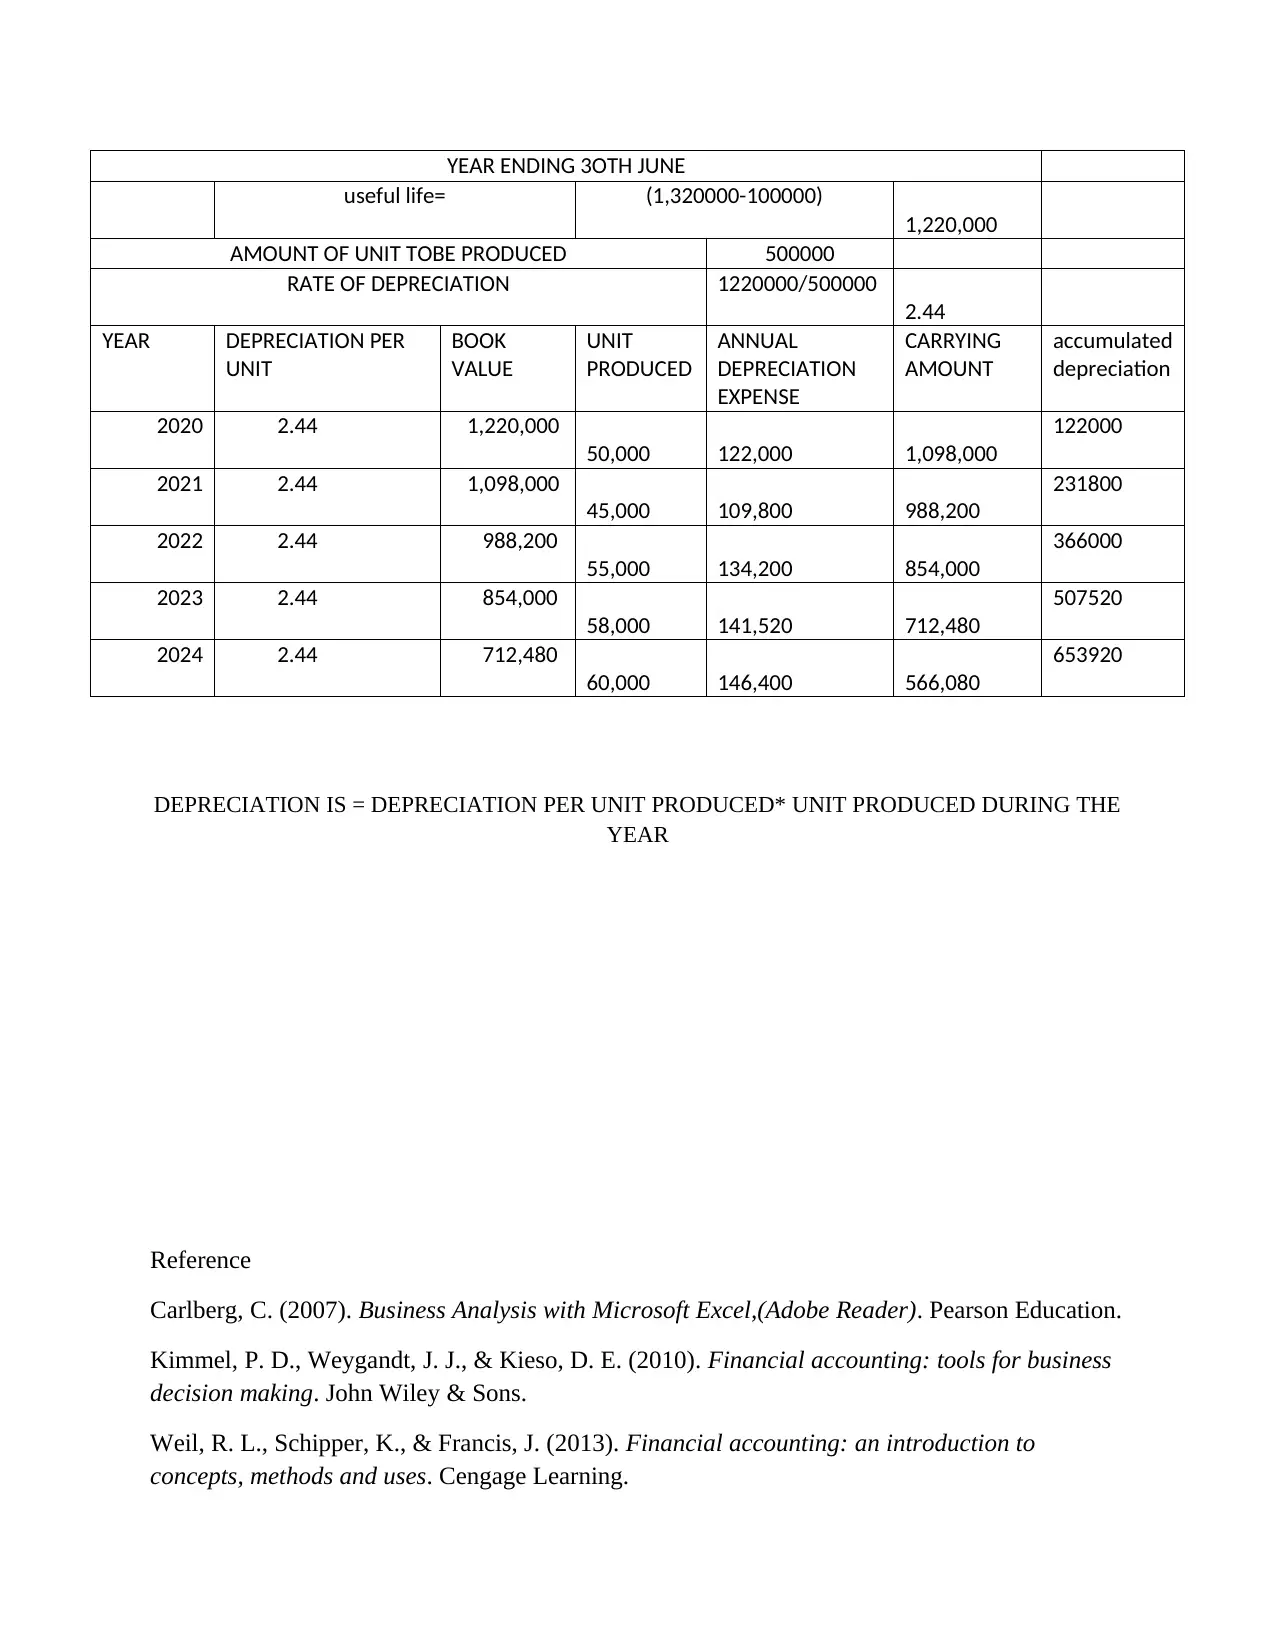
This assignment solution provides a detailed analysis and comparison of various depreciation methods used in financial accounting. It includes calculations and depreciation schedules for the straight-line method, diminishing balance method, sum of the years' digits method, and units of production method. Each method is illustrated with numerical examples, demonstrating how to calculate annual depreciation expense and carrying amounts over the asset's useful life. The solution references established financial accounting resources, providing a comprehensive overview of depreciation techniques.
tabler-icon-diamond-filled.svg

Contribute Materials

Your contribution can guide someone’s learning journey. Share your documents today.
Document Page
Question 1 (Part 1)
The first method of calculating depreciation is the straight-line method. Under this method depreciation is
uniform over the years.
DEPRECIATION SCHEDULE USING STRAIGHT LINE METHOD
YEAR ENDING 3OTH JUNE
useful life= (1,320000-100000) 1,220,000
YEAR PERCENTAG
E
% AMOUNT TO
BE
DEPRECIATED
ANNUAL
DEPRECIATION
EXPENSE
CARRYING
AMOUNT
accumulated
depreciation
2020 100/10 10% 1,220,000
122,000
1,098,000 122,000
2021 100/11 10% 1,220,000
122,000
976,000 244,000
2022 100/12 10% 1,220,000
122,000
854,000 366,000
2023 100/13 10% 1,220,000
122,000
732,000 488,000
2024 100/14 10% 1,220,000
122,000
610,000 610,000
This method uses same figures for the 10-year period depreciation rate is
100/10 = 10% per annum
tabler-icon-diamond-filled.svg

Secure Best Marks with AI Grader

Need help grading? Try our AI Grader for instant feedback on your assignments.
Document Page
Question 1 Part 2
The second way to calculate depreciation is the diminishing balance method. And it is calculated as
shown below
DEPRECIATION SCHEDULE USING DIMINISHING BALANCE METHOD
YEAR ENDING 3OTH JUNE 2018
useful life= (1,320000-100000) 1,220,000
YEAR PERCENTAG
E
AMOUNT TO BE
DEPRECIATED
ANNUAL
DEPRECIATIO
N EXPENSE
CARRYING
AMOUNT
accumulate
d
depreciation
2020 100/10 10% 1,220,000 122,000 1,098,000 122,000
2021 100/11 10% 1,098,000 109,800 988,200 231,800
2022 100/12 10% 988,200 98,820 889,380 330,620
2023 100/13 10% 889,380 88,938 800,442 419,558
2024 100/14 10% 800,442 80,044 720,398 499,602
Sum of years digits
initial
cost
$1,320,000
SYD = N(N+1)/2 N= 10
SYD 10(10+1)/2 110 Syd=55 55
Document Page
so with the useful life of the machinery (1320,000
less 100,000
DEPRECIATION SCHEDULE USING SUM OF YEARS DIGITS
YEAR ENDING 3OTH JUNE
useful life=1220000
year remaining
estimated
useful life
at
beginning
of the yr
SYD percentage
applied
amount to
be
depreciated
depreciation
for the year
CARRYING AMNT accumulated
depreciation
2020 10
(10/55)0.18
18%
1,220,000 221,818
998,182
221,818
2021 9
(9/55)0.16
16%
1,220,000 199,636
798,545
421,455
2022 8 0.15 15%
1,220,000 177,455
621,091
598,909
2023 7 0.13 13%
1,220,000 155,273
465,818
754,182
2024 6 0.11 11%
1,220,000 133,091
332,727
887,273
Question 1 Part 3
The third type of depreciation is the sum of years digit and is calculated as shown below
Question 1 part 4
The third type of depreciation is the units of production method and is calculated as shown below
DEPRECIATION SCHEDULE USING UNITS OF PRODUCTION
Document Page
YEAR ENDING 3OTH JUNE
useful life= (1,320000-100000)
1,220,000
AMOUNT OF UNIT TOBE PRODUCED 500000
RATE OF DEPRECIATION 1220000/500000
2.44
YEAR DEPRECIATION PER
UNIT
BOOK
VALUE
UNIT
PRODUCED
ANNUAL
DEPRECIATION
EXPENSE
CARRYING
AMOUNT
accumulated
depreciation
2020 2.44 1,220,000
50,000 122,000 1,098,000
122000
2021 2.44 1,098,000
45,000 109,800 988,200
231800
2022 2.44 988,200
55,000 134,200 854,000
366000
2023 2.44 854,000
58,000 141,520 712,480
507520
2024 2.44 712,480
60,000 146,400 566,080
653920
DEPRECIATION IS = DEPRECIATION PER UNIT PRODUCED* UNIT PRODUCED DURING THE
YEAR
Reference
Carlberg, C. (2007). Business Analysis with Microsoft Excel,(Adobe Reader). Pearson Education.
Kimmel, P. D., Weygandt, J. J., & Kieso, D. E. (2010). Financial accounting: tools for business
decision making. John Wiley & Sons.
Weil, R. L., Schipper, K., & Francis, J. (2013). Financial accounting: an introduction to
concepts, methods and uses. Cengage Learning.
tabler-icon-diamond-filled.svg

Secure Best Marks with AI Grader

Need help grading? Try our AI Grader for instant feedback on your assignments.
Document Page
chevron_up_icon
1 out of 5
circle_padding
hide_on_mobile
zoom_out_icon
logo.png

Your All-in-One AI-Powered Toolkit for Academic Success.

Available 24*7 on WhatsApp / Email

[object Object]