Statistics Problems: Comparing Return Data from Newbury and Dedham
VerifiedAdded on 2021/05/31
|6
|792
|137
Homework Assignment
AI Summary
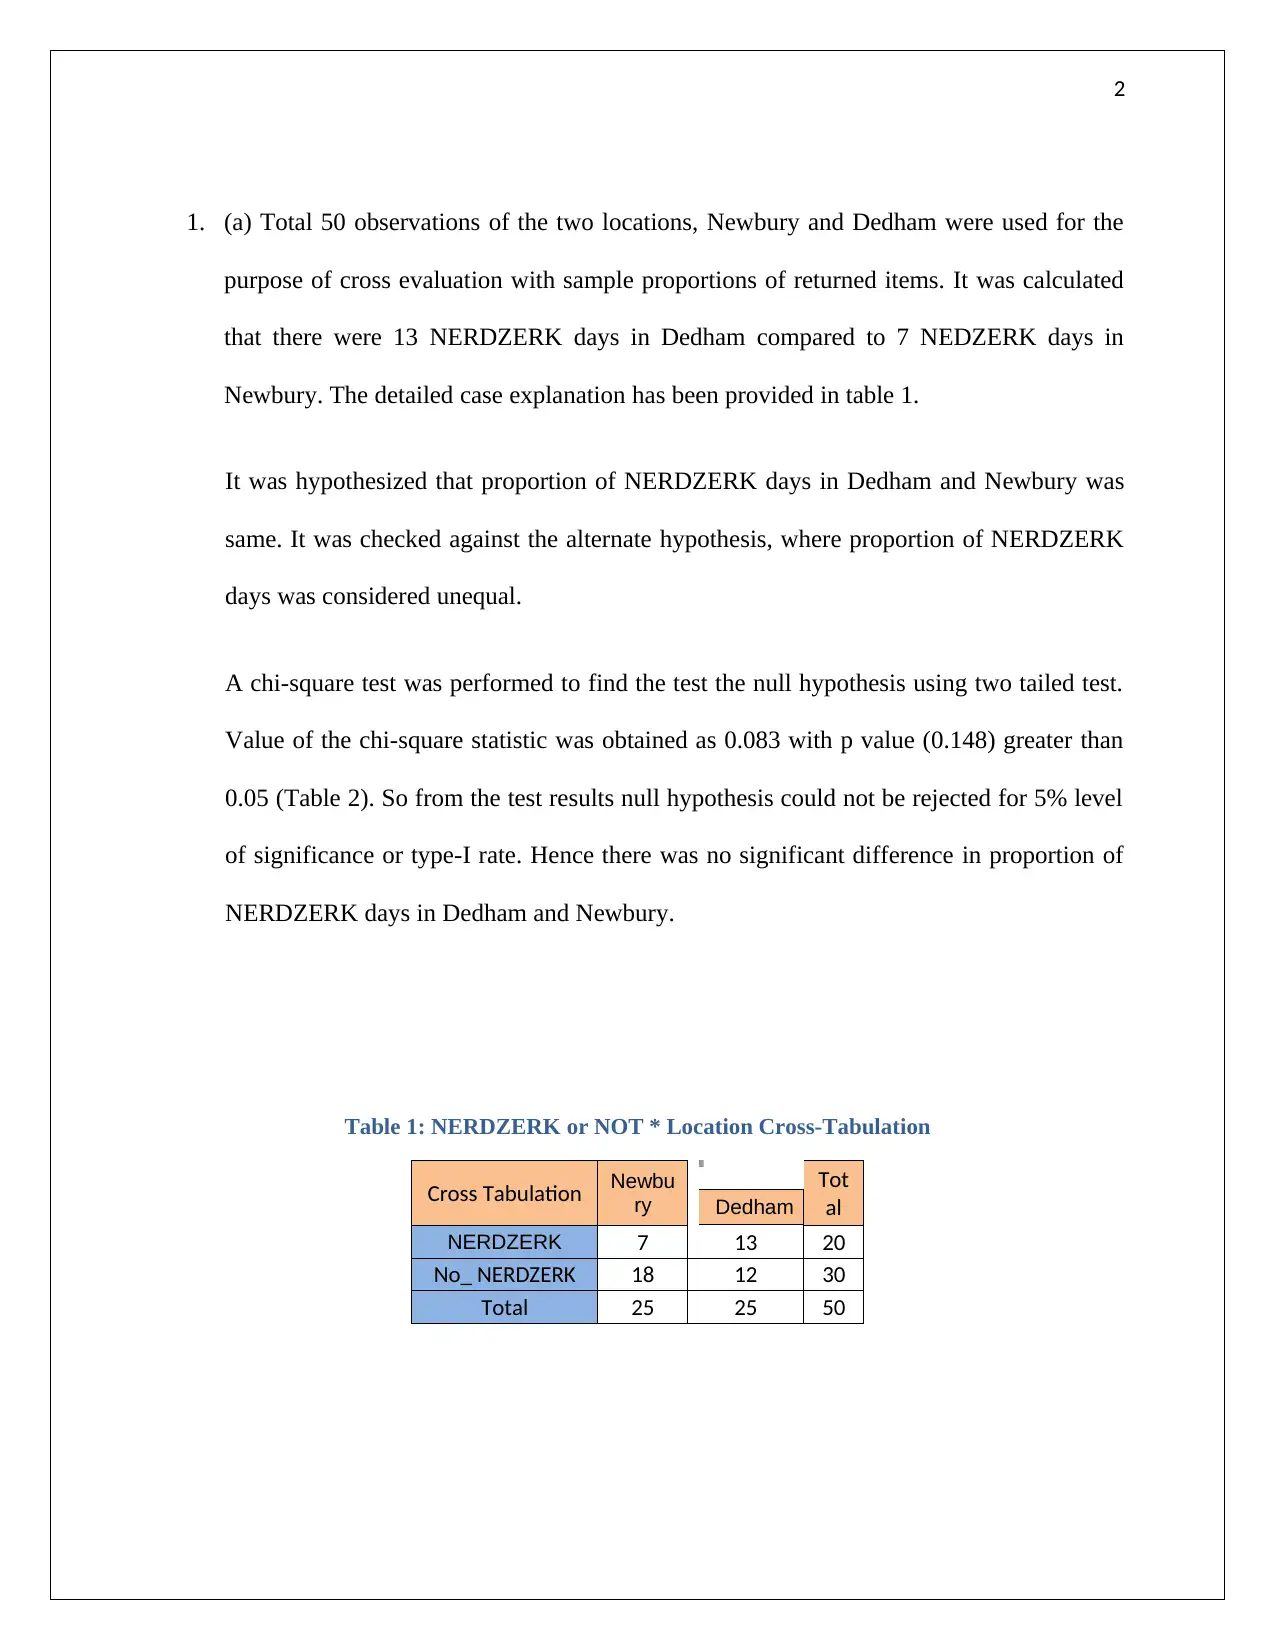
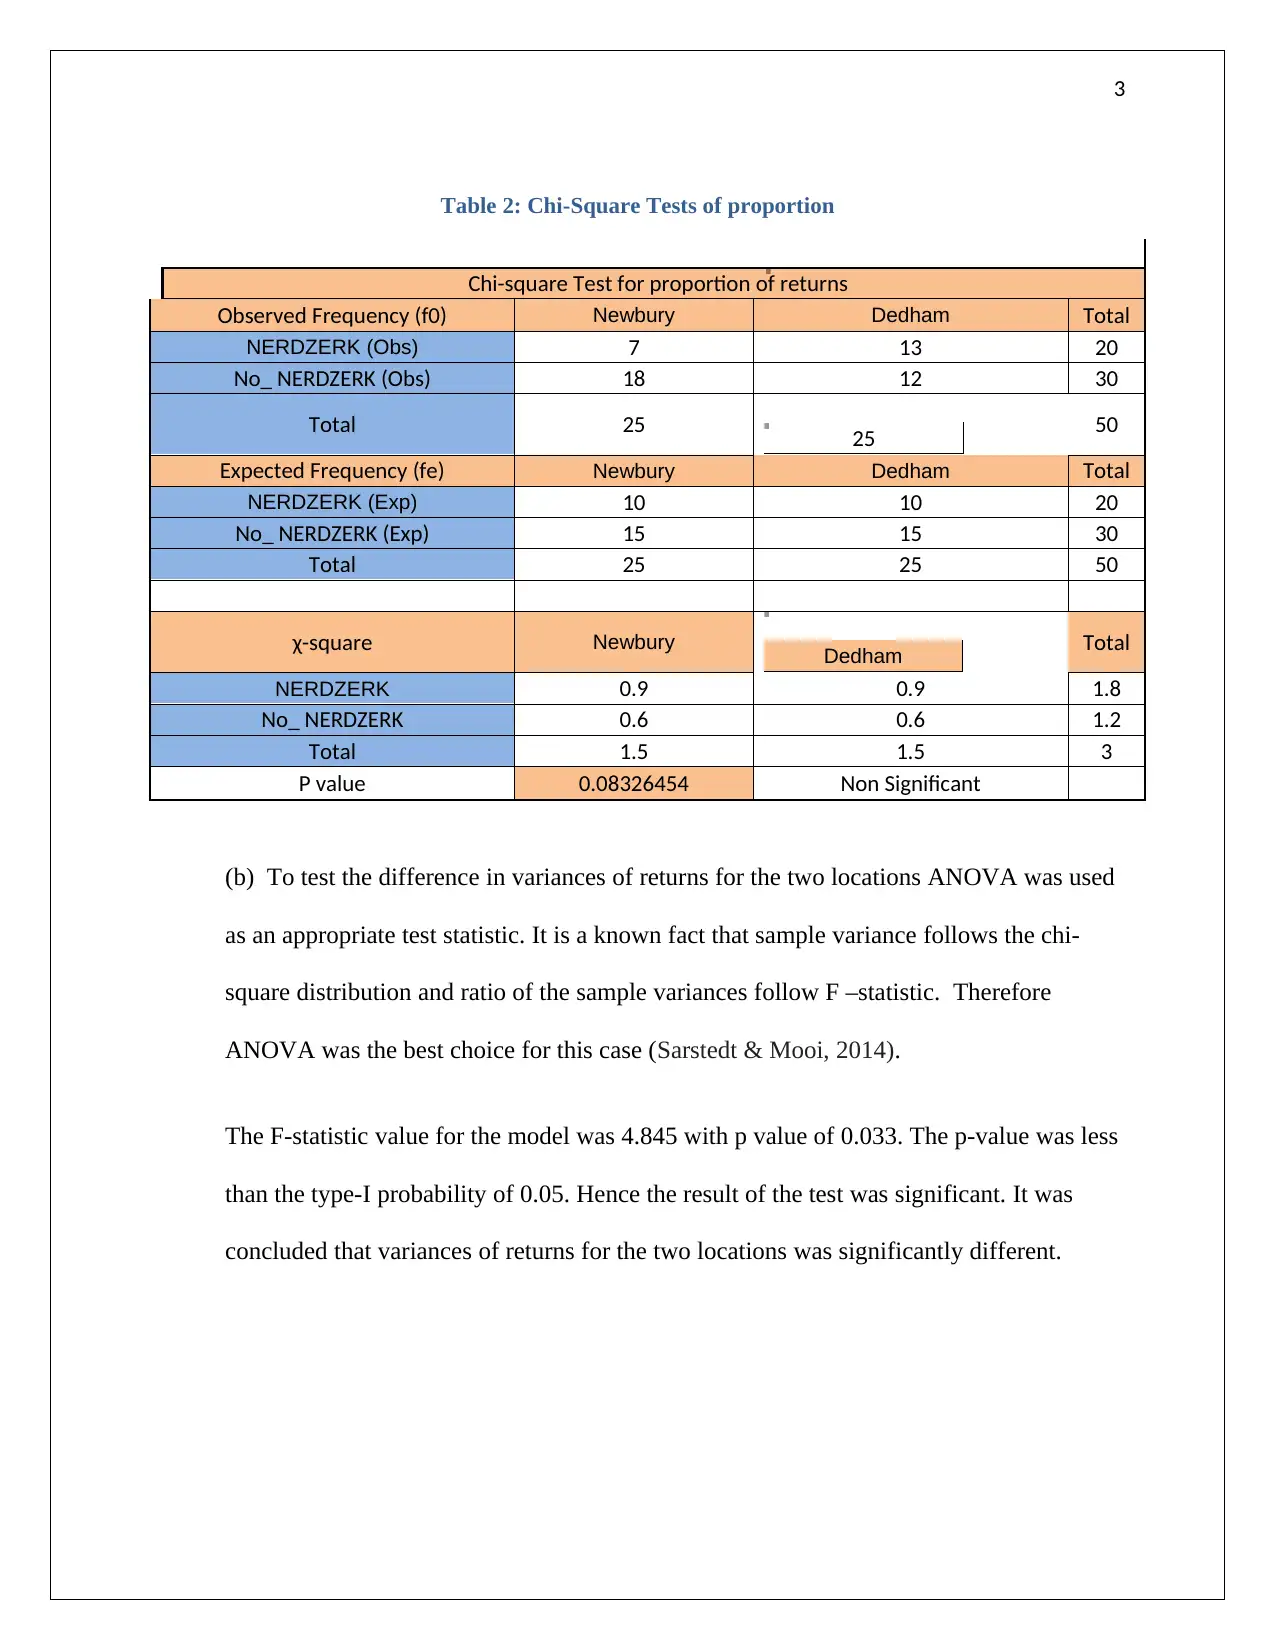
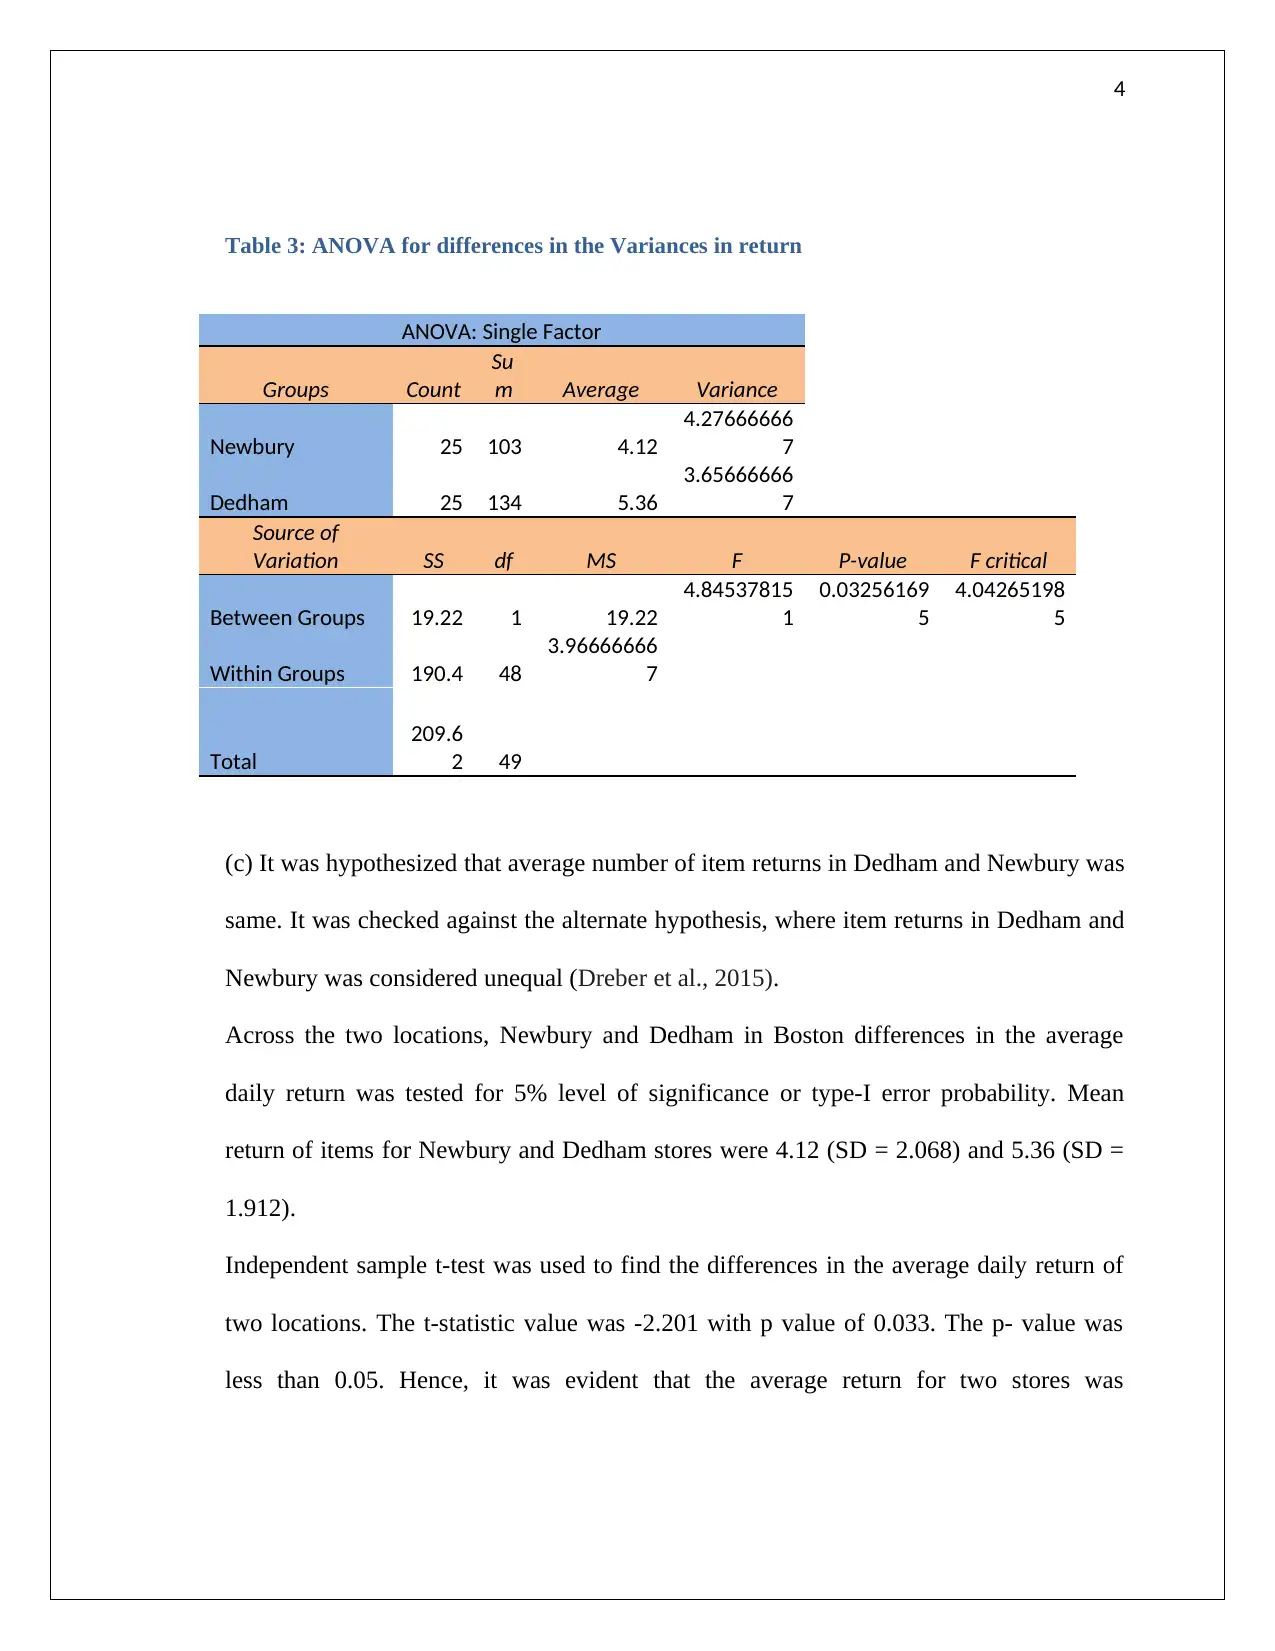
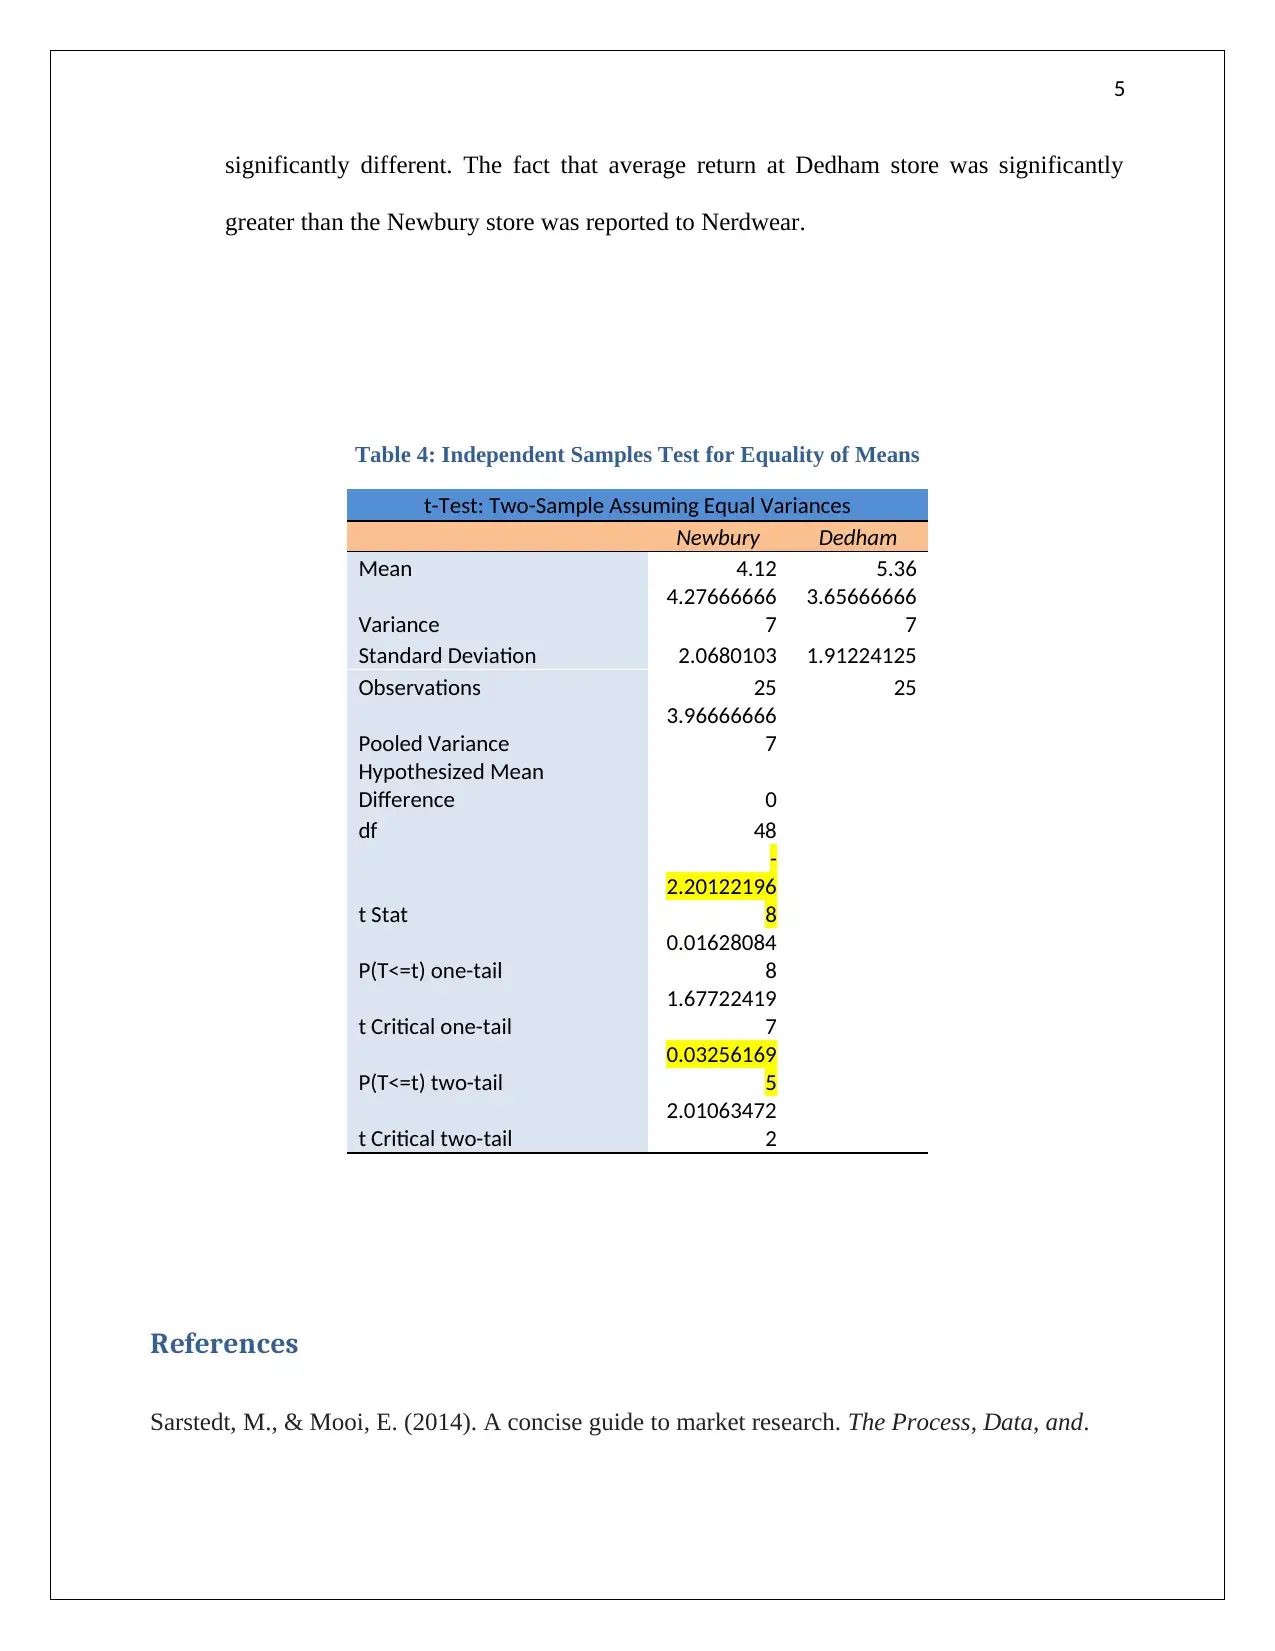
This homework assignment presents a student's statistical analysis of item return data from two locations, Newbury and Dedham. The analysis includes three parts: a chi-square test to compare the proportion of NERDZERK days, an ANOVA test to assess the difference in variances of returns, and an independent samples t-test to compare the average number of item returns. The student performed these tests at a 5% significance level, interpreting p-values and drawing conclusions about the differences in return patterns between the two locations. The results indicated no significant difference in the proportion of NERDZERK days, but significant differences in the variances and average returns, with Dedham having a significantly higher average return. The assignment includes detailed tables of observed and expected frequencies, ANOVA results, and t-test outputs, along with relevant references. This analysis provides insights into the return behavior at the two stores.


1 out of 6
Related Documents


Your All-in-One AI-Powered Toolkit for Academic Success.
+13062052269
info@desklib.com
Available 24*7 on WhatsApp / Email
![[object Object]](/_next/static/media/star-bottom.7253800d.svg)
Copyright © 2020–2026 A2Z Services. All Rights Reserved. Developed and managed by ZUCOL.