A Comparison of the Validity of Three Maximal Oxygen Uptake Tests
VerifiedAdded on 2023/06/11
|16
|4022
|133
Report
AI Summary
This research report compares the validity of three maximal oxygen uptake tests: submaximal cycle test, Cooper walk-run test, and multistage shuttle run test (MST). Conducted on 30 participants, the study analyzes data collected over four years (2014-2017). The tests assess maximum oxygen uptake (VO2max) using a cycle ergometer, comparing predicted values from linear extrapolation, MST, and the Cooper test against direct measurements. Results indicate that the Cooper test is the most effective predictor of VO2max, while MST and predicted L/E tend to underestimate cycle ergometer values. Statistical analysis includes regression assessments and correlation coefficients to determine the validity of each test. The study concludes that the Cooper test is the most reliable among the three for predicting VO2.
Maximal Oxygen Uptake Tests 1
COMPARISON OF VALIDITY OF THREE MAXIMAL OXYGEN UPTAKE TESTS
By (Name)
The Name of the Class (Course)
Professor (Tutor)
The Name of the School (University)
The City and State where it is located
The Date
COMPARISON OF VALIDITY OF THREE MAXIMAL OXYGEN UPTAKE TESTS
By (Name)
The Name of the Class (Course)
Professor (Tutor)
The Name of the School (University)
The City and State where it is located
The Date
Paraphrase This Document
Need a fresh take? Get an instant paraphrase of this document with our AI Paraphraser
Maximal Oxygen Uptake Tests 2
Comparison of Validity of Three Maximal Oxygen Uptake Tests
Abstract
The central purpose of this research study is to compare the validity of three oxygen
uptake tests namely: submaximal cycle test, Copper walk run test, and multistage shuttle run test.
The three tests will be used to assess maximum oxygen uptake when subjects are using a cycle
ergometer. According, three predict test were performed that involved: linear extrapolation of
participants heart rate of VO2 that is derived from the observed submaximal cycle ergometer test,
a multistage progressive shuttle run test (MST), and Cooper walk-run test. This assessment were
performed on 30 participants across four years from 2014 to 2017.The average age and body
mass of participants was roughly 23 years of age and 71 kilograms respectively. These results
were compared to the direct findings recorded on a maximal cycle ergometer test (Nguyen, et al.,
2013). Majority of the participants are either athletes or perform exercise activities regularly.
The mean (standard deviation) associated with different tests in terms of ml.kg-1.min-1
were observed as follows: Cooper test 65.6 (12.4), MST 57.8 (7.8), predicted L/E 55 (6.5), and
maximal cycle ergometer 63.4 (9.3). The correlation results between different tests was also
presented; for instance, the copper test registered the following correlation results with maximal
cycle ergometer test (0.88), MST (0.82), and predicted L/E (0.75). In all occasions, the MST and
predicted L/E test under-estimated the cycle ergometer value. The results indicated that MST
was 3.9 ml.kg-1.min-1 lower than cycle ergometer VO2max, while Predicted L/E was 6.6 ml.kg-
1.min-1 lower than cycle ergometer VO2max. The conclusion drawn in this study is that the Cooper
test is the most effective predictor of VO2 of the three tests assessed in the entire paper (Nguyen,
et al., 2013).
Maximal Oxygen Uptake Tests 3
Introduction
Maximum oxygen uptake also referred to as Aerobic power (VO2) is used to reference
the maximum rate of oxygen consumption. Aerobic power is normally used as measure of
aerobic or cardio-respiratory fitness. Due to the expensive nature of VO2 computation with
regard to cost and time spent on precise gas assessment; several predictive tests have been
developed to aid in analysis of aerobic fitness. There are several tests that include performance-
centric measures such as walking or running for a prescribed time frame, conducting a multistage
progressive test (MST) which is characterised by speed increment every 2 minutes. During all
these activities measurements of heart rate are take and extrapolated in order to come up with
maximum heart rate that is then used to tabulate VO2max (Nguyen, et al., 2013). The MST and
Cooper test are considered to be the most effective when tackling a large group of participants;
since, the two are maximal in nature they are flawed because they create potential health
problems.
Moreover, both test demand complete dedication and motivation on the participants' part
for them to provided truly maximal effort in the different activities/workload. On the other hand,
a submaximal test on a cycle ergometer does not require participants to give their all, but it is
time consuming. Numerous studies have assessed the validity of the Copper, linear extrapolation,
and MST separate but very few studies have compared the three tests within the same
population. The major limitation observed in previous studies is the fact that correlation was only
drawn between the direct measurement and the predicted score. Correlations are effective
assessments of validity but they do not paint a comprehensive picture of the situation. The social
aim of this study is to expound the existing knowledge on the validity of field testing. As such,
the participants will provide the data that will be analysed to provide information on the validity
⊘ This is a preview!⊘
Do you want full access?
Subscribe today to unlock all pages.
Trusted by 1+ million students worldwide
Maximal Oxygen Uptake Tests 4
of linear extrapolation, Cooper, and MST methods in the assessment of maximum oxygen uptake
(Gross, et al., 2017).
Methods
Participants
Thirty healthy university students were enrolled to take part in the data collection
exercise on a volunteer basis. All participants willingly consented to their involvement in the
study and the study was subsequently approved by the university ethics committee. The
participants was exposed to several physical and sports activities; majority of which were
endurance related with different levels of difficulty and training status to cater to the individual
skills of the subjects.
Design
Regardless of the year in which the assessment were performed (2014, 2015, 2016, or
2017), the subjects were expected to undertake four different tests across five subsequent days.
On the first day the participants were expect to perform a submaximal cycle ergometer test
followed shortly after (25-30 minutes) by a direct measurement on a cycle ergometer. These tests
were conducted first because they could be conducted in the laboratory and it was relatively
easily for the subjects' ECG results to be monitored before they were directed to more
demanding sport activities (maximal tests). The Cooper test and MST were conducted on
separate days in a non-chronological manner (to sustain randomness). The two tests were
conducted with an interval of two days. The participants were expected to register heart rate of
120-170 beats/min after a three minute warm-up. The tests considered of four submaximal
exercises conducted subsequently with each lasting five minutes; all four tests were performed
Paraphrase This Document
Need a fresh take? Get an instant paraphrase of this document with our AI Paraphraser
Maximal Oxygen Uptake Tests 5
on a Monark cycle ergometer. The cycling was conducted with regard to 60 revolutions per
minutes and the participant's heart rate was measured during the fourth and fifth minutes of the
exercise using a "ECG S&W Medical Cardio Aid" (Petrovic, 2016).
The expired air was collected from the participants shortly after their last minute of
exercise. This collection was done with the aid of a Douglas bag that was attached to a
removable rubber mouthpiece, standard tubing, and Has Rudolph 2700 Valve. The gases expired
by the subjects were examined through the use of a Taylor Servomex 02 analyzer and the PK
Morgan CO2 analyzer. The volume of the expired gas was assessed using a Parkinson Cowan
Volume meter. All the analyzers used in the testing phase were calibrated with regard to know
gas concentrations prior to the performance of the various analytical tests. VO2max was predicted
with the aid of linear extrapolation to allow for the comparison of all three assessment
techniques. Linear extrapolation was conducted as follows: the measured heart rate and
submaximal VO2 were both extrapolated to the maximum heart rate; the measured heart rate and
submaximal VO2 were both extrapolated to the predicted maximum heart rate; the measured
heart rate and submaximal VO2 were both extrapolated to the predicted maximum heart rate
(Kumar, et al., 2012).
Maximal Cycle Ergometer Test
The participants were allowed a 25 to 30 minutes break between the end of the
submaximal test and the start of the maximal cycle ergometer test. During this rest period the
participants are familiarized with the cycle ergometer; mouthpieces and nose clips were also
presented to the subjects. The maximal cycle ergometer testing protocols used in the study were
based on recommendations given by the British Association of Sports Science. Therefore, as per
Maximal Oxygen Uptake Tests 6
the specifications of the submaximal cycle ergometer test, heart rate and oxygen consumption
were assessed for each participant (Vickers, 2011).
Maximal Oxygen Uptake Test
Three parameters were employed in the assessment of VO2 and VO2max. The first
parameter is anthropometric measurement this involves the assessment of body mass using an
equipment of the same name that has an accuracy metric to the 100g and can support up to 150
kilograms. While the participants height was assessed using a stadiometer with scaling intervals
of 0.1 cm; these two variables (body mass and height) were used to compute the participants’
body mass index (Nguyen, et al., 2013). The second parameter is the “cardiopulmonary exercise
testing protocol” which demands the use of MGC spirometer. This instrument measures the
participants Oxygen Consumption (VO2), the production of carbon (iv) oxide (VCO2),
pulmonary ventilation (VE), Oxygen ventilation equivalents (VE/VO2), Carbon (iv) Oxide
(VE/VCO2), and finally respiratory exchange ratio (VCO2/VO2). The last parameter gas analysis
is more of a follow-up to the second, it involves the assessment of the concentration of oxygen
and carbon (iv) oxide being inhaled and exhaled by the participants (Nguyen, et al., 2013).
Cooper 12 Min Walk/Run Test
This test was also conducted in the same indoor sports arena, across a 234 meter long
athletics track. The warm-p exercise consisted of a combination of flexibility and aerobic
activities. The exercise required participants to run in pairs which results in 15 sets of
participants. The predicted VO2max associated with distance run by the participants within the
12min duration was assessed with regard to the Cooper table. The individuals who managed to
⊘ This is a preview!⊘
Do you want full access?
Subscribe today to unlock all pages.
Trusted by 1+ million students worldwide
Maximal Oxygen Uptake Tests 7
run more than 2 miles within the stipulated 12 minutes had their respective VO2 predicted by
introducing distance ran as an attribute in the Cooper regression equation (Adsiz, et al., 2016).
Statistical analysis
Standard computation formulas were employed in the calculation of VO2, VCO2, tidal
volume (VT), HR, respiratory frequency (f), and minute ventilation (VE) every 30 second after
every minute of exercise. The values of VE and VT were represented with regard to BTPS, while
VO and VCO2 were illustrated with adherence to STPD. The formula used in the computation of
predicted maximum/peak VO2 was “Peak VO2=0.83ht 2/7*(1-0.007age)*(1-0.25S)”. Where ht is
the height of participants in meters, S is a dummy variable for gender (S=0 for males and S=1 for
females). At the end of each exercise the participants were asked to rate their level of breathing
difficulty on the Borg Scale by pointing to the appropriate score value. The participants had been
familiarized with the Borg scale prior to the commencement of the exercise activities. The Borg
scale is used to assessment dyspnoea for each of the participant.
Predicted peak HR=210-0.65age (years)
The statistical analysis was focused on the performance of regression assessment on all
three tests namely (Cooper, MST, and Predicted L/E). The responsive variable was taken to be
the predictive test while the cycle ergometer value was employed as the explanatory variable.
For each of the three regressions the standard f-test for the slope of the line of best fit was equate
to 1 and that of intercept was equaled to 0 (this was done to do away will biasness). In order to
discern the effect of calibration, a measurement value of 60 ml.kg-1.min-1 was assigned to each
test for the purposed of cycle ergometer value calculation. A 95% confidence interval assessment
Paraphrase This Document
Need a fresh take? Get an instant paraphrase of this document with our AI Paraphraser
Maximal Oxygen Uptake Tests 8
was performed through the use following simple formula (where A=intercept, B=slope, and
S=Standard deviation of the regression) (Poole & Jones, 2012).
60− A
B ± 2 S
B
Results
The Study reveals that the mean (standard deviation) of the participants' age and body
mass were 23 year (2.4 years) and 71 kilograms (4.6 kilograms). Participants' age and body mass
intervals were 21-29 years and 64.5-94 kilograms. Table 1 indicated below contains the mean
(S.D.) for the various test in terms of ml.kg-1.min-1. The recorded maximum heart rate was
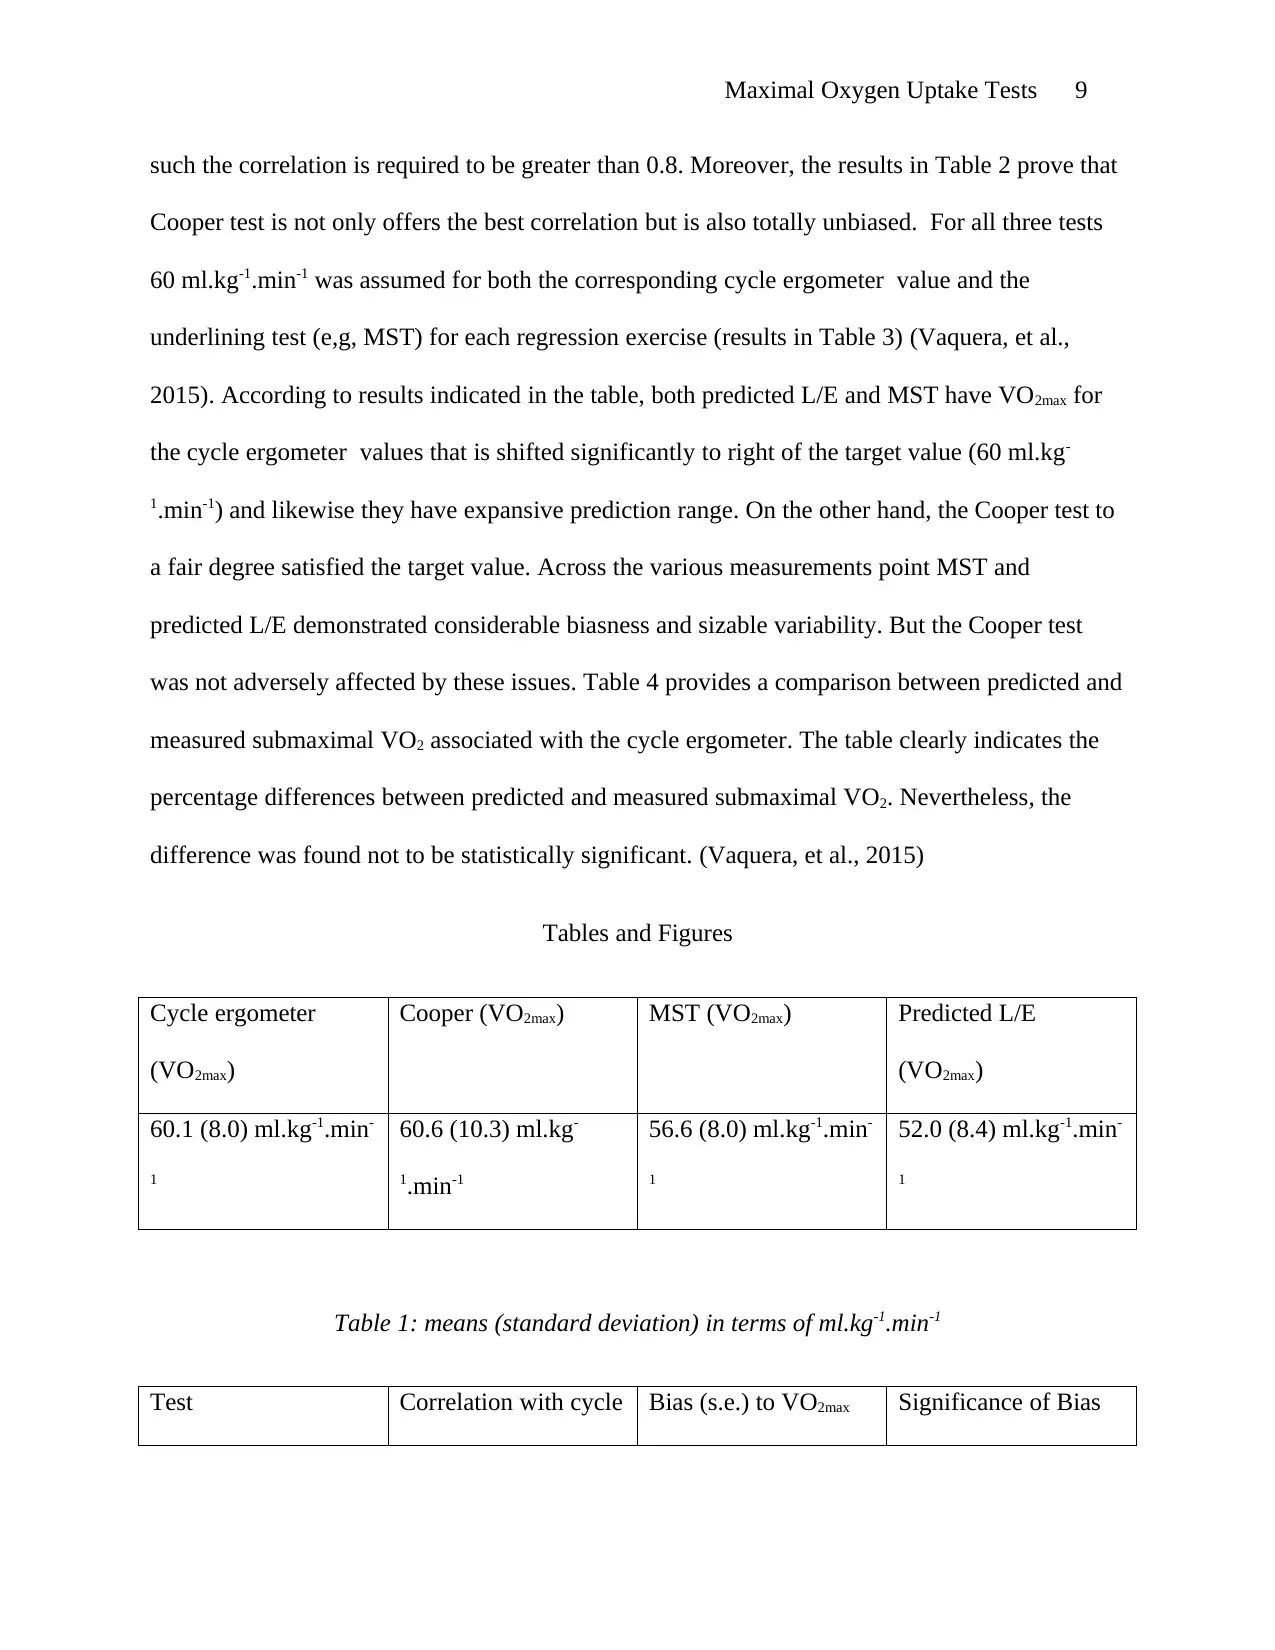
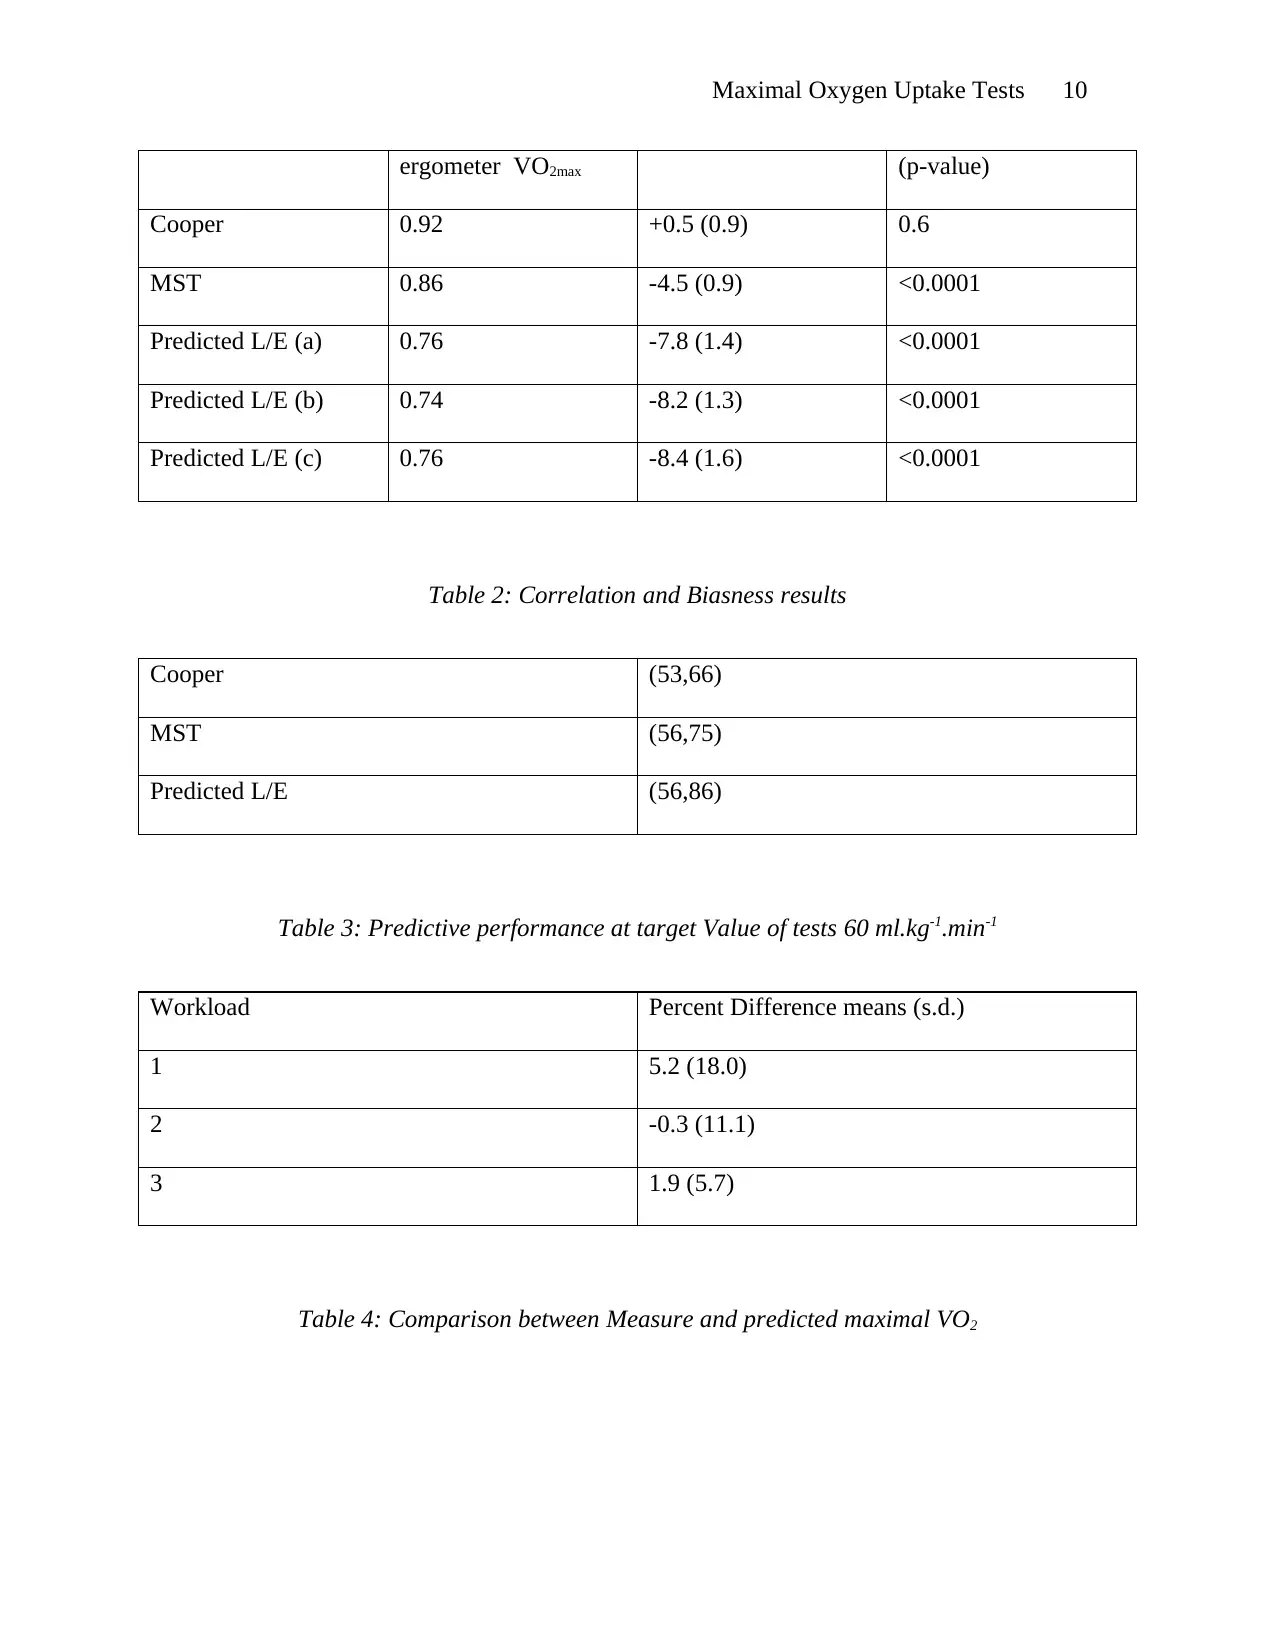
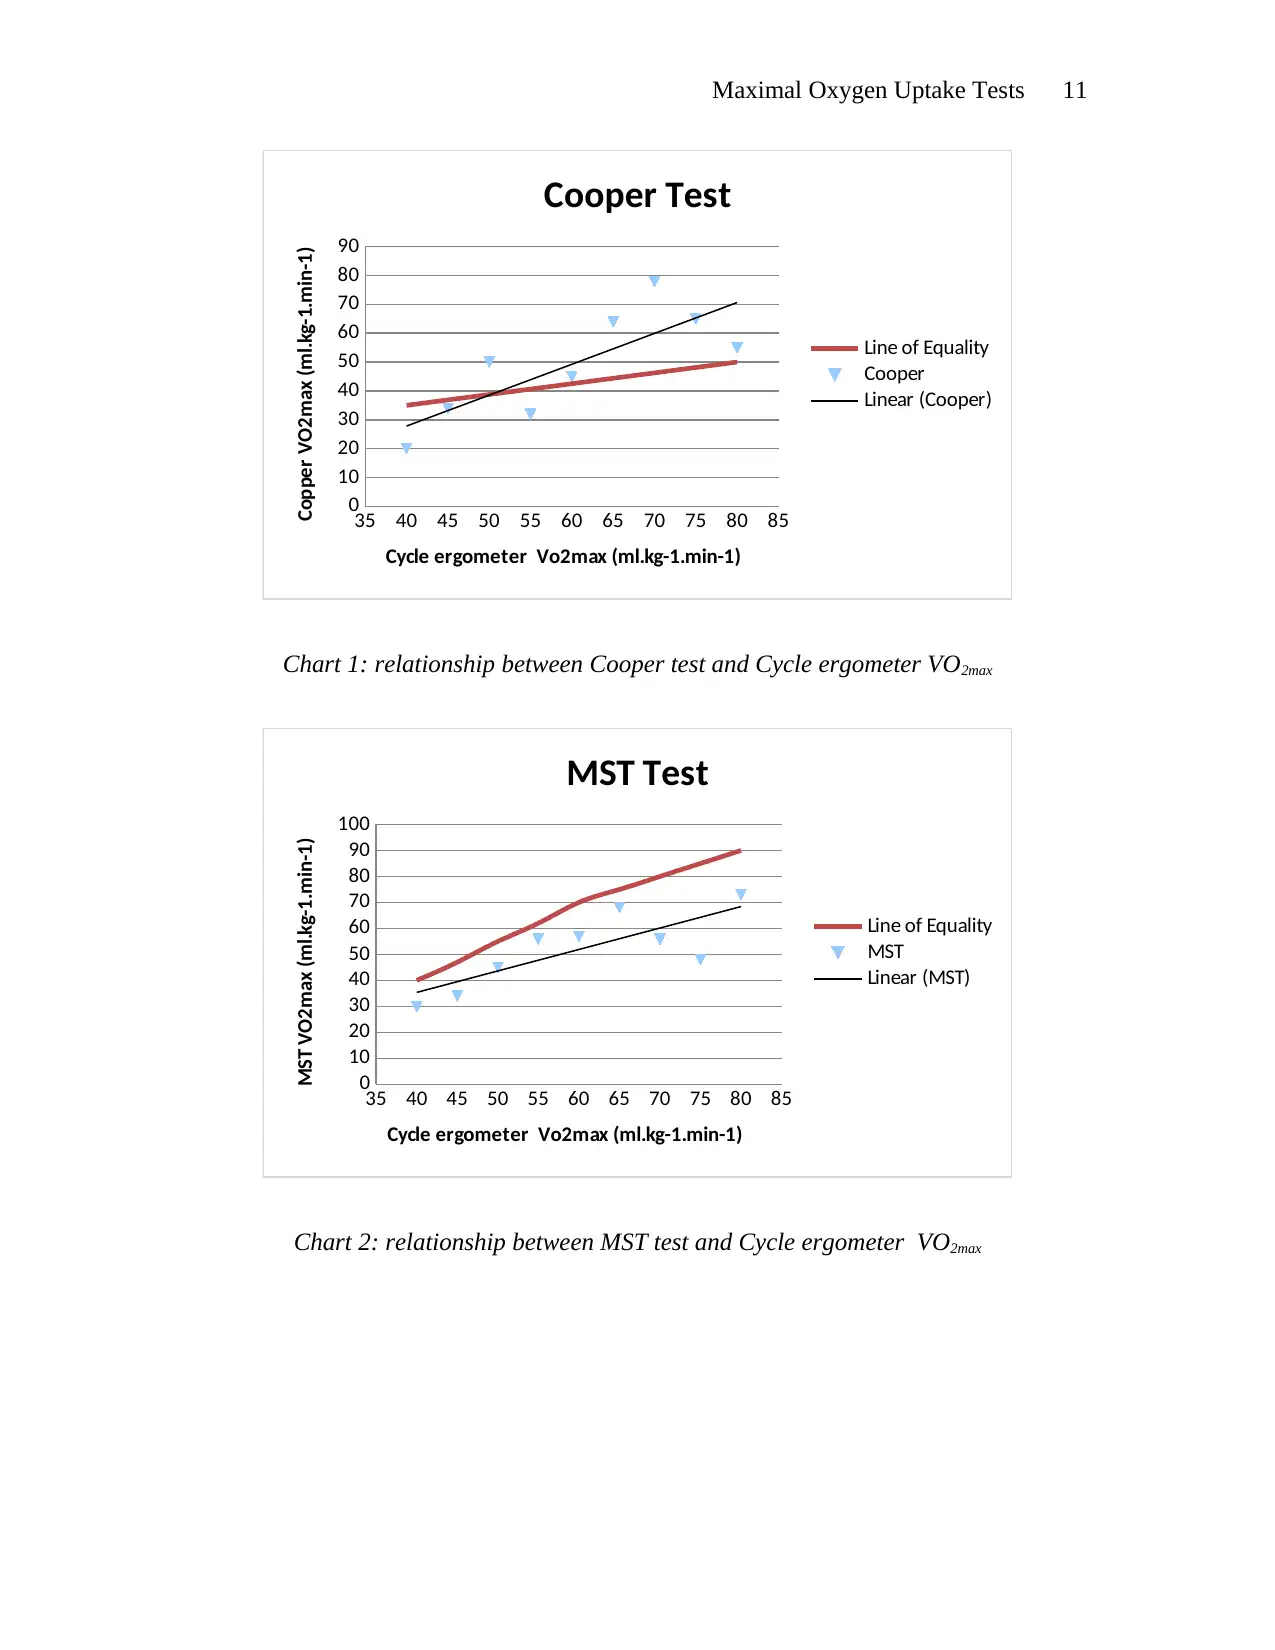
employed in the linear extrapolation method. The scatter-plot Charts labelled 1 to 3 provide a
linear relationship between the direct measurement of VO2 on the cycle ergometer and values
obtained as a result of the MST, Cooper, and predicted L/E tests (Vaquera, et al., 2015). The
charts reveal that there is an underestimation of VO2 for predicted L/E and MST values. Since,
the result was not significantly different from 1for predicted value of cycle ergometer VO2
associated with the slope of the regression; then we can conclude that the bias for all predicted
values can be assumed to be constant for measured cycle ergometer VO2. Accordingly, estimates
of correlation coefficients and systematic biases for each test are present in Table 2. The bias is
tabulated by subtracting the cycle ergometer VO2 from the respective test VO2. And in the case
of MST and predicted L/E there was a significant underestimation of systematic biasness
(Vaquera, et al., 2015).
Moreover, for all tests the predicted values correlated with the cycle ergometer VO2max
and the highest correlation (positive) was observed with the Cooper test. A very strong positive
correlation and no systematic bias needs to be observed if an acceptable VO2 is to derived, As
was performed through the use following simple formula (where A=intercept, B=slope, and
S=Standard deviation of the regression) (Poole & Jones, 2012).
60− A
B ± 2 S
B
Results
The Study reveals that the mean (standard deviation) of the participants' age and body
mass were 23 year (2.4 years) and 71 kilograms (4.6 kilograms). Participants' age and body mass
intervals were 21-29 years and 64.5-94 kilograms. Table 1 indicated below contains the mean
(S.D.) for the various test in terms of ml.kg-1.min-1. The recorded maximum heart rate was
employed in the linear extrapolation method. The scatter-plot Charts labelled 1 to 3 provide a
linear relationship between the direct measurement of VO2 on the cycle ergometer and values
obtained as a result of the MST, Cooper, and predicted L/E tests (Vaquera, et al., 2015). The
charts reveal that there is an underestimation of VO2 for predicted L/E and MST values. Since,
the result was not significantly different from 1for predicted value of cycle ergometer VO2
associated with the slope of the regression; then we can conclude that the bias for all predicted
values can be assumed to be constant for measured cycle ergometer VO2. Accordingly, estimates
of correlation coefficients and systematic biases for each test are present in Table 2. The bias is
tabulated by subtracting the cycle ergometer VO2 from the respective test VO2. And in the case
of MST and predicted L/E there was a significant underestimation of systematic biasness
(Vaquera, et al., 2015).
Moreover, for all tests the predicted values correlated with the cycle ergometer VO2max
and the highest correlation (positive) was observed with the Cooper test. A very strong positive
correlation and no systematic bias needs to be observed if an acceptable VO2 is to derived, As
Maximal Oxygen Uptake Tests 9
such the correlation is required to be greater than 0.8. Moreover, the results in Table 2 prove that
Cooper test is not only offers the best correlation but is also totally unbiased. For all three tests
60 ml.kg-1.min-1 was assumed for both the corresponding cycle ergometer value and the
underlining test (e,g, MST) for each regression exercise (results in Table 3) (Vaquera, et al.,
2015). According to results indicated in the table, both predicted L/E and MST have VO2max for
the cycle ergometer values that is shifted significantly to right of the target value (60 ml.kg-
1.min-1) and likewise they have expansive prediction range. On the other hand, the Cooper test to
a fair degree satisfied the target value. Across the various measurements point MST and
predicted L/E demonstrated considerable biasness and sizable variability. But the Cooper test
was not adversely affected by these issues. Table 4 provides a comparison between predicted and
measured submaximal VO2 associated with the cycle ergometer. The table clearly indicates the
percentage differences between predicted and measured submaximal VO2. Nevertheless, the
difference was found not to be statistically significant. (Vaquera, et al., 2015)
Tables and Figures
Cycle ergometer
(VO2max)
Cooper (VO2max) MST (VO2max) Predicted L/E
(VO2max)
60.1 (8.0) ml.kg-1.min-
1
60.6 (10.3) ml.kg-
1.min-1
56.6 (8.0) ml.kg-1.min-
1
52.0 (8.4) ml.kg-1.min-
1
Table 1: means (standard deviation) in terms of ml.kg-1.min-1
Test Correlation with cycle Bias (s.e.) to VO2max Significance of Bias
⊘ This is a preview!⊘
Do you want full access?
Subscribe today to unlock all pages.
Trusted by 1+ million students worldwide
Maximal Oxygen Uptake Tests 10
ergometer VO2max (p-value)
Cooper 0.92 +0.5 (0.9) 0.6
MST 0.86 -4.5 (0.9) <0.0001
Predicted L/E (a) 0.76 -7.8 (1.4) <0.0001
Predicted L/E (b) 0.74 -8.2 (1.3) <0.0001
Predicted L/E (c) 0.76 -8.4 (1.6) <0.0001
Table 2: Correlation and Biasness results
Cooper (53,66)
MST (56,75)
Predicted L/E (56,86)
Table 3: Predictive performance at target Value of tests 60 ml.kg-1.min-1
Workload Percent Difference means (s.d.)
1 5.2 (18.0)
2 -0.3 (11.1)
3 1.9 (5.7)
Table 4: Comparison between Measure and predicted maximal VO2
Paraphrase This Document
Need a fresh take? Get an instant paraphrase of this document with our AI Paraphraser
Maximal Oxygen Uptake Tests 11
35 40 45 50 55 60 65 70 75 80 85
0
10
20
30
40
50
60
70
80
90
Cooper Test
Line of Equality
Cooper
Linear (Cooper)
Cycle ergometer Vo2max (ml.kg-1.min-1)
Copper VO2max (ml.kg-1.min-1)
Chart 1: relationship between Cooper test and Cycle ergometer VO2max
35 40 45 50 55 60 65 70 75 80 85
0
10
20
30
40
50
60
70
80
90
100
MST Test
Line of Equality
MST
Linear (MST)
Cycle ergometer Vo2max (ml.kg-1.min-1)
MST VO2max (ml.kg-1.min-1)
Chart 2: relationship between MST test and Cycle ergometer VO2max
35 40 45 50 55 60 65 70 75 80 85
0
10
20
30
40
50
60
70
80
90
Cooper Test
Line of Equality
Cooper
Linear (Cooper)
Cycle ergometer Vo2max (ml.kg-1.min-1)
Copper VO2max (ml.kg-1.min-1)
Chart 1: relationship between Cooper test and Cycle ergometer VO2max
35 40 45 50 55 60 65 70 75 80 85
0
10
20
30
40
50
60
70
80
90
100
MST Test
Line of Equality
MST
Linear (MST)
Cycle ergometer Vo2max (ml.kg-1.min-1)
MST VO2max (ml.kg-1.min-1)
Chart 2: relationship between MST test and Cycle ergometer VO2max
Maximal Oxygen Uptake Tests 12
35 40 45 50 55 60 65 70 75 80 85
0
20
40
60
80
100
120
Predicted L/E Test
Line of Equality
Predicted L/E
Linear (Predicted L/E)
Cycle ergometer Vo2max (ml.kg-1.min-1)
Predicted L/E VO2max (ml.kg-1.min-1)
Chart 3: relationship between Predicted L/E test and Cycle ergometer VO2max
35 40 45 50 55 60 65 70 75 80 85
0
20
40
60
80
100
120
Predicted L/E Test
Line of Equality
Predicted L/E
Linear (Predicted L/E)
Cycle ergometer Vo2max (ml.kg-1.min-1)
Predicted L/E VO2max (ml.kg-1.min-1)
Chart 3: relationship between Predicted L/E test and Cycle ergometer VO2max
⊘ This is a preview!⊘
Do you want full access?
Subscribe today to unlock all pages.
Trusted by 1+ million students worldwide
1 out of 16


Your All-in-One AI-Powered Toolkit for Academic Success.
+13062052269
info@desklib.com
Available 24*7 on WhatsApp / Email
![[object Object]](/_next/static/media/star-bottom.7253800d.svg)
Unlock your academic potential
Copyright © 2020–2026 A2Z Services. All Rights Reserved. Developed and managed by ZUCOL.