BI1S54 Biological Chemistry Report: Glucose Measurement Comparison
VerifiedAdded on 2022/08/12
|11
|1714
|16
Report
AI Summary
This laboratory report, submitted for the BI1S54 Biological Chemistry module, details an experiment comparing different methods for glucose measurement. The introduction provides context on the importance of glucose and its detection, as well as the need for new detection methods. The materials and methods section outlines the reagents, equipment, and procedures used, including the DNS and GOD assays. The report describes the preparation of standards and honey samples, along with the experimental steps. Results are presented with tables of absorbance values and graphical analyses. The discussion interprets the results, compares them with existing literature, and addresses the clinical relevance of the study, particularly in the context of honey analysis and blood glucose level determination. The report concludes with references to relevant scientific articles.
Running head: BIOLOGY
LABORATORY REPORT
Name of the Student
Name of the University
Author Note
LABORATORY REPORT
Name of the Student
Name of the University
Author Note
Paraphrase This Document
Need a fresh take? Get an instant paraphrase of this document with our AI Paraphraser
1BIOLOGY
Table of Contents
Introduction................................................................................................................................3
Materials and Methods...............................................................................................................3
Materials required..................................................................................................................3
Method used...........................................................................................................................4
Procedure................................................................................................................................5
Data analysis..........................................................................................................................6
Results........................................................................................................................................6
DNS test.................................................................................................................................6
Table of absorbance values................................................................................................6
Graphical analysis..............................................................................................................7
GOD test.................................................................................................................................8
Table of absorbance values................................................................................................8
Graphical analysis..............................................................................................................9
Discussion................................................................................................................................10
References................................................................................................................................11
2BIOLOGY
Introduction
Glucose has been defined as a simple sugar that has a molecular formula of
C6H12O6. The compound is an abundant monosaccharide associated with a subcategory of
carbohydrates that is mainly made by most algae and plants during their process of
photosynthesis from carbon dioxide and water. This compound has been used in the
generation of energy in the form of ATP. Blood glucose level monitoring is required to keep
track of sugar (blood glucose) which is significantly important since the main form of
keeping diabetes under the control (Hui et al., 2017). Various diseases associated with high
blood glucose levels (diabetes) can be avoided by early detection of high blood glucose.
Ketone molecules can also be detected in urine tests which occurs with the reduction of
insulin in the blood. Thus, the detection of blood glucose has been found to be significantly
important in the field of medical science (Bebu et al., 2017). Newer methods of blood
glucose level detection play an important role in the initiation of the treatment process for
early diagnosis of a blood associated disease. Spectroscopy, type IV blood tests and finger
prick are the most used tests of blood glucose levels. All these tests are used in order to
determine the concentration of blood glucose which remains in the blood.
Materials and Methods
Materials required
Physical equipment: Test tubes, Beakers, conical flasks, UV-Vis spectrophotometer and
water bath.
Chemical reagents: DNS solution A and B, distilled water and honey
⊘ This is a preview!⊘
Do you want full access?
Subscribe today to unlock all pages.
Trusted by 1+ million students worldwide
3BIOLOGY
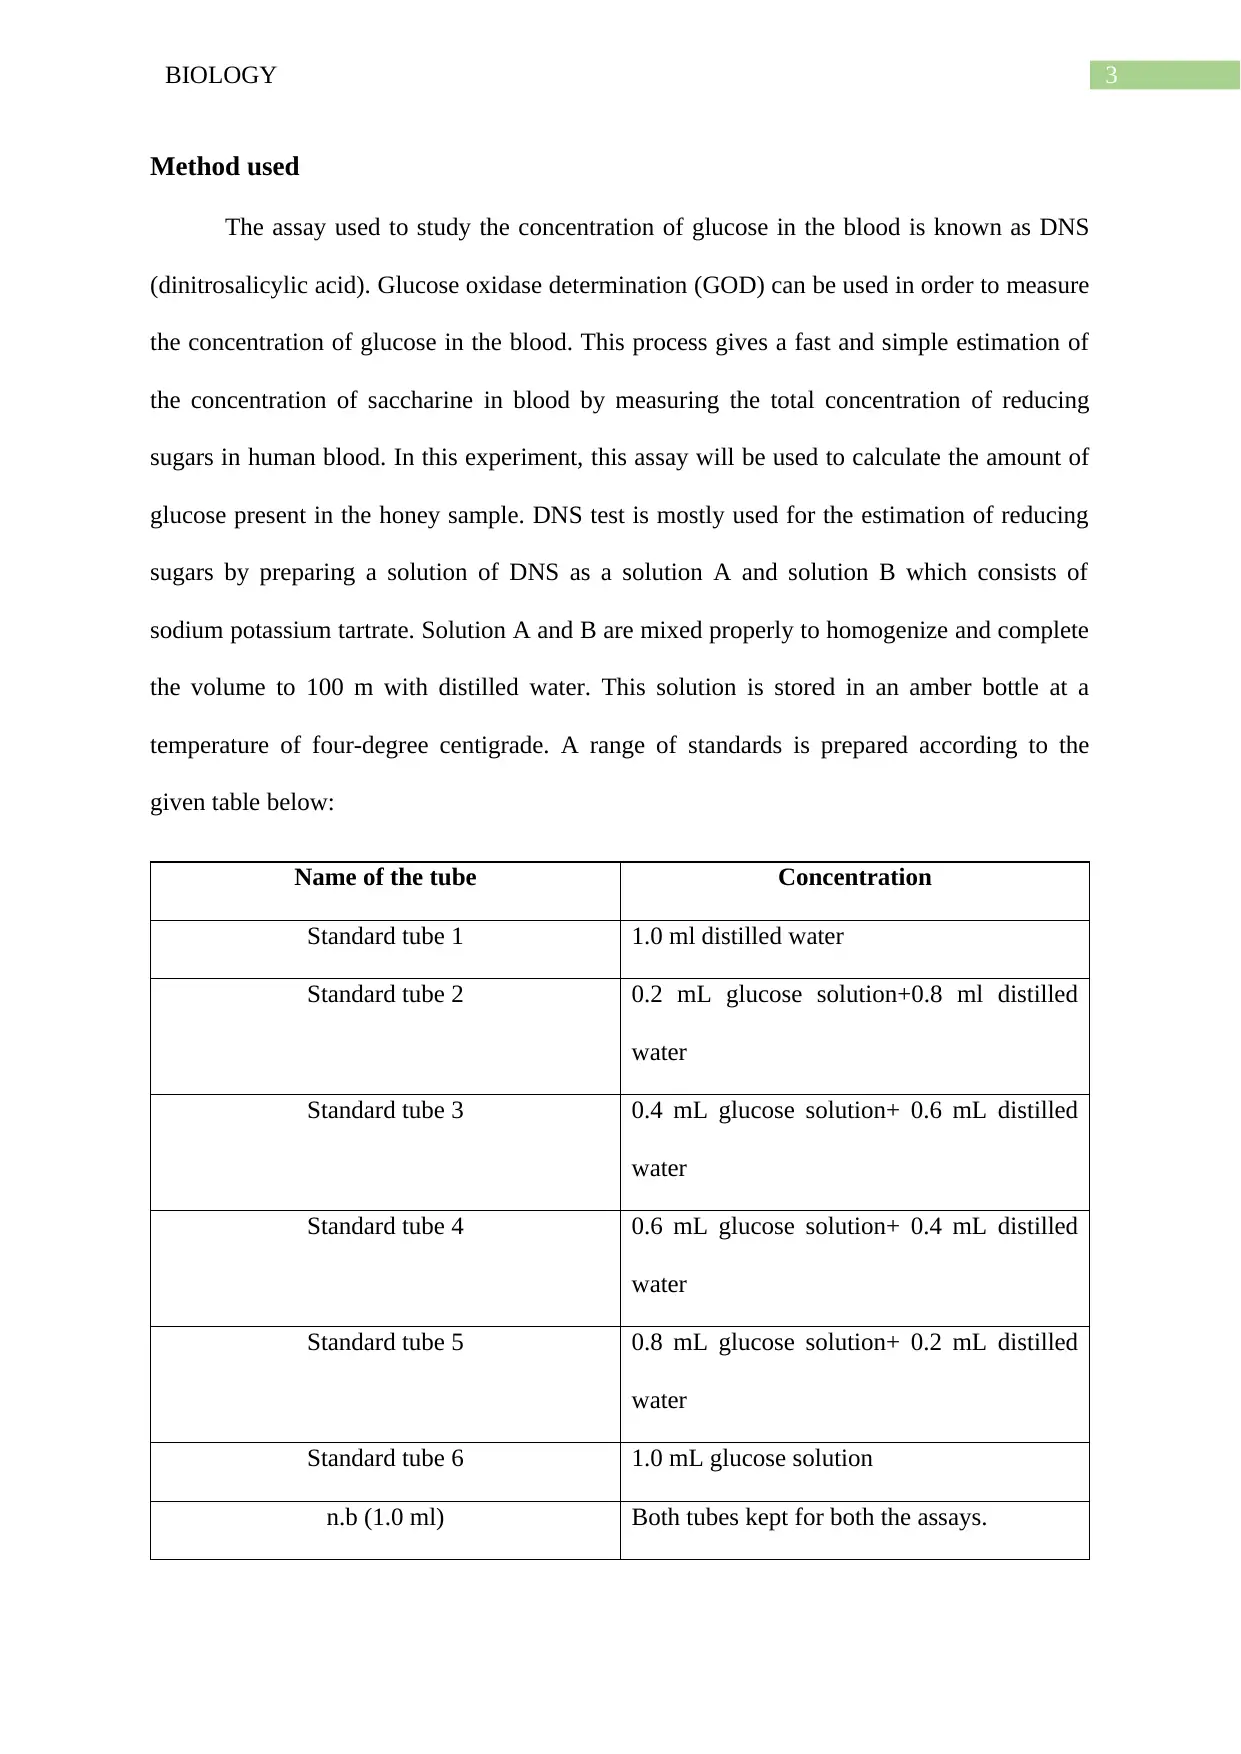
Method used
The assay used to study the concentration of glucose in the blood is known as DNS
(dinitrosalicylic acid). Glucose oxidase determination (GOD) can be used in order to measure
the concentration of glucose in the blood. This process gives a fast and simple estimation of
the concentration of saccharine in blood by measuring the total concentration of reducing
sugars in human blood. In this experiment, this assay will be used to calculate the amount of
glucose present in the honey sample. DNS test is mostly used for the estimation of reducing
sugars by preparing a solution of DNS as a solution A and solution B which consists of
sodium potassium tartrate. Solution A and B are mixed properly to homogenize and complete
the volume to 100 m with distilled water. This solution is stored in an amber bottle at a
temperature of four-degree centigrade. A range of standards is prepared according to the
given table below:
Name of the tube Concentration
Standard tube 1 1.0 ml distilled water
Standard tube 2 0.2 mL glucose solution+0.8 ml distilled
water
Standard tube 3 0.4 mL glucose solution+ 0.6 mL distilled
water
Standard tube 4 0.6 mL glucose solution+ 0.4 mL distilled
water
Standard tube 5 0.8 mL glucose solution+ 0.2 mL distilled
water
Standard tube 6 1.0 mL glucose solution
n.b (1.0 ml) Both tubes kept for both the assays.
Paraphrase This Document
Need a fresh take? Get an instant paraphrase of this document with our AI Paraphraser
4BIOLOGY
Preparations of standard solutions involve preparing solutions with known substance
concentrations. These substances are used in chemistry, biology and analytical chemistry.
This process helps in determining the concentration of unknown chemical substances of the
experimental substances. Accuracy plays a very important role during the preparation of a
standard solution. Thus, it can be stated that the standard solution has been prepared in order
to identify the sample saccharide concentration in human blood. The same standard solution
is used for all the assays since the concentration of the standard solution is known and
constant for both the assays.
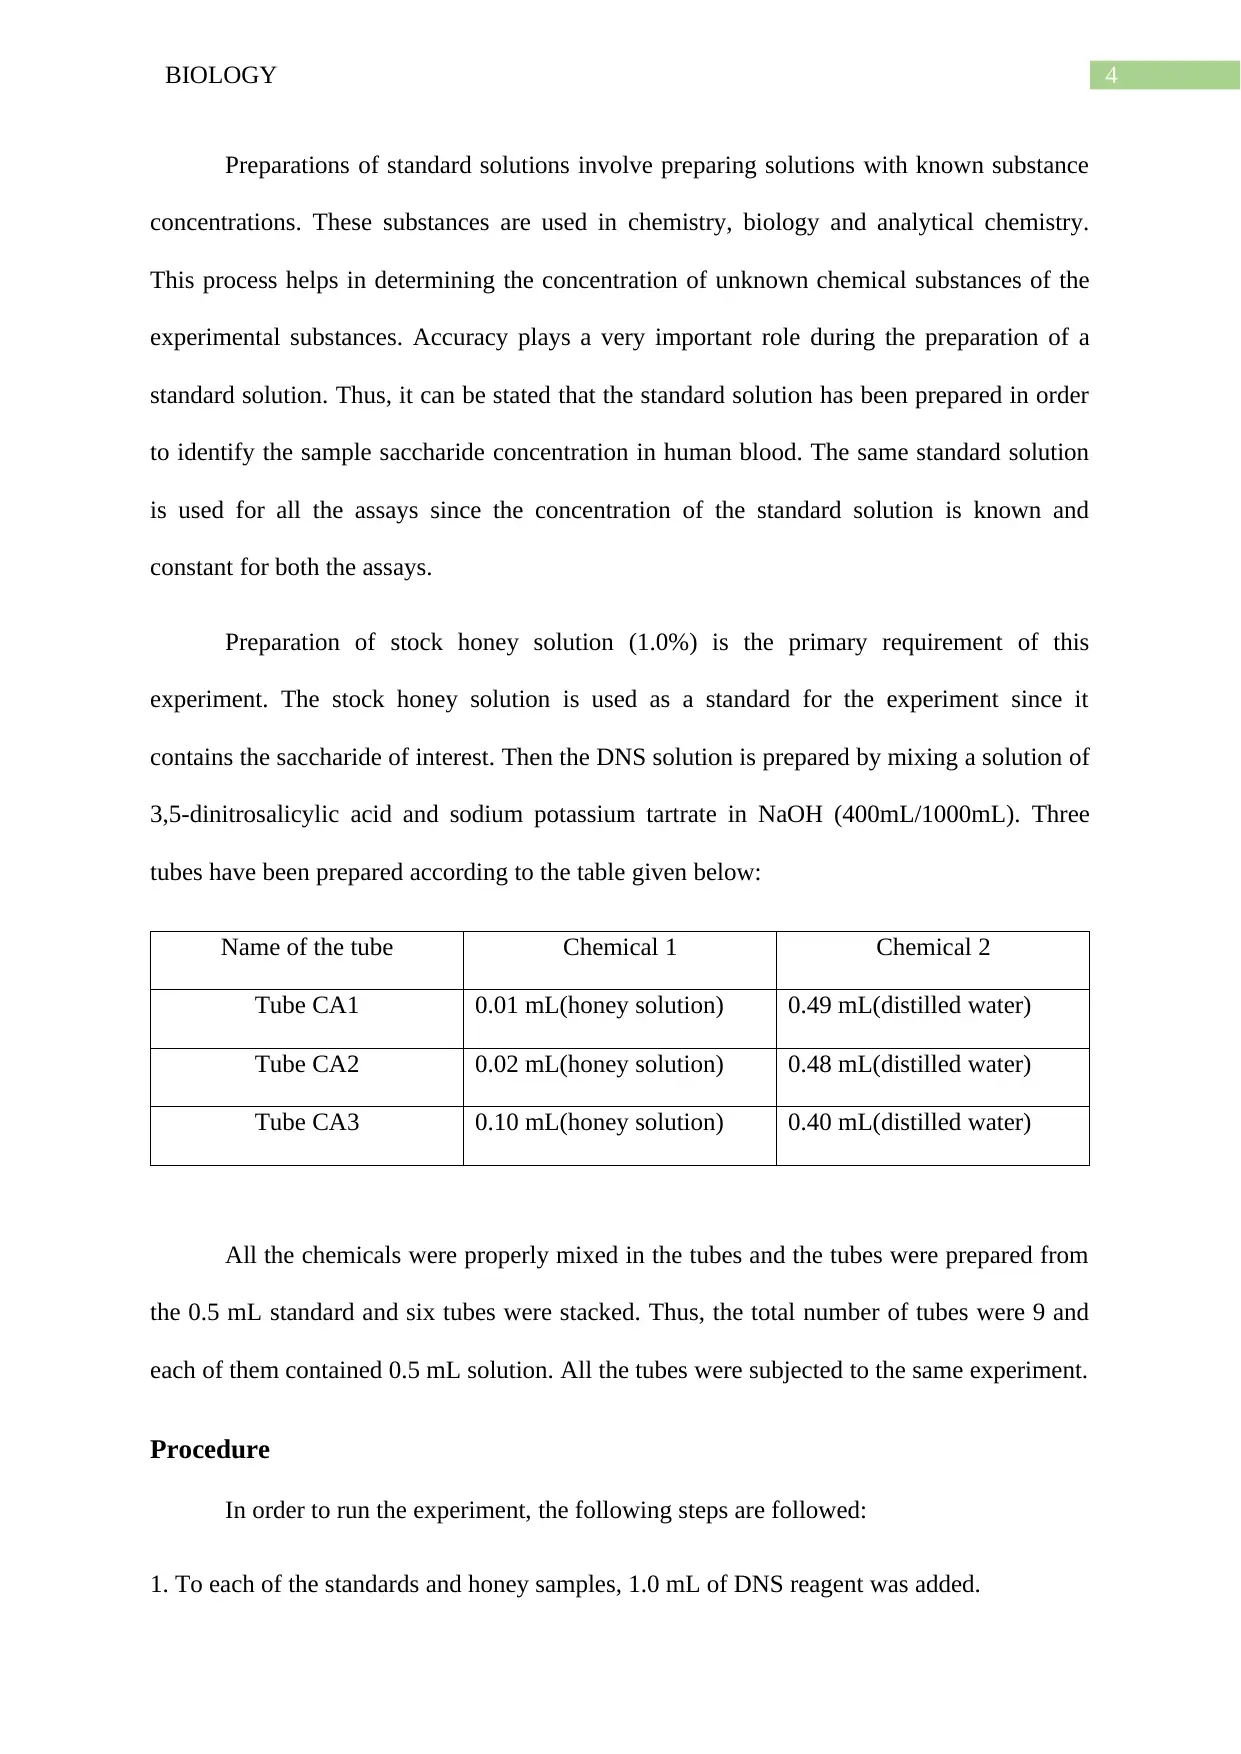
Preparation of stock honey solution (1.0%) is the primary requirement of this
experiment. The stock honey solution is used as a standard for the experiment since it
contains the saccharide of interest. Then the DNS solution is prepared by mixing a solution of
3,5-dinitrosalicylic acid and sodium potassium tartrate in NaOH (400mL/1000mL). Three
tubes have been prepared according to the table given below:
Name of the tube Chemical 1 Chemical 2
Tube CA1 0.01 mL(honey solution) 0.49 mL(distilled water)
Tube CA2 0.02 mL(honey solution) 0.48 mL(distilled water)
Tube CA3 0.10 mL(honey solution) 0.40 mL(distilled water)
All the chemicals were properly mixed in the tubes and the tubes were prepared from
the 0.5 mL standard and six tubes were stacked. Thus, the total number of tubes were 9 and
each of them contained 0.5 mL solution. All the tubes were subjected to the same experiment.
Procedure
In order to run the experiment, the following steps are followed:
1. To each of the standards and honey samples, 1.0 mL of DNS reagent was added.
Preparations of standard solutions involve preparing solutions with known substance
concentrations. These substances are used in chemistry, biology and analytical chemistry.
This process helps in determining the concentration of unknown chemical substances of the
experimental substances. Accuracy plays a very important role during the preparation of a
standard solution. Thus, it can be stated that the standard solution has been prepared in order
to identify the sample saccharide concentration in human blood. The same standard solution
is used for all the assays since the concentration of the standard solution is known and
constant for both the assays.
Preparation of stock honey solution (1.0%) is the primary requirement of this
experiment. The stock honey solution is used as a standard for the experiment since it
contains the saccharide of interest. Then the DNS solution is prepared by mixing a solution of
3,5-dinitrosalicylic acid and sodium potassium tartrate in NaOH (400mL/1000mL). Three
tubes have been prepared according to the table given below:
Name of the tube Chemical 1 Chemical 2
Tube CA1 0.01 mL(honey solution) 0.49 mL(distilled water)
Tube CA2 0.02 mL(honey solution) 0.48 mL(distilled water)
Tube CA3 0.10 mL(honey solution) 0.40 mL(distilled water)
All the chemicals were properly mixed in the tubes and the tubes were prepared from
the 0.5 mL standard and six tubes were stacked. Thus, the total number of tubes were 9 and
each of them contained 0.5 mL solution. All the tubes were subjected to the same experiment.
Procedure
In order to run the experiment, the following steps are followed:
1. To each of the standards and honey samples, 1.0 mL of DNS reagent was added.
5BIOLOGY
2. The tubes were kept in actively boiling water bath for five minutes and mix well.
3. The tubes were placed on bench rack for five minutes and allowed to cool.
4. 2.5 mL distilled water was added to each of the tubes and mixed properly.
5. The absorbance values for all the tubes were recorded at 540 nm.
GOD test has also been performed according to the general procedure used in every blood
glucose level determination experiment.
Data analysis
Then a calibration curve is plotted and the readings from standards are used to
calculate the glucose content of the original honey. The results will be given in the following
section.
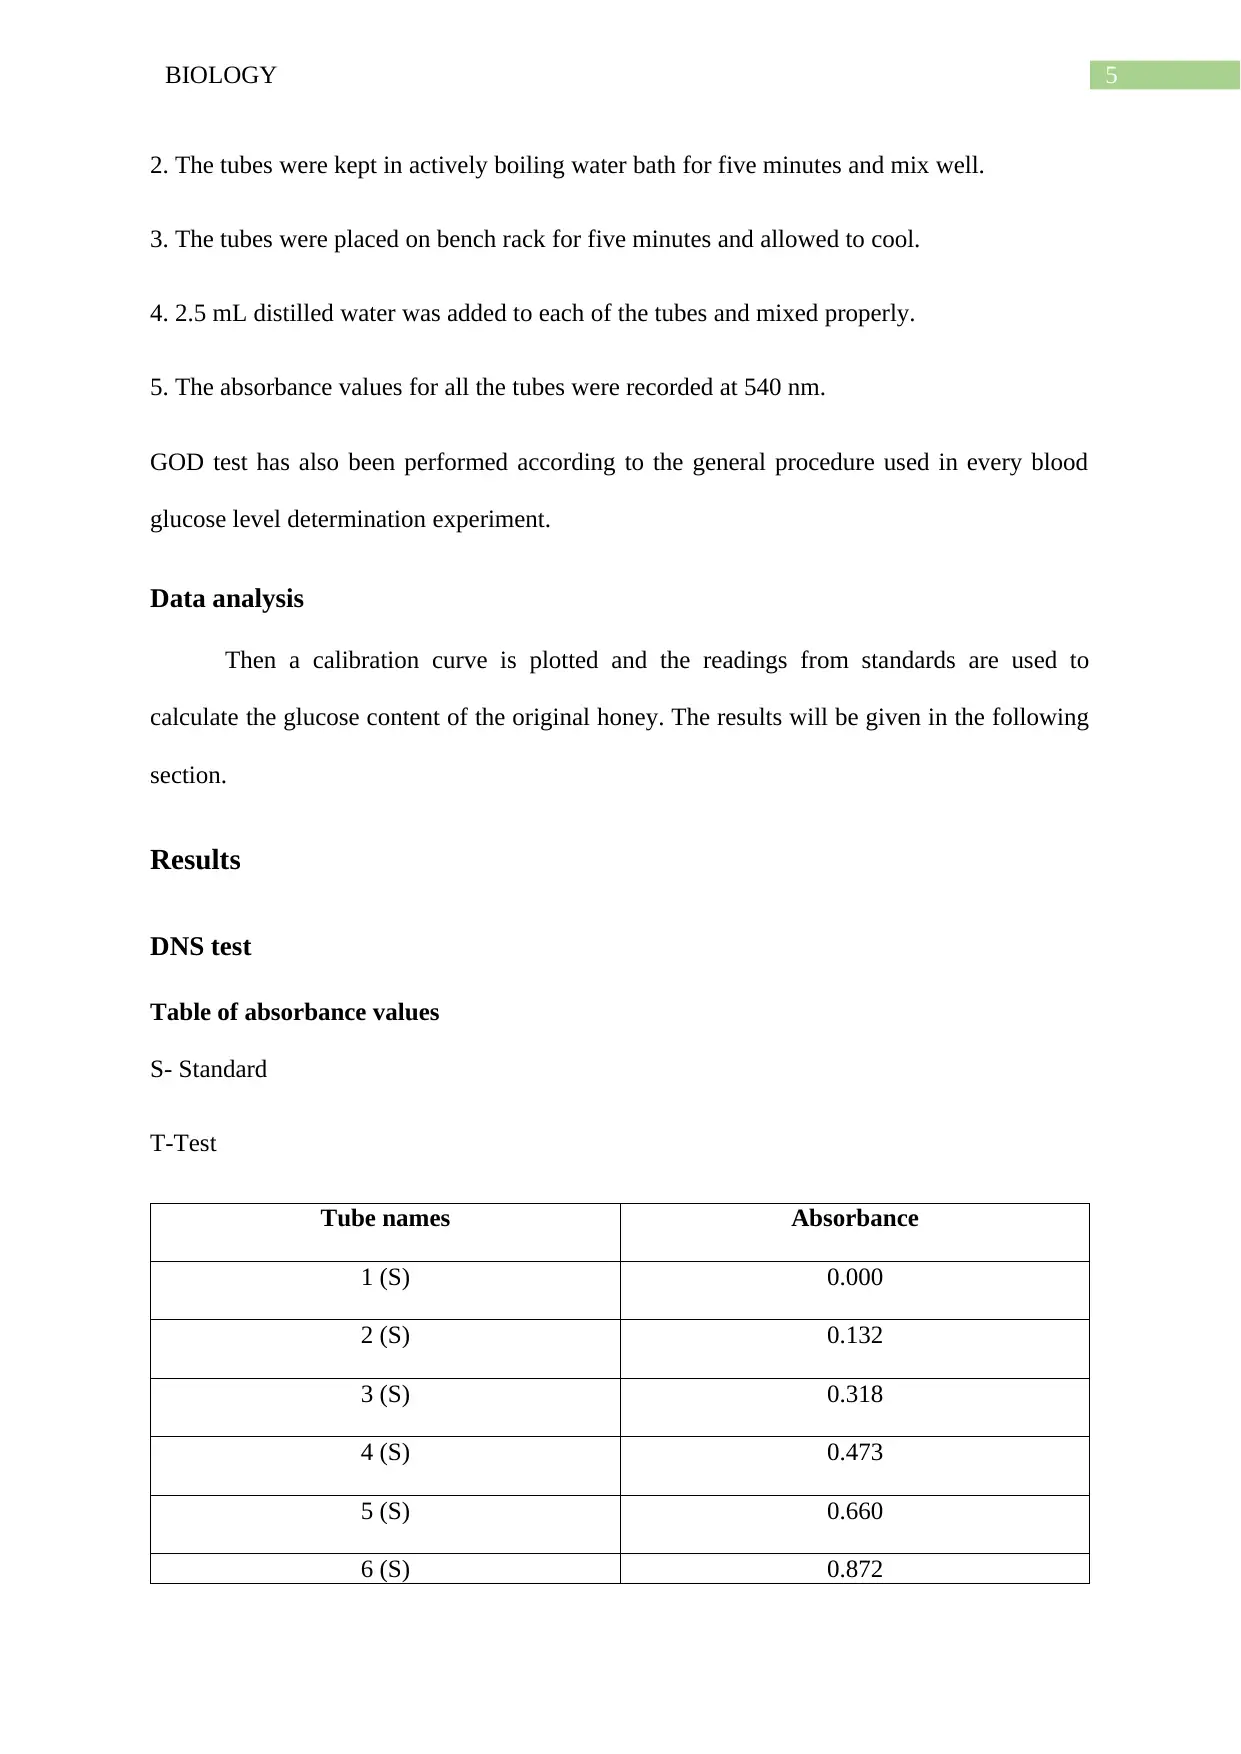
Results
DNS test
Table of absorbance values
S- Standard
T-Test
Tube names Absorbance
1 (S) 0.000
2 (S) 0.132
3 (S) 0.318
4 (S) 0.473
5 (S) 0.660
6 (S) 0.872
2. The tubes were kept in actively boiling water bath for five minutes and mix well.
3. The tubes were placed on bench rack for five minutes and allowed to cool.
4. 2.5 mL distilled water was added to each of the tubes and mixed properly.
5. The absorbance values for all the tubes were recorded at 540 nm.
GOD test has also been performed according to the general procedure used in every blood
glucose level determination experiment.
Data analysis
Then a calibration curve is plotted and the readings from standards are used to
calculate the glucose content of the original honey. The results will be given in the following
section.
Results
DNS test
Table of absorbance values
S- Standard
T-Test
Tube names Absorbance
1 (S) 0.000
2 (S) 0.132
3 (S) 0.318
4 (S) 0.473
5 (S) 0.660
6 (S) 0.872
⊘ This is a preview!⊘
Do you want full access?
Subscribe today to unlock all pages.
Trusted by 1+ million students worldwide
6BIOLOGY
7 (T) 0.100
8 (T) 0.193
9 (T) 1.439
Graphical analysis
1 2 3 4 5 6
0
0.1
0.2
0.3
0.4
0.5
0.6
0.7
0.8
0.9
1
Standard Curve
Absorbance
Fig 1: Standard curve
Source: Microsoft Excel
7 (T) 0.100
8 (T) 0.193
9 (T) 1.439
Graphical analysis
1 2 3 4 5 6
0
0.1
0.2
0.3
0.4
0.5
0.6
0.7
0.8
0.9
1
Standard Curve
Absorbance
Fig 1: Standard curve
Source: Microsoft Excel
Paraphrase This Document
Need a fresh take? Get an instant paraphrase of this document with our AI Paraphraser
7BIOLOGY
1 2 3 4 5 6
0
0.1
0.2
0.3
0.4
0.5
0.6
0.7
0.8
0.9
1
0
0.132
0.318
0.473
0.66
0.872
Experimental graph
Absorbance
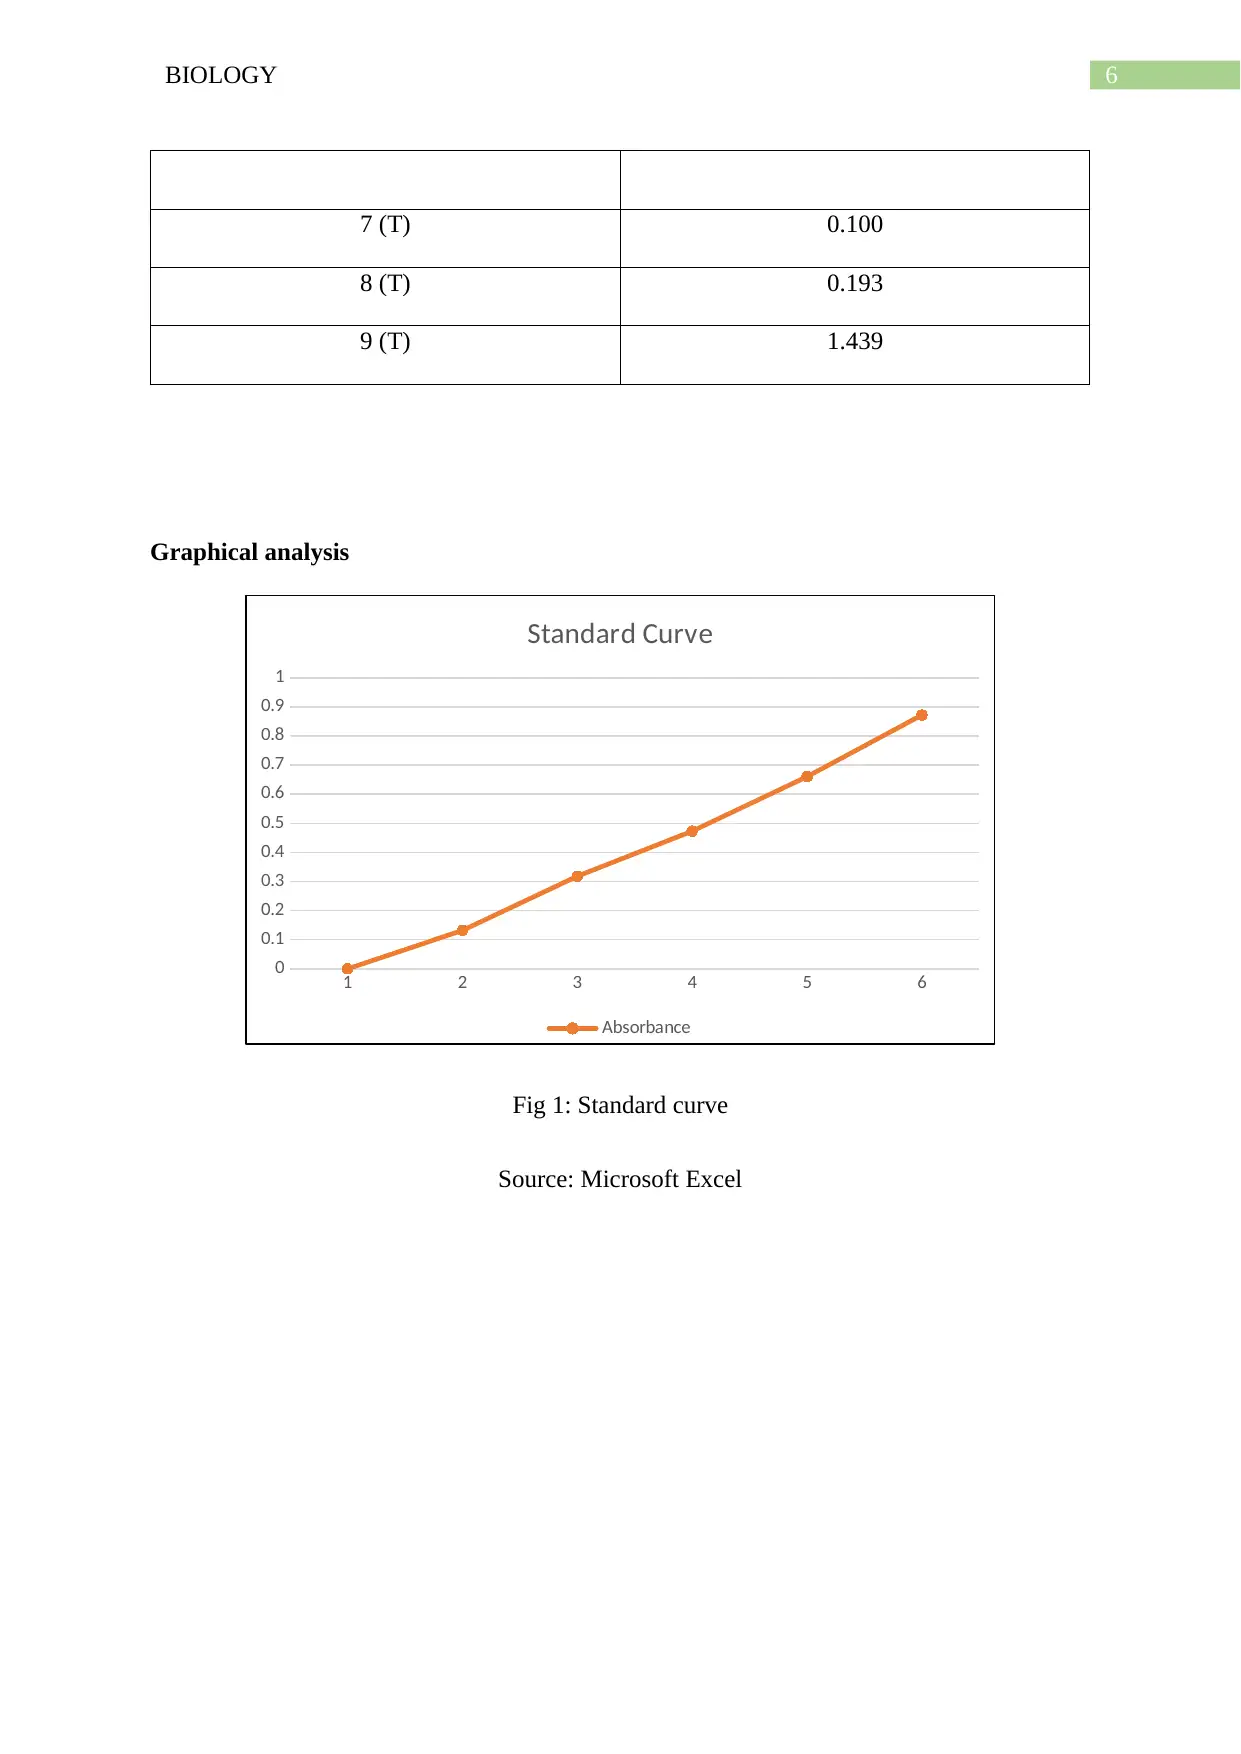
Fig 2: Tube 7 and 8 OD values are plotted
Source: Microsoft Excel
GOD test
Table of absorbance values
Name of tubes Absorbance values
EA1 0.00
EA2 0.19
EA3 0.21
EA4 0.32
EA5 0.34
EA6 0.38
EA7 0.458
EA8 0.57
EA9 0.600
1 2 3 4 5 6
0
0.1
0.2
0.3
0.4
0.5
0.6
0.7
0.8
0.9
1
0
0.132
0.318
0.473
0.66
0.872
Experimental graph
Absorbance
Fig 2: Tube 7 and 8 OD values are plotted
Source: Microsoft Excel
GOD test
Table of absorbance values
Name of tubes Absorbance values
EA1 0.00
EA2 0.19
EA3 0.21
EA4 0.32
EA5 0.34
EA6 0.38
EA7 0.458
EA8 0.57
EA9 0.600
8BIOLOGY
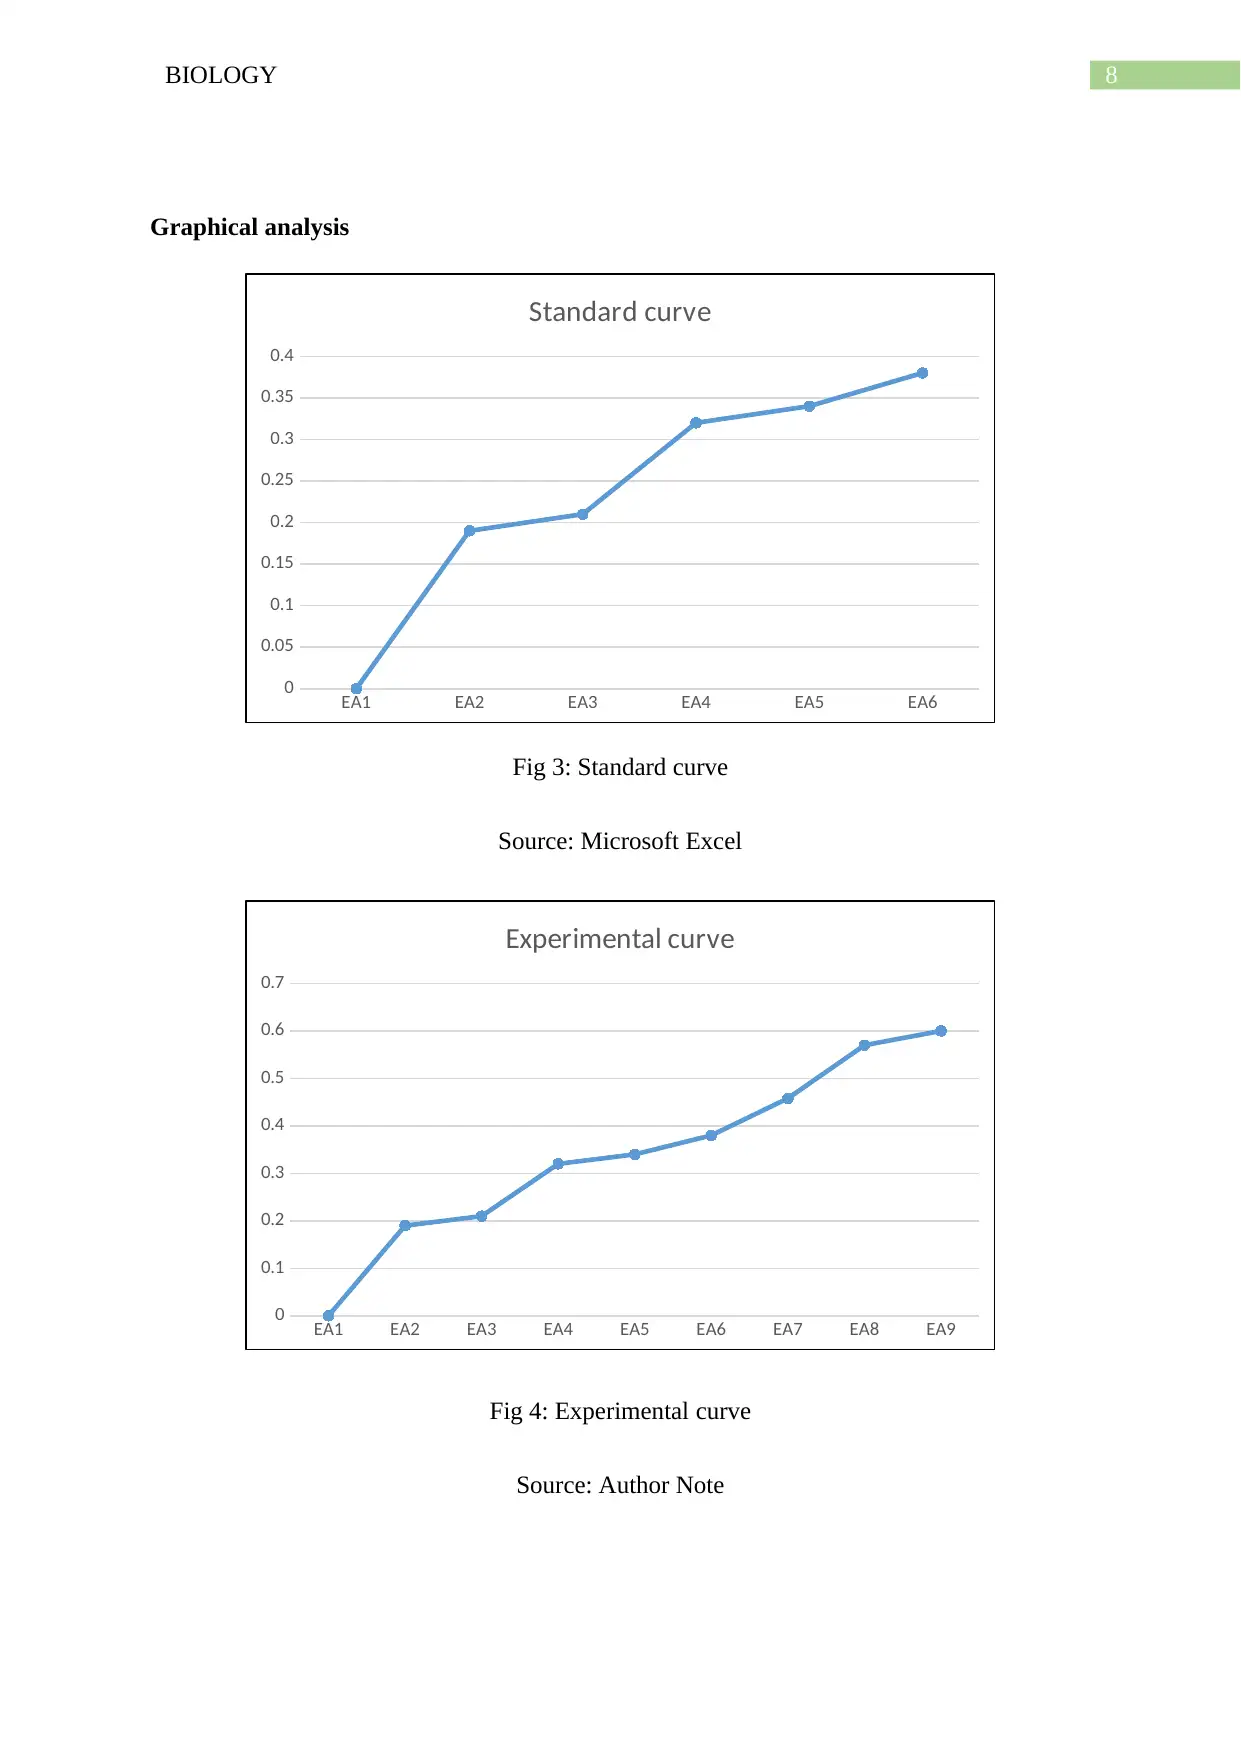
Graphical analysis
EA1 EA2 EA3 EA4 EA5 EA6
0
0.05
0.1
0.15
0.2
0.25
0.3
0.35
0.4
Standard curve
Fig 3: Standard curve
Source: Microsoft Excel
EA1 EA2 EA3 EA4 EA5 EA6 EA7 EA8 EA9
0
0.1
0.2
0.3
0.4
0.5
0.6
0.7
Experimental curve
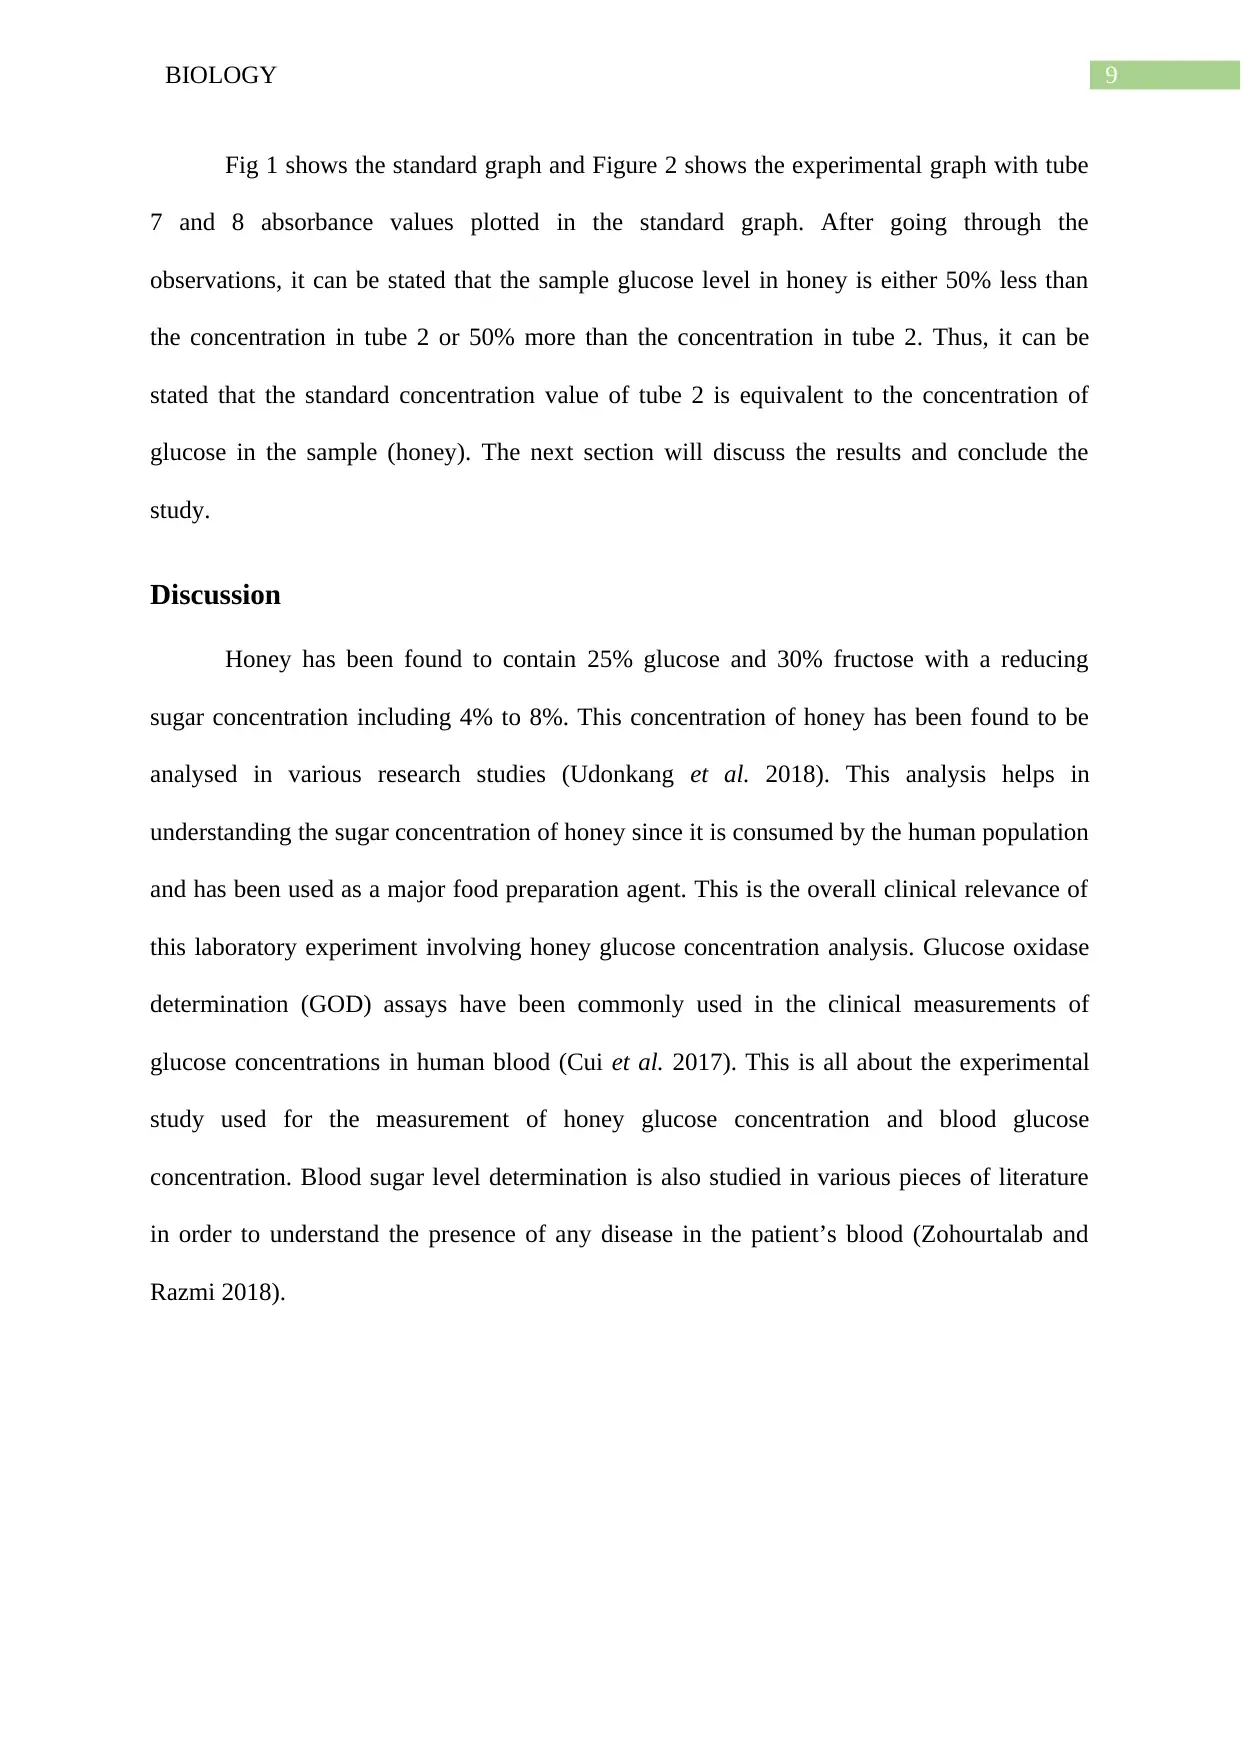
Fig 4: Experimental curve
Source: Author Note
Graphical analysis
EA1 EA2 EA3 EA4 EA5 EA6
0
0.05
0.1
0.15
0.2
0.25
0.3
0.35
0.4
Standard curve
Fig 3: Standard curve
Source: Microsoft Excel
EA1 EA2 EA3 EA4 EA5 EA6 EA7 EA8 EA9
0
0.1
0.2
0.3
0.4
0.5
0.6
0.7
Experimental curve
Fig 4: Experimental curve
Source: Author Note
⊘ This is a preview!⊘
Do you want full access?
Subscribe today to unlock all pages.
Trusted by 1+ million students worldwide
9BIOLOGY
Fig 1 shows the standard graph and Figure 2 shows the experimental graph with tube
7 and 8 absorbance values plotted in the standard graph. After going through the
observations, it can be stated that the sample glucose level in honey is either 50% less than
the concentration in tube 2 or 50% more than the concentration in tube 2. Thus, it can be
stated that the standard concentration value of tube 2 is equivalent to the concentration of
glucose in the sample (honey). The next section will discuss the results and conclude the
study.
Discussion
Honey has been found to contain 25% glucose and 30% fructose with a reducing
sugar concentration including 4% to 8%. This concentration of honey has been found to be
analysed in various research studies (Udonkang et al. 2018). This analysis helps in
understanding the sugar concentration of honey since it is consumed by the human population
and has been used as a major food preparation agent. This is the overall clinical relevance of
this laboratory experiment involving honey glucose concentration analysis. Glucose oxidase
determination (GOD) assays have been commonly used in the clinical measurements of
glucose concentrations in human blood (Cui et al. 2017). This is all about the experimental
study used for the measurement of honey glucose concentration and blood glucose
concentration. Blood sugar level determination is also studied in various pieces of literature
in order to understand the presence of any disease in the patient’s blood (Zohourtalab and
Razmi 2018).
Paraphrase This Document
Need a fresh take? Get an instant paraphrase of this document with our AI Paraphraser
10BIOLOGY
References
Bebu, I., Braffett, B. H., Pop-Busui, R., Orchard, T. J., Nathan, D. M., Lachin, J. M., &
DCCT/EDIC Research Group. (2017). The relationship of blood glucose with cardiovascular
disease is mediated over time by traditional risk factors in type 1 diabetes: the DCCT/EDIC
study. Diabetologia, 60(10), 2084-2091.
Cui, W., Qin, H., Zhou, Y. and Du, J., 2017. Determination of the activity of hydrogen
peroxide scavenging by using blue-emitting glucose oxidase–stabilized gold nanoclusters as
fluorescent nanoprobes and a Fenton reaction that induces fluorescence
quenching. Microchimica Acta, 184(4), pp.1103-1108.
Hui, S., Ghergurovich, J.M., Morscher, R.J., Jang, C., Teng, X., Lu, W., Esparza, L.A., Reya,
T., Zhan, L., Guo, J.Y. and White, E., 2017. Glucose feeds the TCA cycle via circulating
lactate. Nature, 551(7678), pp.115-118.
Udonkang, M.I., Ubi, K.A. and Inyang, I.J., 2018. HONEY AS FIXATIVE AND SAFER
SUBSTITUTE FOR FORMALIN IN HISTOLOGY. Int J Med Lab Res, 3(3), pp.11-17.
Zohourtalab, A. and Razmi, H., 2018. Selective Determination of Glucose in Blood Plasma
by Using an Amperometric Glucose Biosensor Based on Glucose Oxidase and a
Chitosan/Nafion/IL/Ferrocene Composite Film. Biquarterly Iranian Journal of Analytical
Chemistry, 5(1), pp.9-16.
1 out of 11
Related Documents


Your All-in-One AI-Powered Toolkit for Academic Success.
+13062052269
info@desklib.com
Available 24*7 on WhatsApp / Email
![[object Object]](/_next/static/media/star-bottom.7253800d.svg)
Unlock your academic potential
Copyright © 2020–2026 A2Z Services. All Rights Reserved. Developed and managed by ZUCOL.