Business Decision Making Report: Full Discount Ltd Analysis

Verified

Added on  2020/12/09

|17
|3399
|495
Report
AI Summary
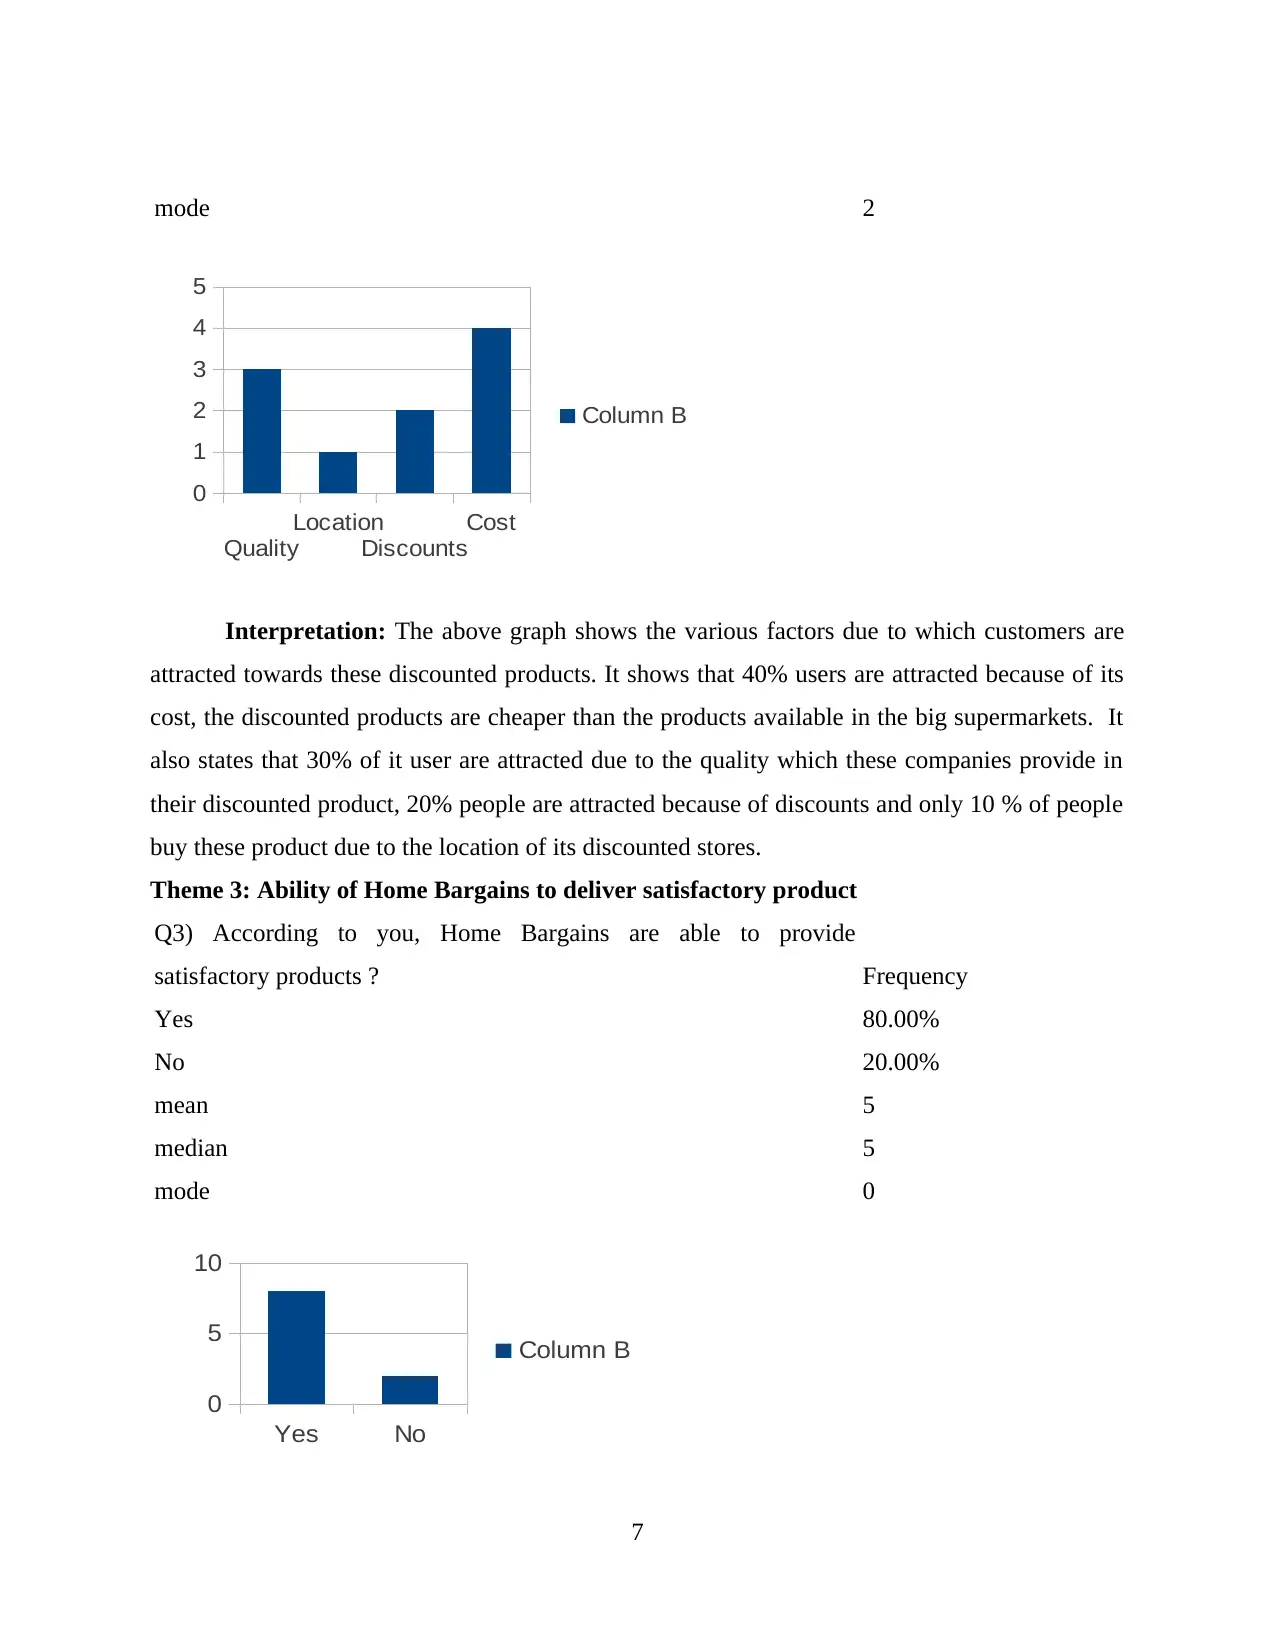
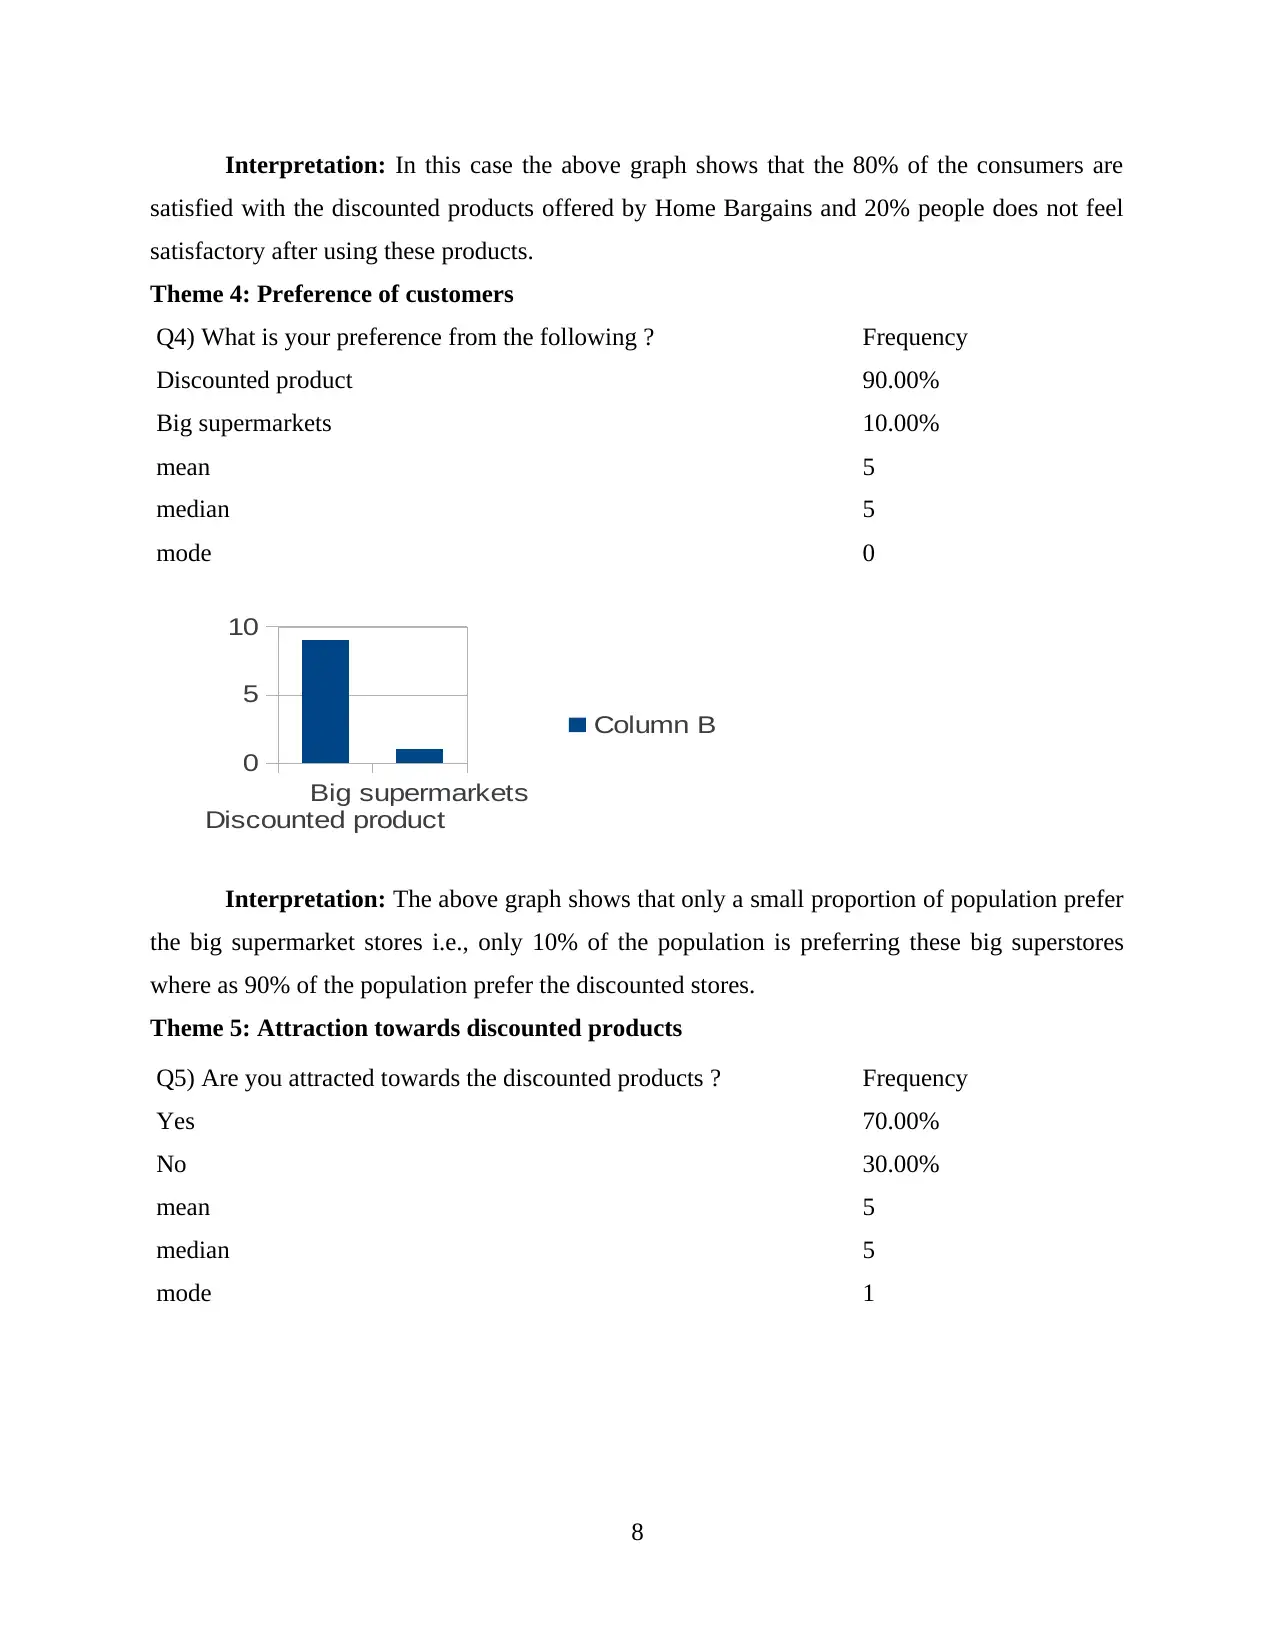
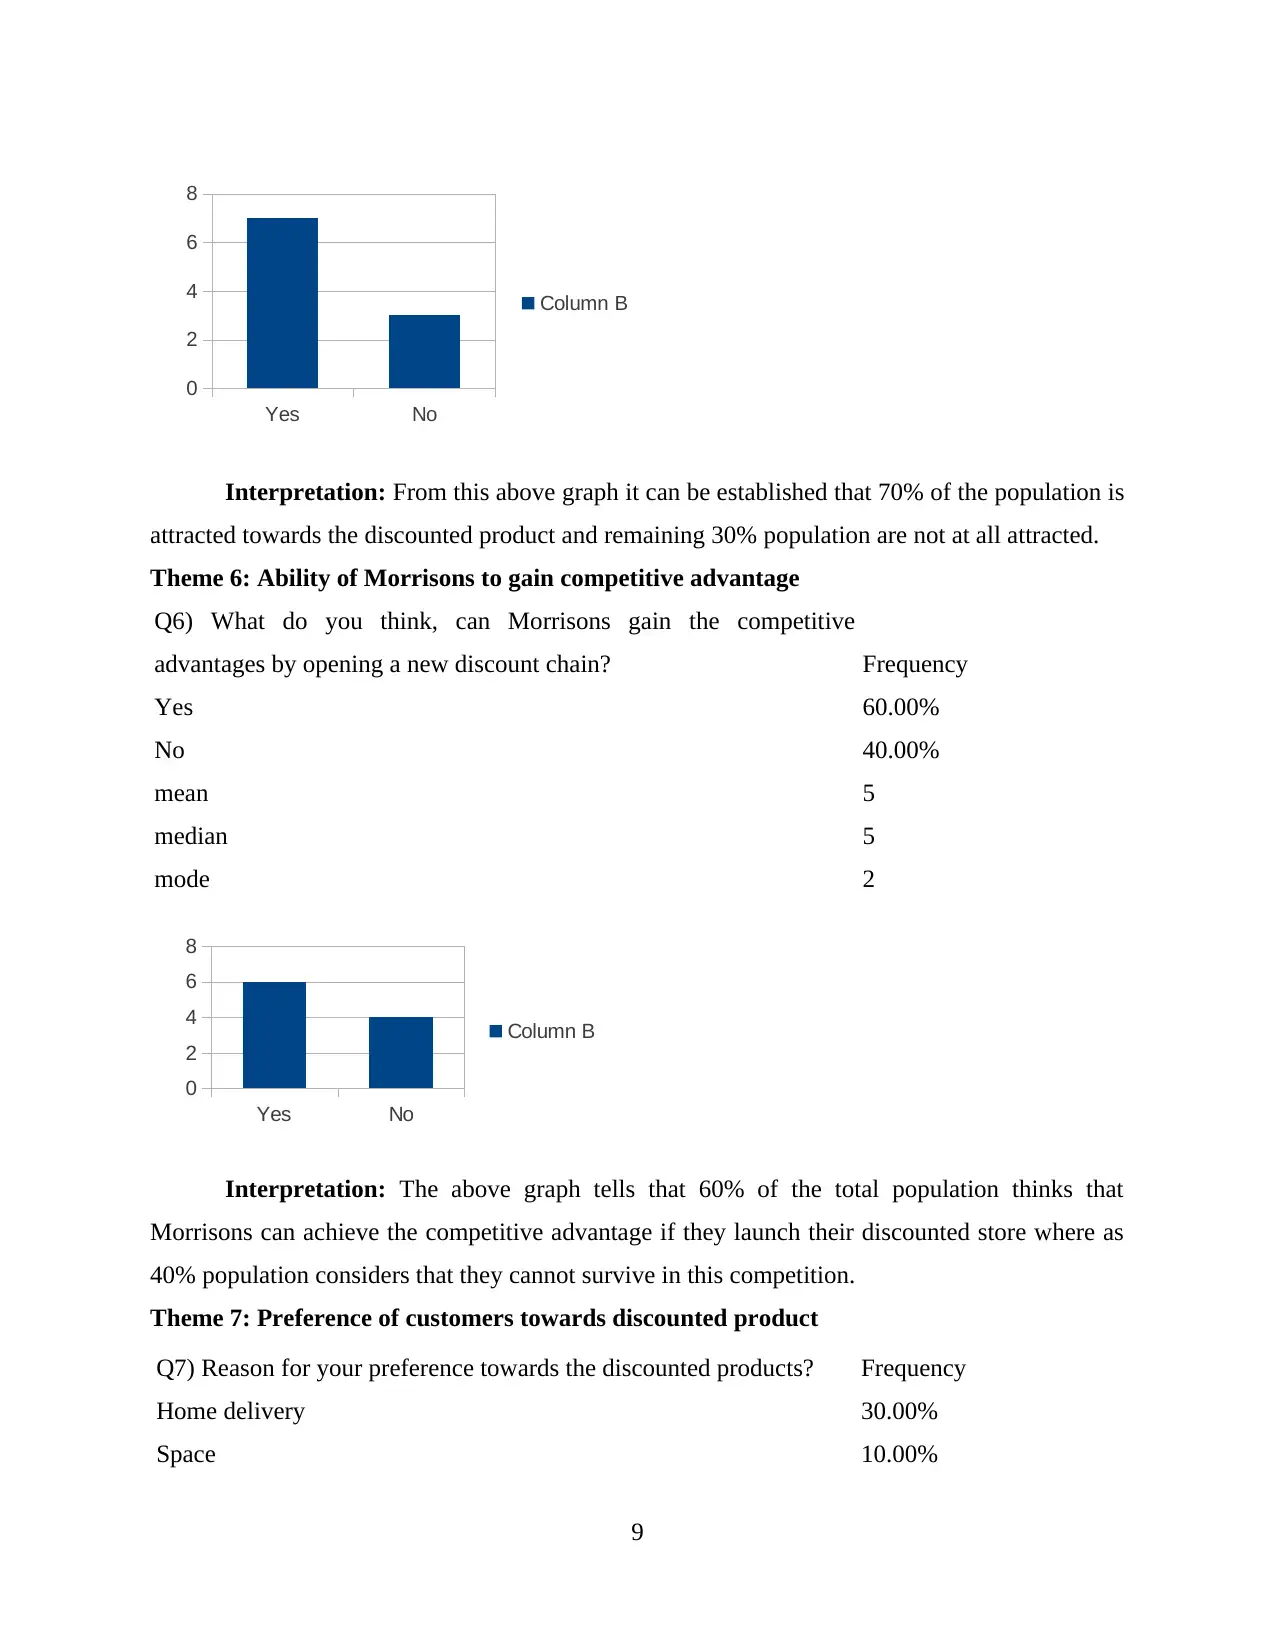
This report, prepared for Full Discount Ltd, examines the business decision-making process within a competitive retail environment, specifically focusing on the discount structure of supermarkets. The research employs both primary and secondary data collection methods, including questionnaires and analysis of company records. The report details the survey methodology, sampling frame, and questionnaire design used to gather primary data. It then presents a comprehensive data analysis, exploring customer satisfaction, preferences, and factors influencing purchasing decisions. The analysis includes graphical representations of the findings. The report concludes with strategic recommendations for Full Discount Ltd to enhance its competitiveness in the market, considering factors such as online services, offers, and product quality, and also the challenges posed by competitors like Morrisons. The report provides a detailed overview of the research process, data analysis, and strategic recommendations for business decision-making in the retail sector.
Document Page
BUSINESS DECISION
MAKING
tabler-icon-diamond-filled.svg

Paraphrase This Document

Need a fresh take? Get an instant paraphrase of this document with our AI Paraphraser
Document Page
EXECUTIVE SUMMARY
Report concise the concept of business decision making to analyse the competitive
business environment. This is one of the supermarket that remain competitive. The market
research team in Full discount Ltd wants to evaluate the discount structure in retail super market.
Competitiveness is evaluated based on B&M and Home.
Document Page
Table of Contents
EXECUTIVE SUMMARY.............................................................................................................2
INTRODUCTION...........................................................................................................................1
DATA COLLECTION....................................................................................................................1
Primary Data Collection..............................................................................................................1
Secondary Data Collection..........................................................................................................2
Survey Methodology and Sampling Frame.................................................................................2
Questionnaire...............................................................................................................................3
Responses.....................................................................................................................................4
DATA ANALYSIS..........................................................................................................................5
Primary Data................................................................................................................................5
Secondary Data..........................................................................................................................11
RECOMMENDATION.................................................................................................................12
CONCLUSION..............................................................................................................................13
REFRENCES...................................................................................................................................1
Document Page
INTRODUCTION
Business Decision-making is a process in which company takes important decision for
the benefit of the company (Bazerman and Moore, 2013). It is considered as an integral part in
modern management. It is important for a mangers to undergo the decision-making process as it
is the key role of a manager. Business decision helps company to improve its efficiency and
sustain its market position. This report contains the research methodology used by the market
research team of full discount Ltd, in order to compete with the existing market players. This
report also contains various types of methods used and different type of data collection methods
used such as primary and secondary. In this report for the collection of primary data
questionnaire is used and for secondary data companies past 3 years record is used. It also
contains the analysis of data collected through various sources and focuses on the various options
available to full discount Ltd to compete with big supermarket and existing players.
DATA COLLECTION
Data collection is a process in which a company or an individual collects information for
all different and relevant sources in order to find a solution to a research problem, evaluate the
out comes received from various sources and test various hypothesis. Companies collect data for
various purposes which include the identification of trend and knowing the taste and preference
of its customers. Data can be collected using two methods; Primary Data Collection Method and
Secondary Data Collection.
Primary Data Collection
Primary data collection methods is the method in which the data are collected by the
researcher itself, it is divide into two forms, Qualitative data collection and Quantitative data
collection.
Qualitative Data Collection: It is a method which involves the questionnaire with open
ended questions, this research is associated closely with feelings, emotions, words and other non
quantifiable elements (Popovič, et.al., 2012). This data aims to the in depth understanding of a
respondent.
Quantitative Data Collection: It is a method of data collection which are basically
based on the mathematical calculation, in order to collect quantitative data questionnaires with
1
tabler-icon-diamond-filled.svg

Paraphrase This Document

Need a fresh take? Get an instant paraphrase of this document with our AI Paraphraser
Document Page
close ended questions are used. It is considered as a cheaper method of collection of data and is
easy to compare the findings.
Secondary Data Collection
Secondary data is collection is the collection of data from various sources in which data
is already published by other researchers for the similar problem or hypothesis (Zsambok and
Klein, 2014). It is a data which is not collected by the researcher itself, it is a data which is been
already published by other researchers in various newspapers, previous research papers, journals,
books etc. while collecting the secondary data it is important for the researcher to check the
authentication and validity of data collected.
Survey Methodology and Sampling Frame
Survey Methodology: Survey Methodology is the study of individual sampling units
selected from a given population. It also includes the various procedures in which researcher
may ask one or more than one questions which a respondent may or may not answer. It is a
method which is adopted by a researcher to collect the data from various respondents, in order to
collect to data surveyors uses various methods as follows:
Questionnaire: A questionnaire is an instrument which is used by researchers and it
contains a series of question in order to collect the data from the respondents.
Interview: An interview is a method used by researchers to collect the response from
respondents, it is a process in which a question is asked by an interviewer and
interviewee responses to that question as per their knowledge.
Sampling Frame: A sampling frame is a list of population relevant for the research is
generated by a researcher from which it draws it sample for the purpose of research. This list
includes a number within the population from which a researcher can select its sample which
includes house holds, individuals and institutions (Pettigrew, 2014). There are basically two
methods which are used by researchers in order to create a sampling frame which are as follows:
Random digit dialling: It is a type of method used by researcher to develop its sampling
frame using a telephone directory. It is commonly used method of collecting information
when telephonic survey is required of individuals in households.
Dual frame sampling: Dual frame sample is a method of selecting sample for two
different sources in order to develop a sampling frame. It is a method used by companies
to carry out a survey related to the identification of trend in the market.
2
Document Page
In the above given case Full Discount Ltd used dual frame sampling in order to draw its
sample to carry out the research and to collect the data it has used questionnaire to record the
responses from different respondents (Quanyu, Tong and Leonard, 2013).
Questionnaire
QUESTIONNAIRE
Name:
Age:
Gender:
Contact no.
Q1) Are you satisfied from discounted products offered by B&M?
a) Yes
b) No
Q2) What factors attract you the most?
a) Quality
b) Location
c) Discounts
d) Cost
Q3) According to you, Home Bargains are able to provide satisfactory products ?
a) Yes
b) No
Q4) What is your preference from the following ?
a) Discounted product
b) Big supermarkets
Q5) Are you attracted towards the discounted products ?
a) Yes
b) No
Q6) What do you think, can Morrisons gain the competitive advantages by opening a new
discount chain?
a) Yes
b) No
3
Document Page
Q7) Reason for your preference towards the discounted products?
a) Home delivery
b) Space
c) Ambience
d) Product variety
Q8) As per you what various ways are available to B&M through which it can compete
with Morrisons?
a) Online service
b) Offers
c) high quality product
Q9) How your needs can determined by companies?
a) Conducting follow me research
b) Interviewing customers
c) Feedback forms
Q10) Recommend ways which can help Full-Discount Ltd to sustain in competition for
long time period.
Responses
Q1) Are you satisfied from discounted products offered by
B&M?
Frequency
Yes 9
No 1
Q2) What factors attract you the most? Frequency
Quality 3
Location 1
Discounts 2
Cost 4
Q3) According to you, Home Bargains are able to provide
satisfactory products ?
Frequency
4
tabler-icon-diamond-filled.svg

Paraphrase This Document

Need a fresh take? Get an instant paraphrase of this document with our AI Paraphraser
Document Page
Yes 8
No 2
Q4) What is your preference from the following ? Frequency
Discounted product 9
Big supermarkets 1
Q5) Are you attracted towards the discounted products ? Frequency
Yes 7
No 3
Q6) What do you think, can Morrisons gain the competitive
advantages by opening a new discount chain?
Frequency
Yes 6
No 4
Q7) Reason for your preference towards the discounted
products?
Frequency
Home delivery 3
Space 1
Ambience 2
Product variety 4
Q8) As per you what various ways are available to B&M through
which it can compete with Morrisons?
Frequency
Online service 3
Offers 4
High quality product 3
Q9) How your needs can determined by companies? Frequency
Conducting follow me research 2
5
Document Page
Interviewing customers 3
Feedback forms 5
DATA ANALYSIS
Primary Data
Theme 1: Satisfaction from discounted products
Q1) Are you satisfied from discounted products offered by B&M? Frequency
Yes 90.00%
No 10.00%
mean 5
median 5
mode 0
Yes No
0
2
4
6
8
10
Column B
Interpretation: The above graph shows that 90% of the respondents are satisfied with
the discounted products which are offered by B&M. In this case maximum number of users of
these product are satisfied.
Theme 2: Factors that attracted the most
Q2) What factors attract you the most? Frequency
Quality 30.00%
Location 10.00%
Discounts 20.00%
Cost 40.00%
mean 3
median 3
6
Document Page
mode 2
Quality
Location
Discounts
Cost
0
1
2
3
4
5
Column B
Interpretation: The above graph shows the various factors due to which customers are
attracted towards these discounted products. It shows that 40% users are attracted because of its
cost, the discounted products are cheaper than the products available in the big supermarkets. It
also states that 30% of it user are attracted due to the quality which these companies provide in
their discounted product, 20% people are attracted because of discounts and only 10 % of people
buy these product due to the location of its discounted stores.
Theme 3: Ability of Home Bargains to deliver satisfactory product
Q3) According to you, Home Bargains are able to provide
satisfactory products ? Frequency
Yes 80.00%
No 20.00%
mean 5
median 5
mode 0
Yes No
0
5
10
Column B
7
tabler-icon-diamond-filled.svg

Paraphrase This Document

Need a fresh take? Get an instant paraphrase of this document with our AI Paraphraser
Document Page
Interpretation: In this case the above graph shows that the 80% of the consumers are
satisfied with the discounted products offered by Home Bargains and 20% people does not feel
satisfactory after using these products.
Theme 4: Preference of customers
Q4) What is your preference from the following ? Frequency
Discounted product 90.00%
Big supermarkets 10.00%
mean 5
median 5
mode 0
Discounted product
Big supermarkets
0
5
10
Column B
Interpretation: The above graph shows that only a small proportion of population prefer
the big supermarket stores i.e., only 10% of the population is preferring these big superstores
where as 90% of the population prefer the discounted stores.
Theme 5: Attraction towards discounted products
Q5) Are you attracted towards the discounted products ? Frequency
Yes 70.00%
No 30.00%
mean 5
median 5
mode 1
8
Document Page
Yes No
0
2
4
6
8
Column B
Interpretation: From this above graph it can be established that 70% of the population is
attracted towards the discounted product and remaining 30% population are not at all attracted.
Theme 6: Ability of Morrisons to gain competitive advantage
Q6) What do you think, can Morrisons gain the competitive
advantages by opening a new discount chain? Frequency
Yes 60.00%
No 40.00%
mean 5
median 5
mode 2
Yes No
0
2
4
6
8
Column B
Interpretation: The above graph tells that 60% of the total population thinks that
Morrisons can achieve the competitive advantage if they launch their discounted store where as
40% population considers that they cannot survive in this competition.
Theme 7: Preference of customers towards discounted product
Q7) Reason for your preference towards the discounted products? Frequency
Home delivery 30.00%
Space 10.00%
9
chevron_up_icon
1 out of 17
circle_padding
hide_on_mobile
zoom_out_icon
[object Object]