Economics for Business - Competitive Markets and Inflation

Verified

Added on  2020/04/01

|9
|1247
|62
Homework Assignment
AI Summary
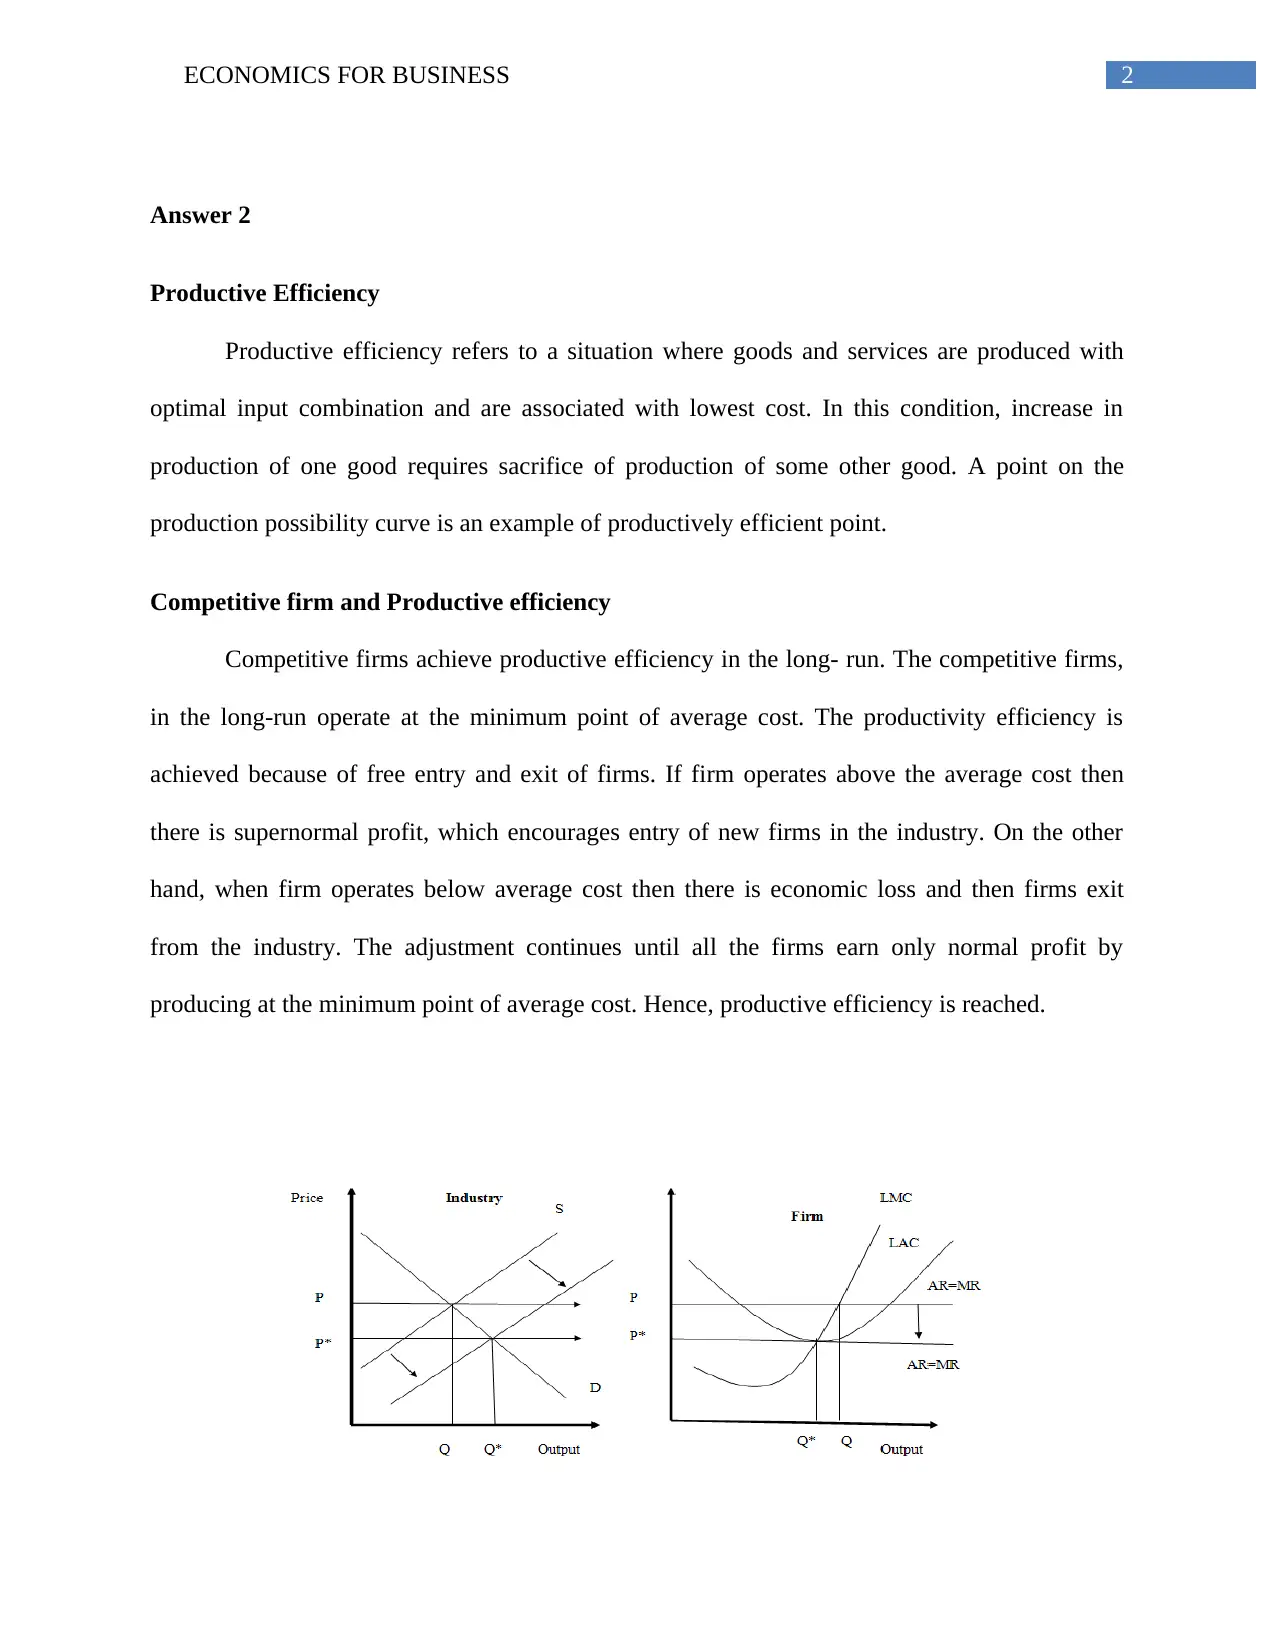
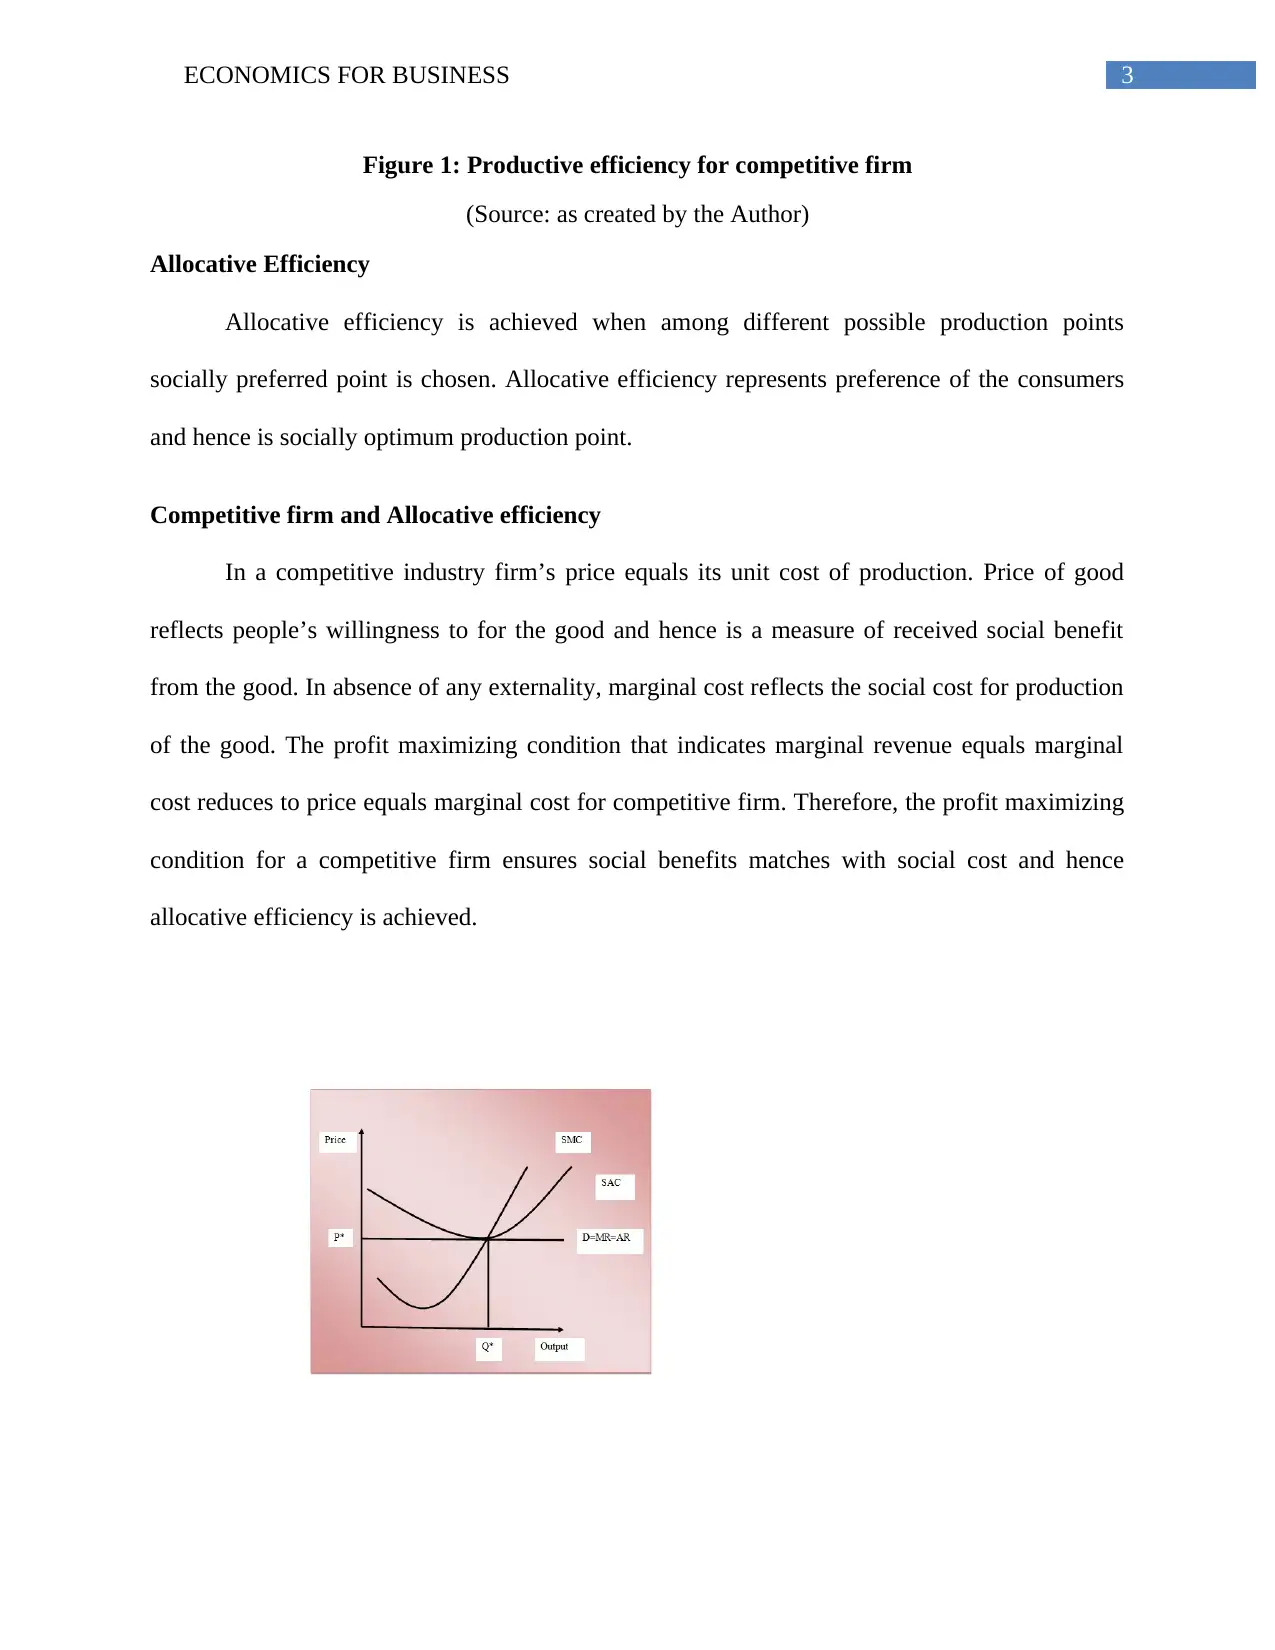
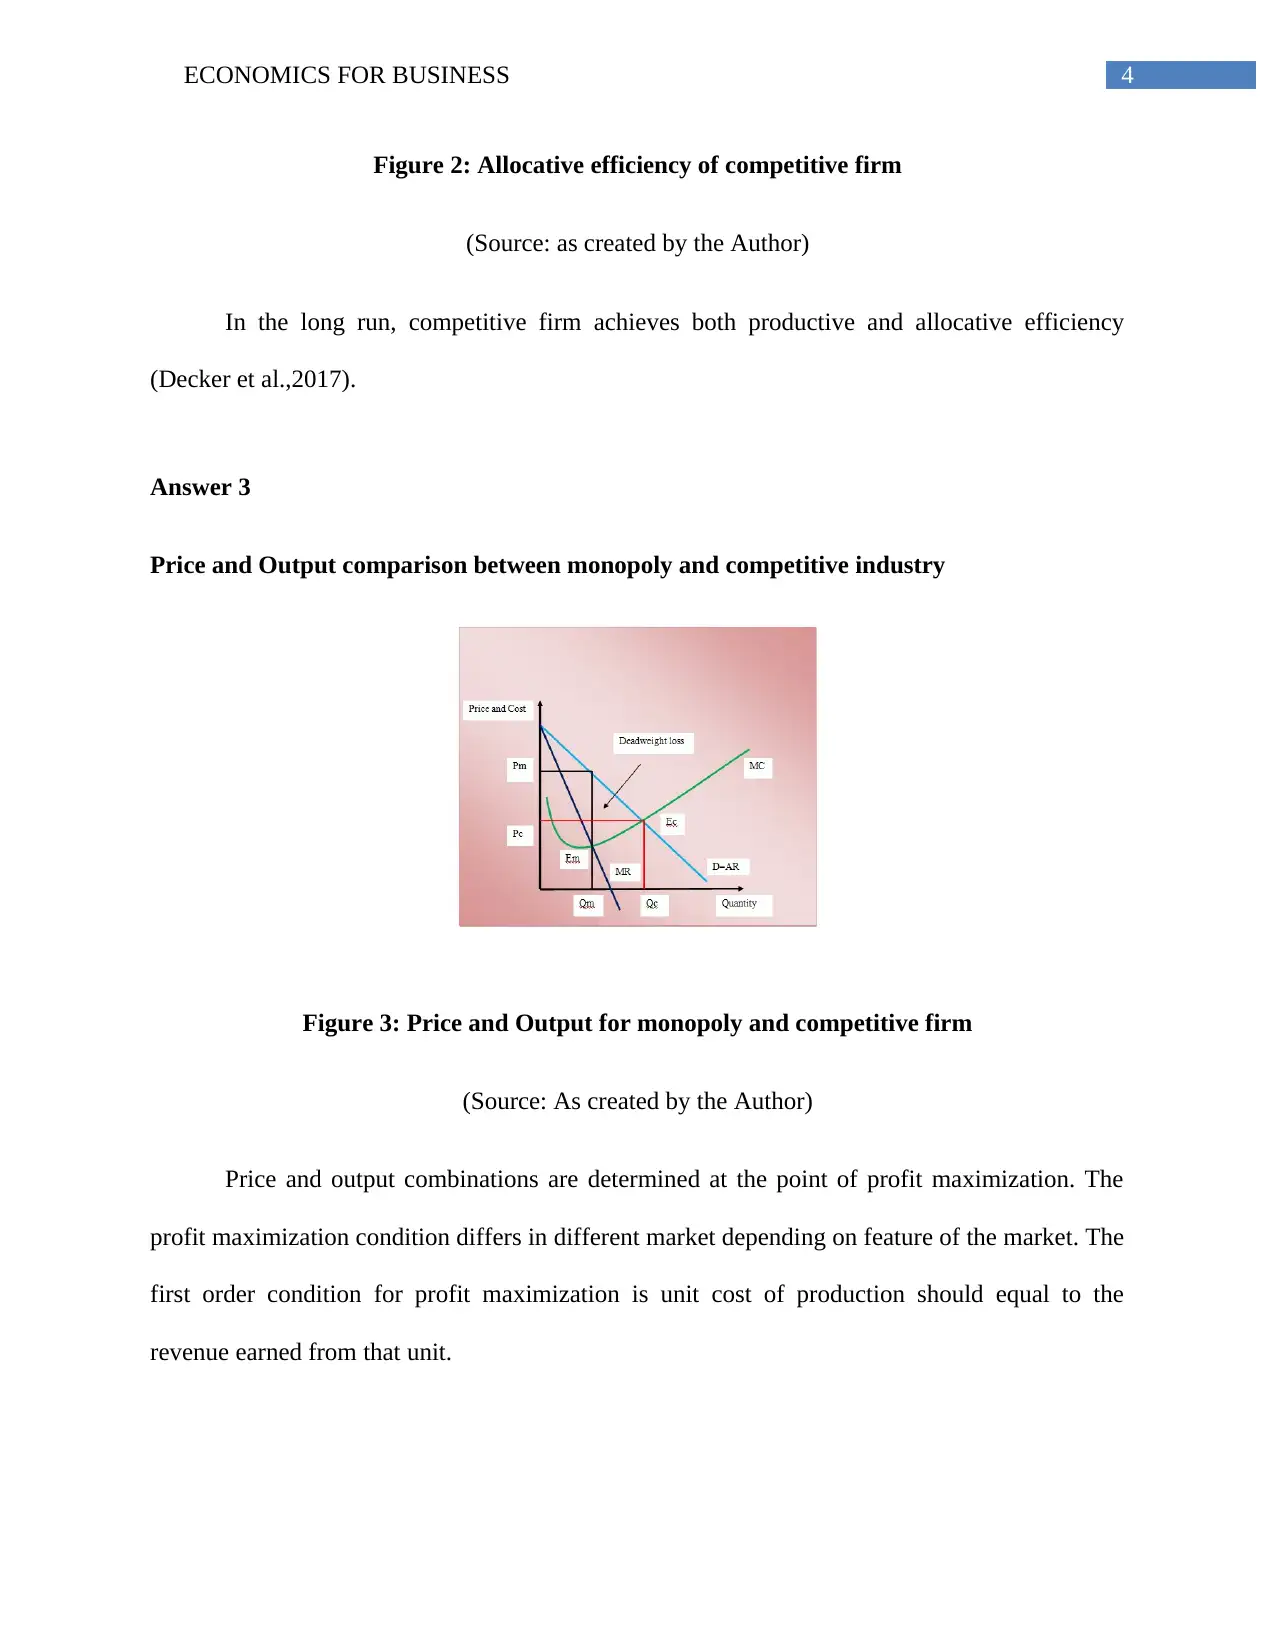
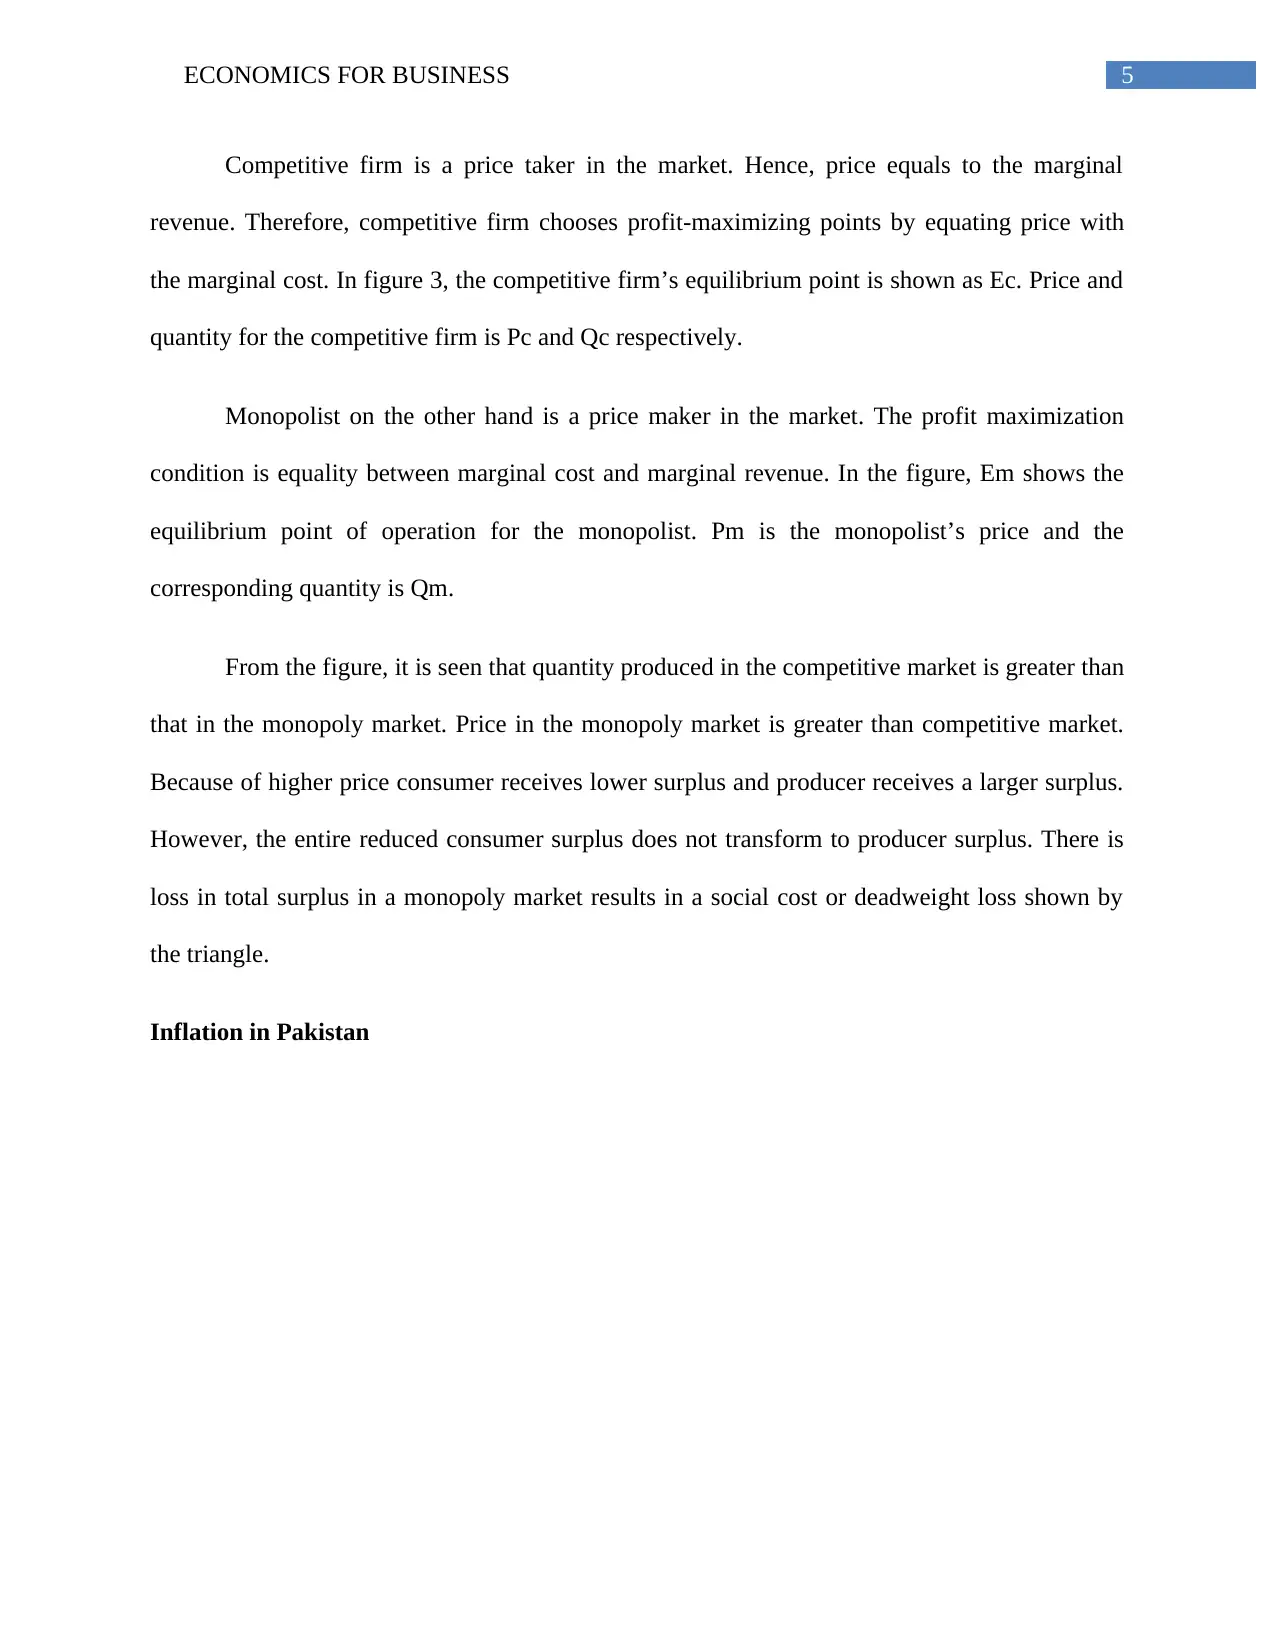
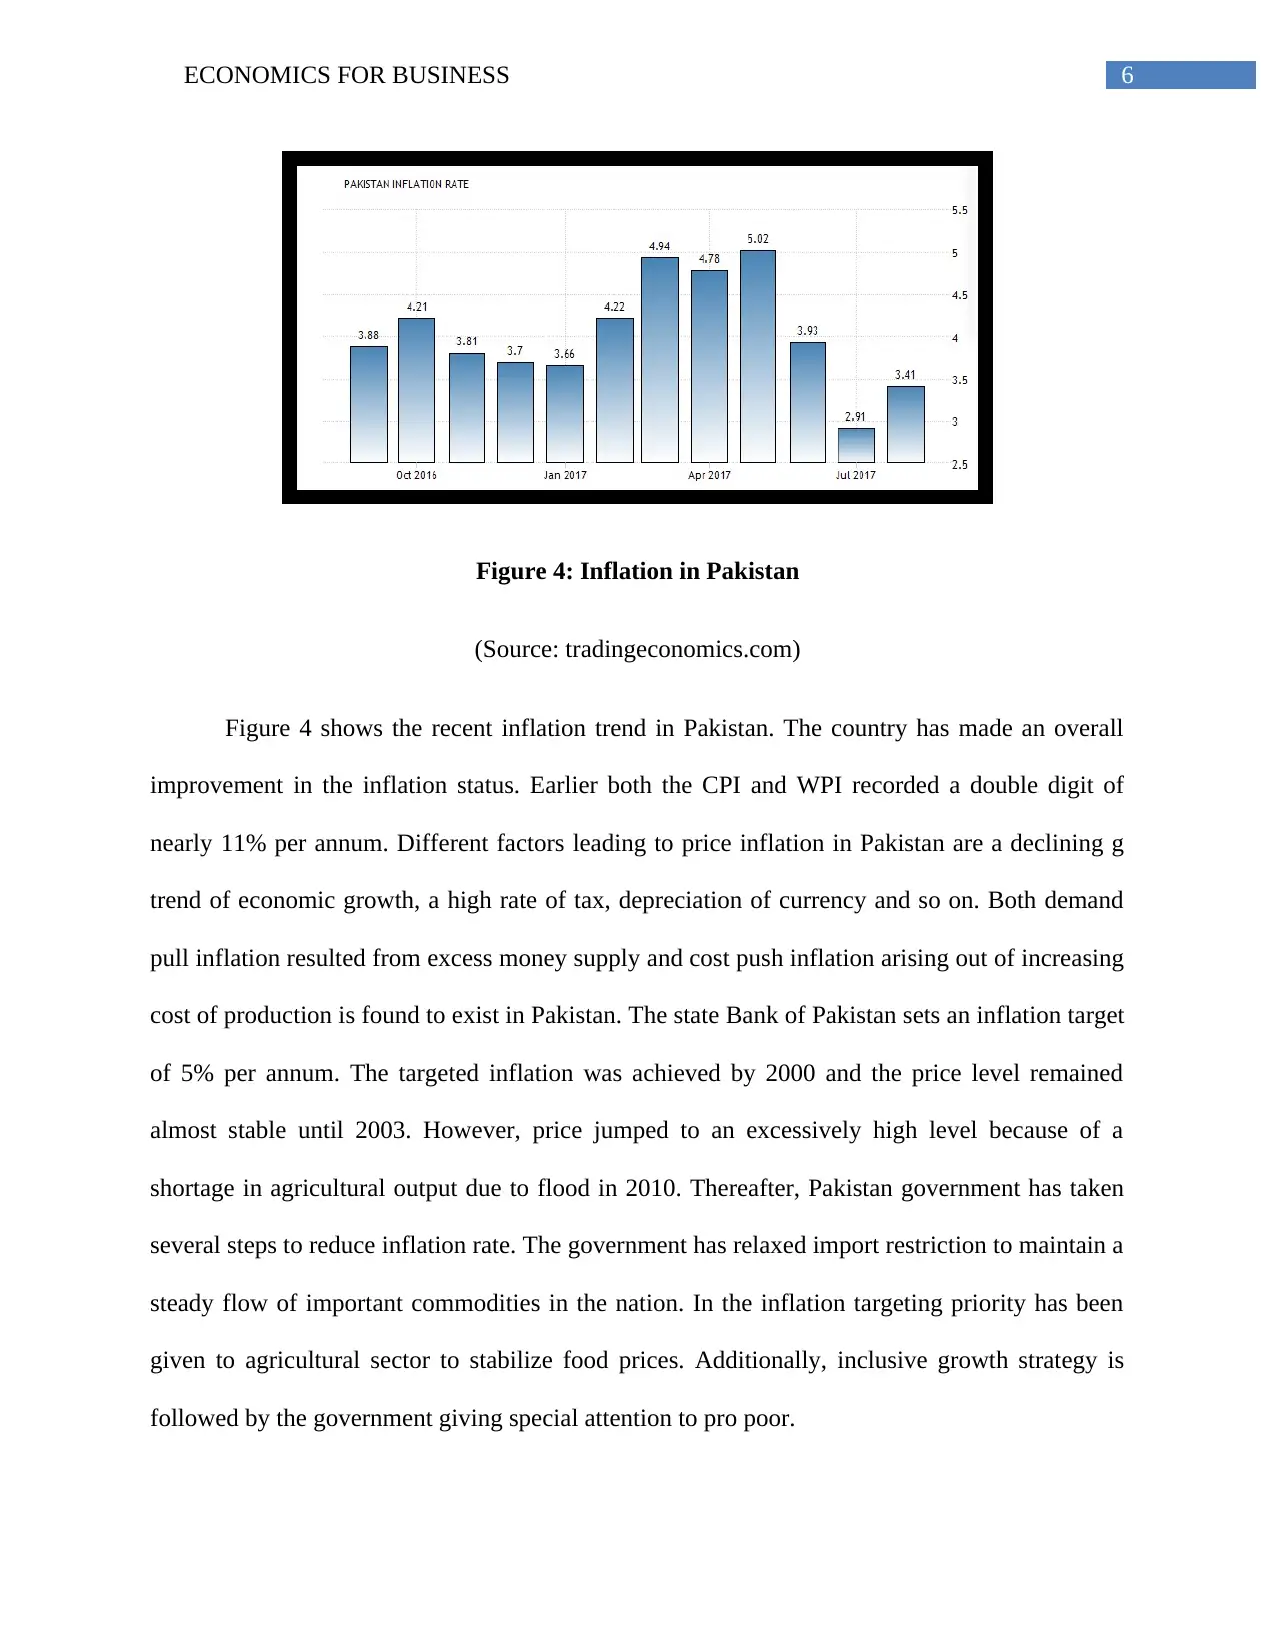
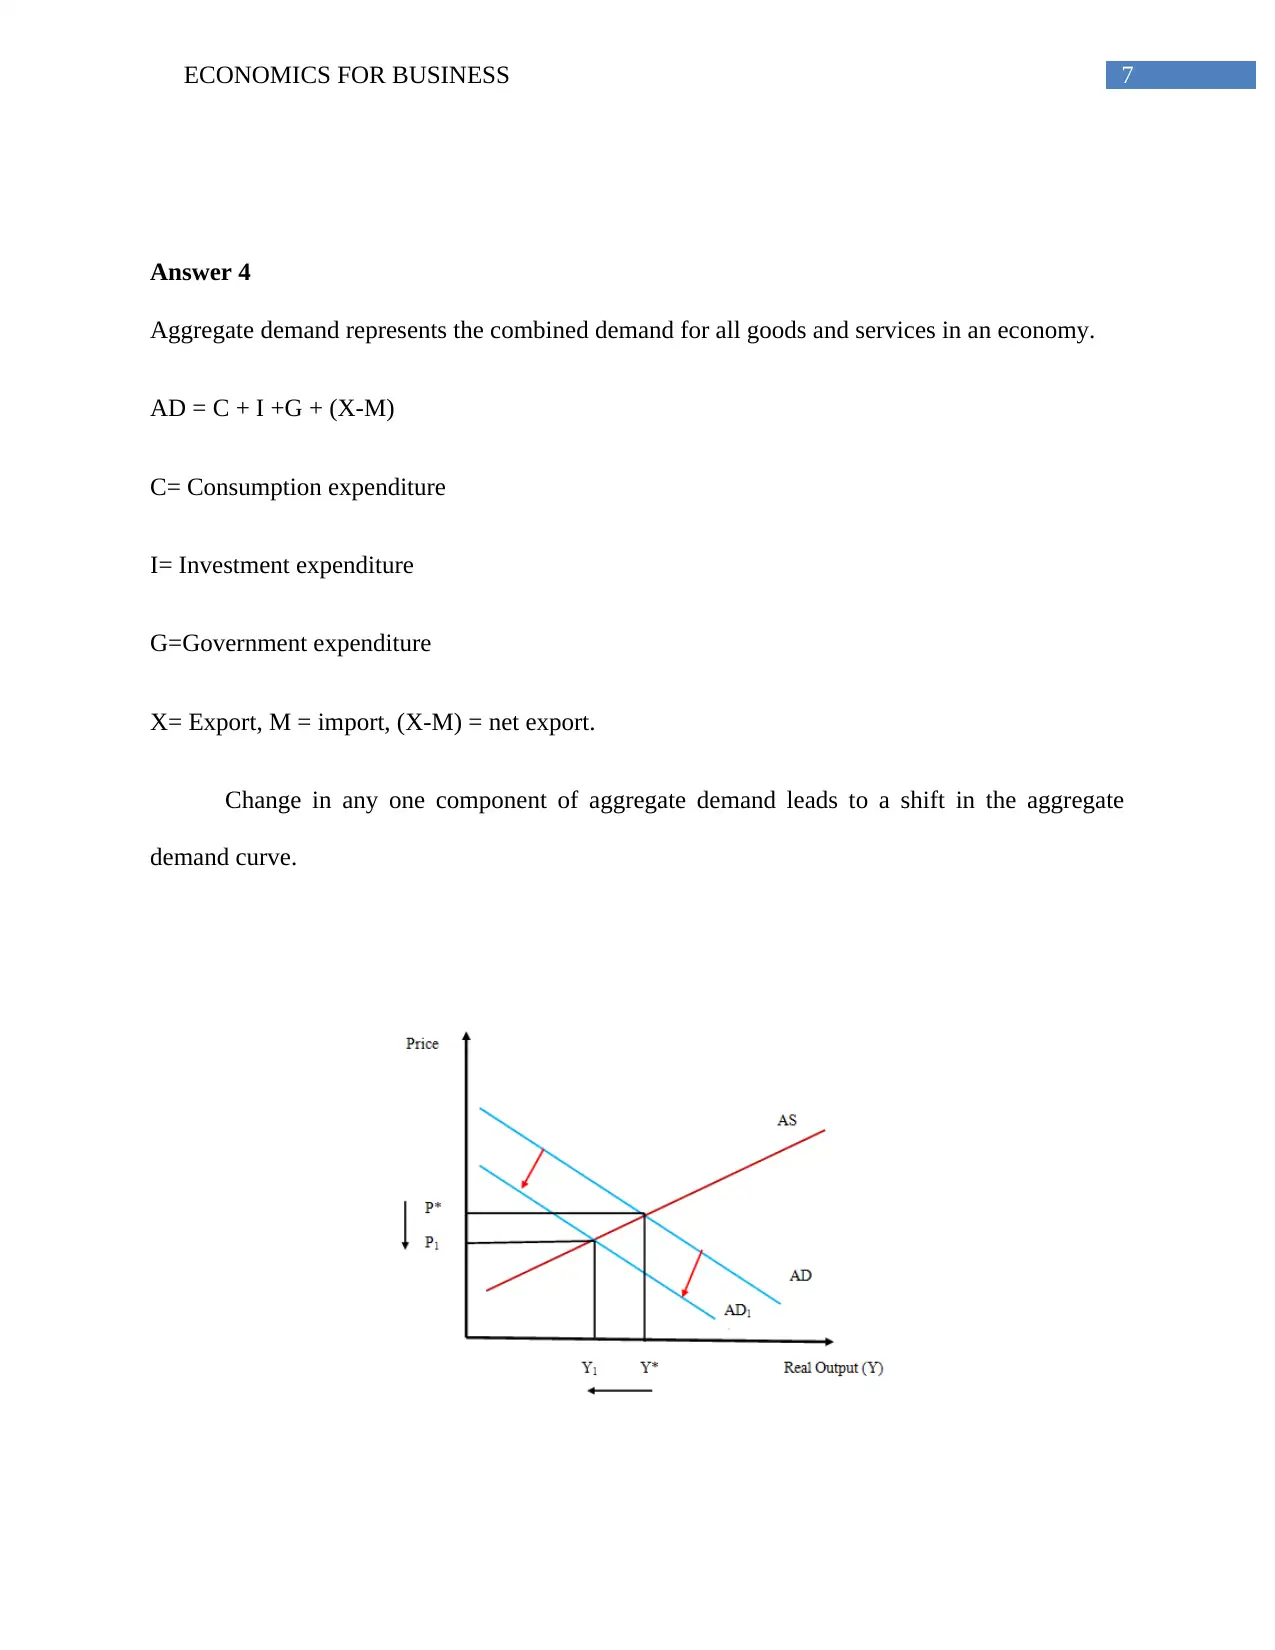
This Economics for Business assignment analyzes key economic concepts including productive and allocative efficiency, comparing competitive firms to monopolies. The assignment examines how competitive firms achieve productive efficiency by operating at the minimum average cost in the long run, and allocative efficiency through price equaling marginal cost, maximizing social welfare. It further compares price and output in competitive versus monopoly markets, highlighting the impact on consumer and producer surplus, and social welfare. The assignment includes an analysis of inflation trends in Pakistan, discussing contributing factors and government interventions. Finally, it explores the effects of a fall in net export demand on aggregate demand, real output, and price levels, using graphical representations to illustrate the concepts.
tabler-icon-diamond-filled.svg

Contribute Materials

Your contribution can guide someone’s learning journey. Share your documents today.
Document Page
Running head: ECONOMICS FOR BUSINESS
Economics for Business
Name of the Student
Name of the University
Author note
tabler-icon-diamond-filled.svg

Secure Best Marks with AI Grader

Need help grading? Try our AI Grader for instant feedback on your assignments.
Document Page
1ECONOMICS FOR BUSINESS
Table of Contents
Answer 2..........................................................................................................................................2
Productive Efficiency..................................................................................................................2
Competitive firm and Productive efficiency................................................................................2
Allocative Efficiency...................................................................................................................3
Competitive firm and Allocative efficiency................................................................................3
Answer 3..........................................................................................................................................4
Price and Output comparison between monopoly and competitive industry..............................4
Inflation in Pakistan.....................................................................................................................5
Answer 4..........................................................................................................................................6
References........................................................................................................................................9
Document Page
2ECONOMICS FOR BUSINESS
Answer 2
Productive Efficiency
Productive efficiency refers to a situation where goods and services are produced with
optimal input combination and are associated with lowest cost. In this condition, increase in
production of one good requires sacrifice of production of some other good. A point on the
production possibility curve is an example of productively efficient point.
Competitive firm and Productive efficiency
Competitive firms achieve productive efficiency in the long- run. The competitive firms,
in the long-run operate at the minimum point of average cost. The productivity efficiency is
achieved because of free entry and exit of firms. If firm operates above the average cost then
there is supernormal profit, which encourages entry of new firms in the industry. On the other
hand, when firm operates below average cost then there is economic loss and then firms exit
from the industry. The adjustment continues until all the firms earn only normal profit by
producing at the minimum point of average cost. Hence, productive efficiency is reached.
Document Page
3ECONOMICS FOR BUSINESS
Figure 1: Productive efficiency for competitive firm
(Source: as created by the Author)
Allocative Efficiency
Allocative efficiency is achieved when among different possible production points
socially preferred point is chosen. Allocative efficiency represents preference of the consumers
and hence is socially optimum production point.
Competitive firm and Allocative efficiency
In a competitive industry firm’s price equals its unit cost of production. Price of good
reflects people’s willingness to for the good and hence is a measure of received social benefit
from the good. In absence of any externality, marginal cost reflects the social cost for production
of the good. The profit maximizing condition that indicates marginal revenue equals marginal
cost reduces to price equals marginal cost for competitive firm. Therefore, the profit maximizing
condition for a competitive firm ensures social benefits matches with social cost and hence
allocative efficiency is achieved.
tabler-icon-diamond-filled.svg

Secure Best Marks with AI Grader

Need help grading? Try our AI Grader for instant feedback on your assignments.
Document Page
4ECONOMICS FOR BUSINESS
Figure 2: Allocative efficiency of competitive firm
(Source: as created by the Author)
In the long run, competitive firm achieves both productive and allocative efficiency
(Decker et al.,2017).
Answer 3
Price and Output comparison between monopoly and competitive industry
Figure 3: Price and Output for monopoly and competitive firm
(Source: As created by the Author)
Price and output combinations are determined at the point of profit maximization. The
profit maximization condition differs in different market depending on feature of the market. The
first order condition for profit maximization is unit cost of production should equal to the
revenue earned from that unit.
Document Page
5ECONOMICS FOR BUSINESS
Competitive firm is a price taker in the market. Hence, price equals to the marginal
revenue. Therefore, competitive firm chooses profit-maximizing points by equating price with
the marginal cost. In figure 3, the competitive firm’s equilibrium point is shown as Ec. Price and
quantity for the competitive firm is Pc and Qc respectively.
Monopolist on the other hand is a price maker in the market. The profit maximization
condition is equality between marginal cost and marginal revenue. In the figure, Em shows the
equilibrium point of operation for the monopolist. Pm is the monopolist’s price and the
corresponding quantity is Qm.
From the figure, it is seen that quantity produced in the competitive market is greater than
that in the monopoly market. Price in the monopoly market is greater than competitive market.
Because of higher price consumer receives lower surplus and producer receives a larger surplus.
However, the entire reduced consumer surplus does not transform to producer surplus. There is
loss in total surplus in a monopoly market results in a social cost or deadweight loss shown by
the triangle.
Inflation in Pakistan
Document Page
6ECONOMICS FOR BUSINESS
Figure 4: Inflation in Pakistan
(Source: tradingeconomics.com)
Figure 4 shows the recent inflation trend in Pakistan. The country has made an overall
improvement in the inflation status. Earlier both the CPI and WPI recorded a double digit of
nearly 11% per annum. Different factors leading to price inflation in Pakistan are a declining g
trend of economic growth, a high rate of tax, depreciation of currency and so on. Both demand
pull inflation resulted from excess money supply and cost push inflation arising out of increasing
cost of production is found to exist in Pakistan. The state Bank of Pakistan sets an inflation target
of 5% per annum. The targeted inflation was achieved by 2000 and the price level remained
almost stable until 2003. However, price jumped to an excessively high level because of a
shortage in agricultural output due to flood in 2010. Thereafter, Pakistan government has taken
several steps to reduce inflation rate. The government has relaxed import restriction to maintain a
steady flow of important commodities in the nation. In the inflation targeting priority has been
given to agricultural sector to stabilize food prices. Additionally, inclusive growth strategy is
followed by the government giving special attention to pro poor.
tabler-icon-diamond-filled.svg

Paraphrase This Document

Need a fresh take? Get an instant paraphrase of this document with our AI Paraphraser
Document Page
7ECONOMICS FOR BUSINESS
Answer 4
Aggregate demand represents the combined demand for all goods and services in an economy.
AD = C + I +G + (X-M)
C= Consumption expenditure
I= Investment expenditure
G=Government expenditure
X= Export, M = import, (X-M) = net export.
Change in any one component of aggregate demand leads to a shift in the aggregate
demand curve.
Document Page
8ECONOMICS FOR BUSINESS
Figure 5: effect of a fall in net export demand
(Source: As created by the Author)
A fall in export demand will lead to a reduction in export earnings of German. This
implies a fall in net export. As a result, aggregate demand falls and there will be a leftward shift
in the aggregate demand curve. The initial aggregate demand curve is AD as shown in figure 5.
Real output and price level are determined where aggregate demand and aggregate supply curve
intersects. Correspondingly, real output is Y* and price level is at P*. With a fall in export
demand, the demand curve will shift inward and the new demand curve is AD1. A decline in
aggregate demand leads to a decline in both output and price. Output reduces from Y* to Y1.
Price level reduces from P* to P1. Therefore, both real output and price declines with a decline in
export demand.
chevron_up_icon
1 out of 9
circle_padding
hide_on_mobile
zoom_out_icon
logo.png

Your All-in-One AI-Powered Toolkit for Academic Success.

Available 24*7 on WhatsApp / Email

[object Object]