Comprehensive Budget Evaluation and Analysis Report
VerifiedAdded on 2020/05/01
|15
|2844
|53
Report
AI Summary
This report provides a comprehensive evaluation of a budget, analyzing various financial aspects. It begins with a sales budget, production budget, direct material purchases budget, direct labor budget, and manufacturing overhead budget, detailing projected figures for January, February, and March. The report then calculates the ending finished goods inventory budget and the cost of goods sold budget. An income statement and a cash budget are presented to assess financial performance. The analysis includes a comparison of production costs with and without a new manufacturing facility. Variance analysis is conducted on sales, material prices, material usage, direct labor rates, and efficiency. Finally, the report discusses the implications of imposed versus participative budgetary approaches and their impact on management and staff, using Paulo as a case study.
Running head: AN EVALUATION OF BUDGET
An evaluation of Budget
Student’s Name:
University Name:
Author Note
An evaluation of Budget
Student’s Name:
University Name:
Author Note
Paraphrase This Document
Need a fresh take? Get an instant paraphrase of this document with our AI Paraphraser
1AN EVALUATION OF BUDGET
Table of Contents
Part A...............................................................................................................................................2
Answer to Part a...........................................................................................................................2
Answer to Part b..........................................................................................................................2
Answer to Part c...........................................................................................................................2
Answer to Part d..........................................................................................................................3
Answer to Part e...........................................................................................................................4
Answer to Part f...........................................................................................................................4
Answer to Part g..........................................................................................................................5
Answer to Part h..........................................................................................................................6
Answer to Part i...........................................................................................................................6
Workings......................................................................................................................................7
Part B...............................................................................................................................................8
Part C...............................................................................................................................................9
Part D.............................................................................................................................................12
References......................................................................................................................................14
2AN EVALUATION OF BUDGET
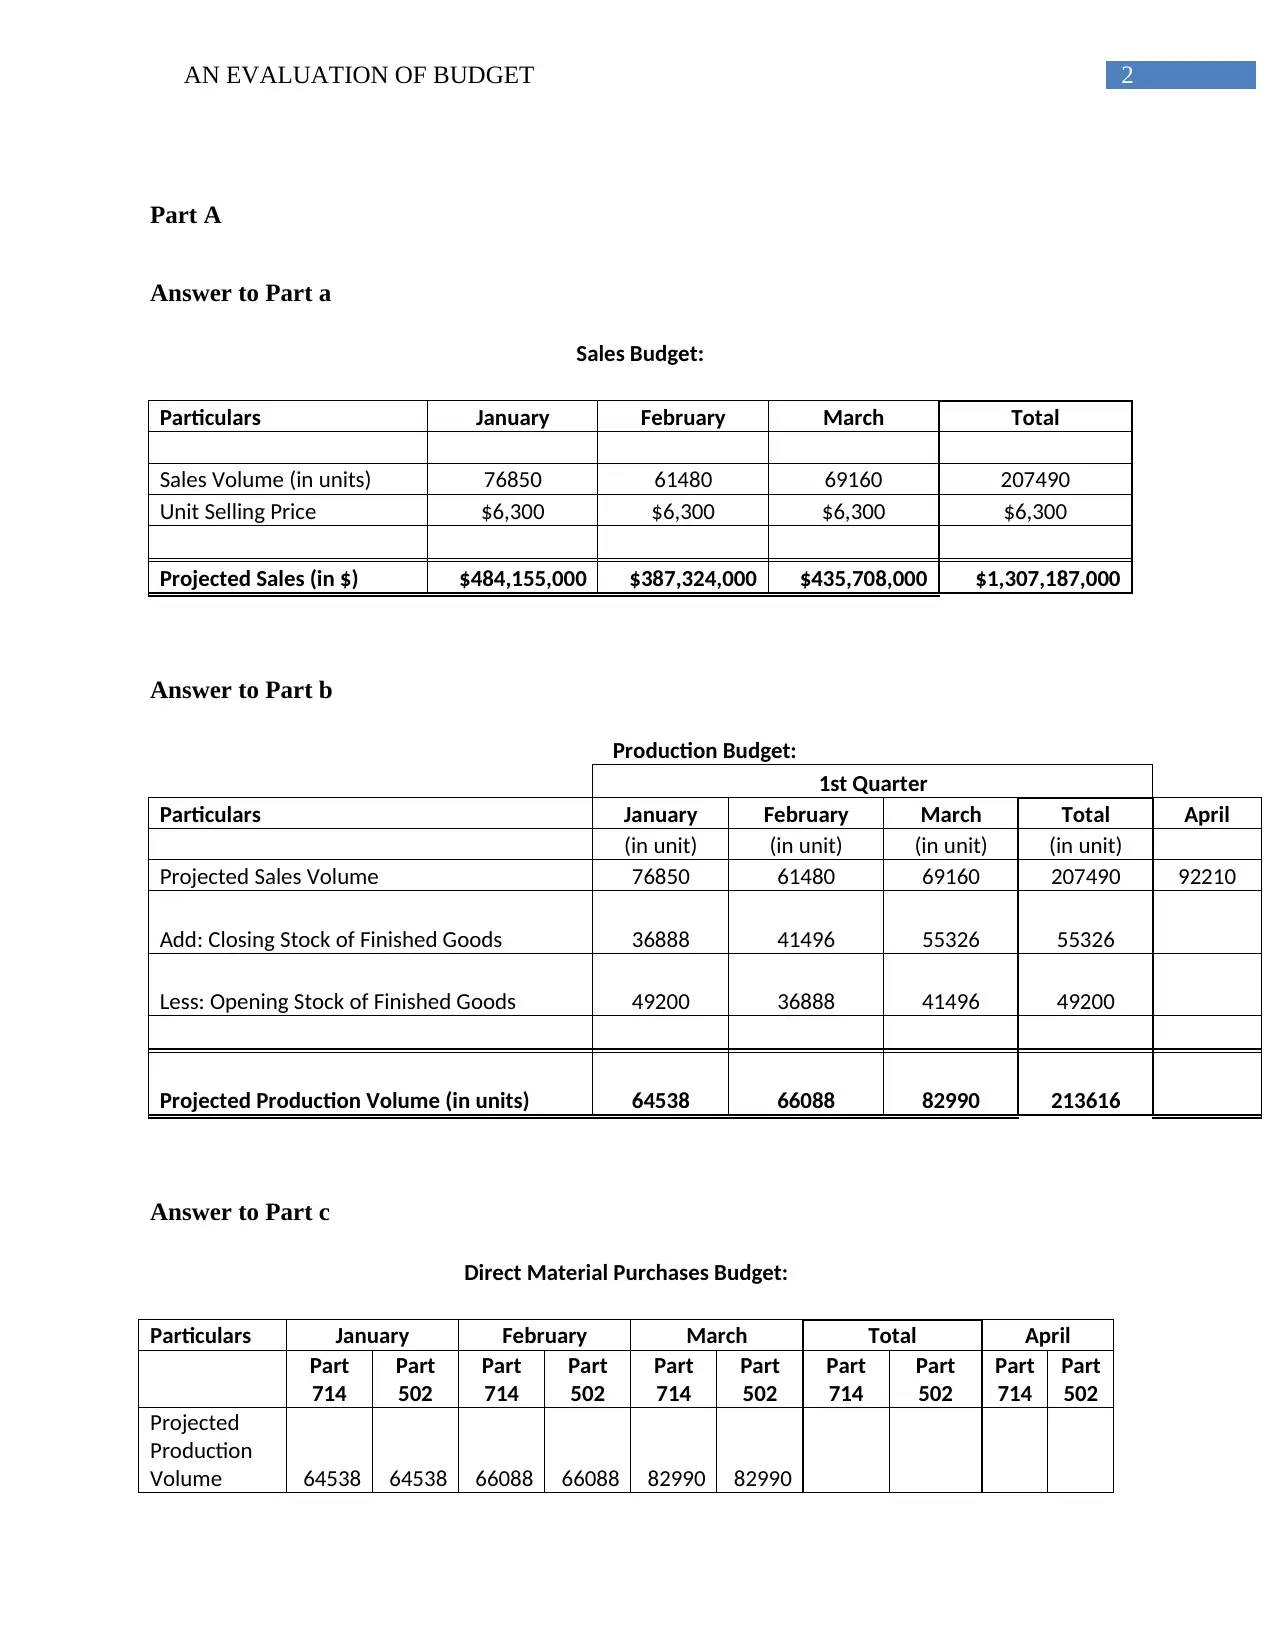
Part A
Answer to Part a
Sales Budget:
Particulars January February March Total
Sales Volume (in units) 76850 61480 69160 207490
Unit Selling Price $6,300 $6,300 $6,300 $6,300
Projected Sales (in $) $484,155,000 $387,324,000 $435,708,000 $1,307,187,000
Answer to Part b
Production Budget:
1st Quarter
Particulars January February March Total April
(in unit) (in unit) (in unit) (in unit)
Projected Sales Volume 76850 61480 69160 207490 92210
Add: Closing Stock of Finished Goods 36888 41496 55326 55326
Less: Opening Stock of Finished Goods 49200 36888 41496 49200
Projected Production Volume (in units) 64538 66088 82990 213616
Answer to Part c
Direct Material Purchases Budget:
Particulars January February March Total April
Part
714
Part
502
Part
714
Part
502
Part
714
Part
502
Part
714
Part
502
Part
714
Part
502
Projected
Production
Volume 64538 64538 66088 66088 82990 82990
⊘ This is a preview!⊘
Do you want full access?
Subscribe today to unlock all pages.
Trusted by 1+ million students worldwide
3AN EVALUATION OF BUDGET
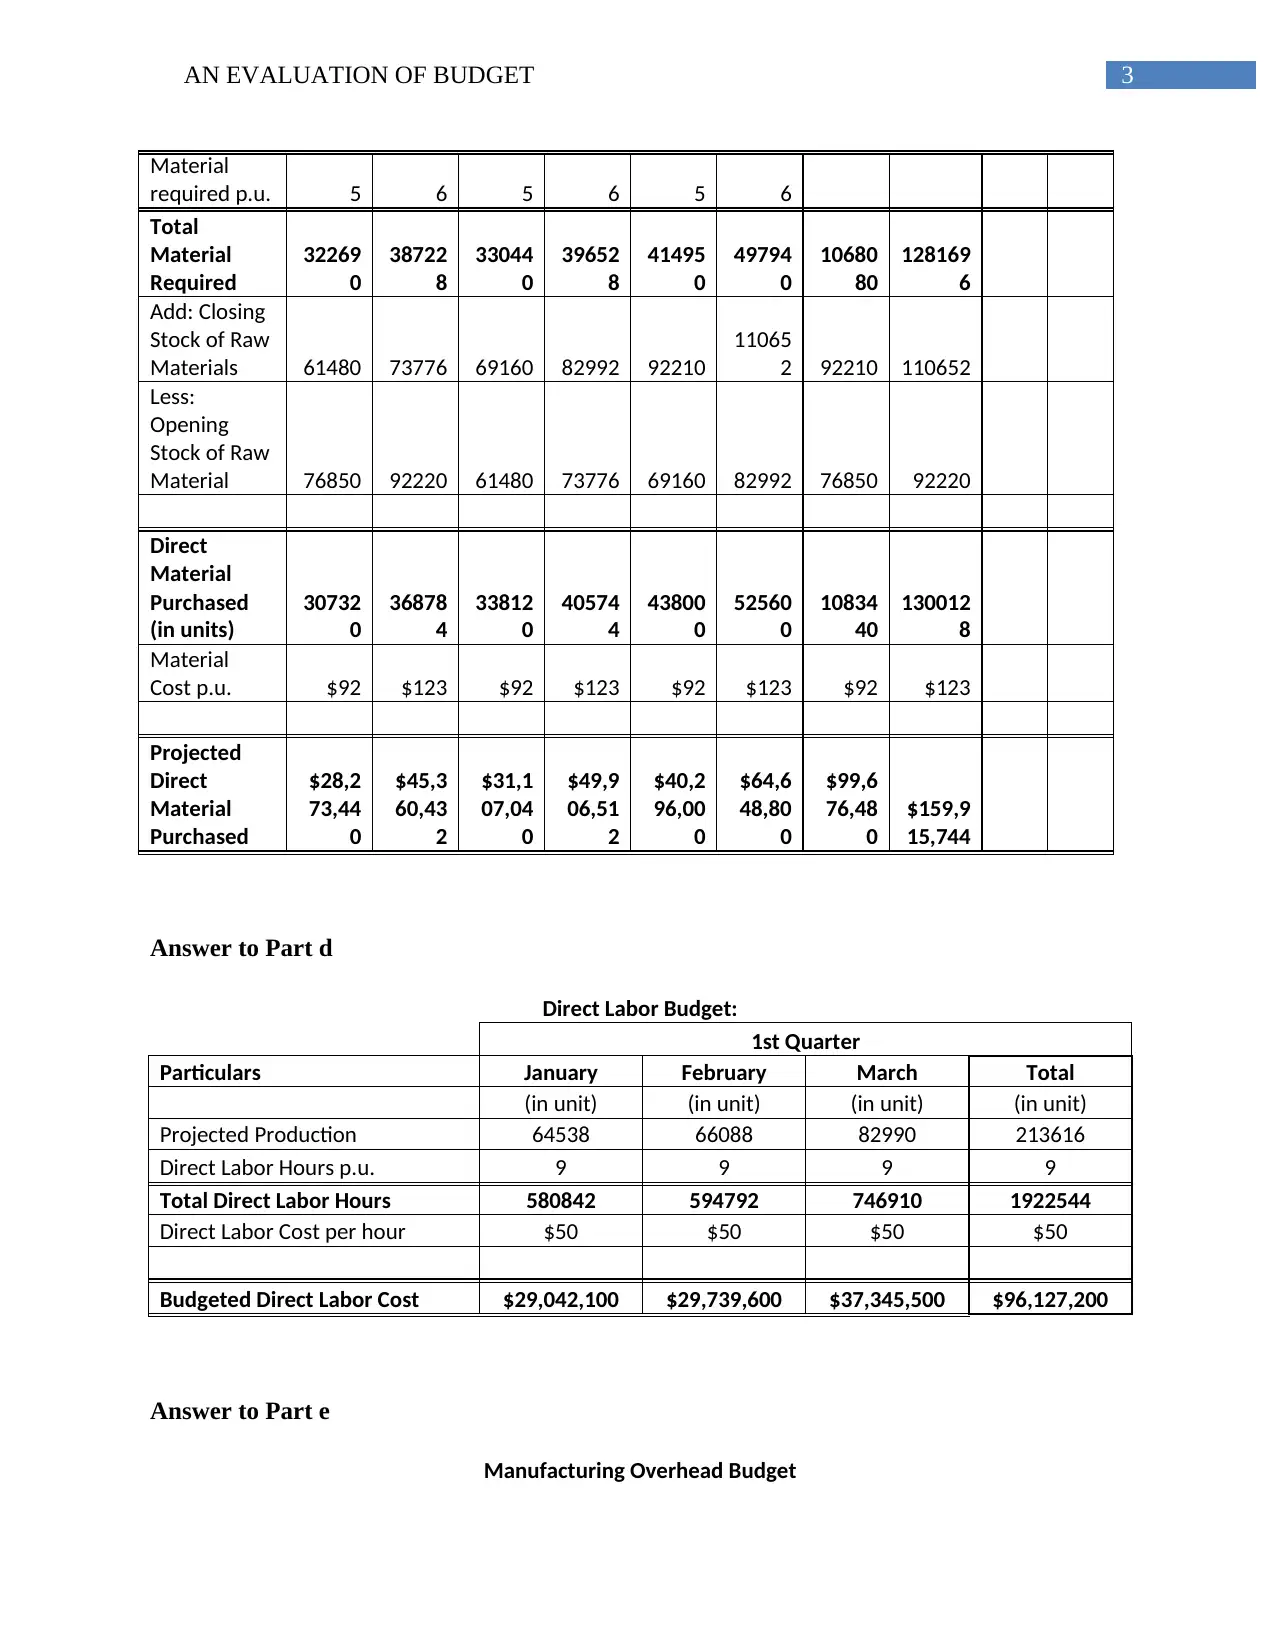
Material
required p.u. 5 6 5 6 5 6
Total
Material
Required
32269
0
38722
8
33044
0
39652
8
41495
0
49794
0
10680
80
128169
6
Add: Closing
Stock of Raw
Materials 61480 73776 69160 82992 92210
11065
2 92210 110652
Less:
Opening
Stock of Raw
Material 76850 92220 61480 73776 69160 82992 76850 92220
Direct
Material
Purchased
(in units)
30732
0
36878
4
33812
0
40574
4
43800
0
52560
0
10834
40
130012
8
Material
Cost p.u. $92 $123 $92 $123 $92 $123 $92 $123
Projected
Direct
Material
Purchased
$28,2
73,44
0
$45,3
60,43
2
$31,1
07,04
0
$49,9
06,51
2
$40,2
96,00
0
$64,6
48,80
0
$99,6
76,48
0
$159,9
15,744
Answer to Part d
Direct Labor Budget:
1st Quarter
Particulars January February March Total
(in unit) (in unit) (in unit) (in unit)
Projected Production 64538 66088 82990 213616
Direct Labor Hours p.u. 9 9 9 9
Total Direct Labor Hours 580842 594792 746910 1922544
Direct Labor Cost per hour $50 $50 $50 $50
Budgeted Direct Labor Cost $29,042,100 $29,739,600 $37,345,500 $96,127,200
Answer to Part e
Manufacturing Overhead Budget
Material
required p.u. 5 6 5 6 5 6
Total
Material
Required
32269
0
38722
8
33044
0
39652
8
41495
0
49794
0
10680
80
128169
6
Add: Closing
Stock of Raw
Materials 61480 73776 69160 82992 92210
11065
2 92210 110652
Less:
Opening
Stock of Raw
Material 76850 92220 61480 73776 69160 82992 76850 92220
Direct
Material
Purchased
(in units)
30732
0
36878
4
33812
0
40574
4
43800
0
52560
0
10834
40
130012
8
Material
Cost p.u. $92 $123 $92 $123 $92 $123 $92 $123
Projected
Direct
Material
Purchased
$28,2
73,44
0
$45,3
60,43
2
$31,1
07,04
0
$49,9
06,51
2
$40,2
96,00
0
$64,6
48,80
0
$99,6
76,48
0
$159,9
15,744
Answer to Part d
Direct Labor Budget:
1st Quarter
Particulars January February March Total
(in unit) (in unit) (in unit) (in unit)
Projected Production 64538 66088 82990 213616
Direct Labor Hours p.u. 9 9 9 9
Total Direct Labor Hours 580842 594792 746910 1922544
Direct Labor Cost per hour $50 $50 $50 $50
Budgeted Direct Labor Cost $29,042,100 $29,739,600 $37,345,500 $96,127,200
Answer to Part e
Manufacturing Overhead Budget
Paraphrase This Document
Need a fresh take? Get an instant paraphrase of this document with our AI Paraphraser
4AN EVALUATION OF BUDGET
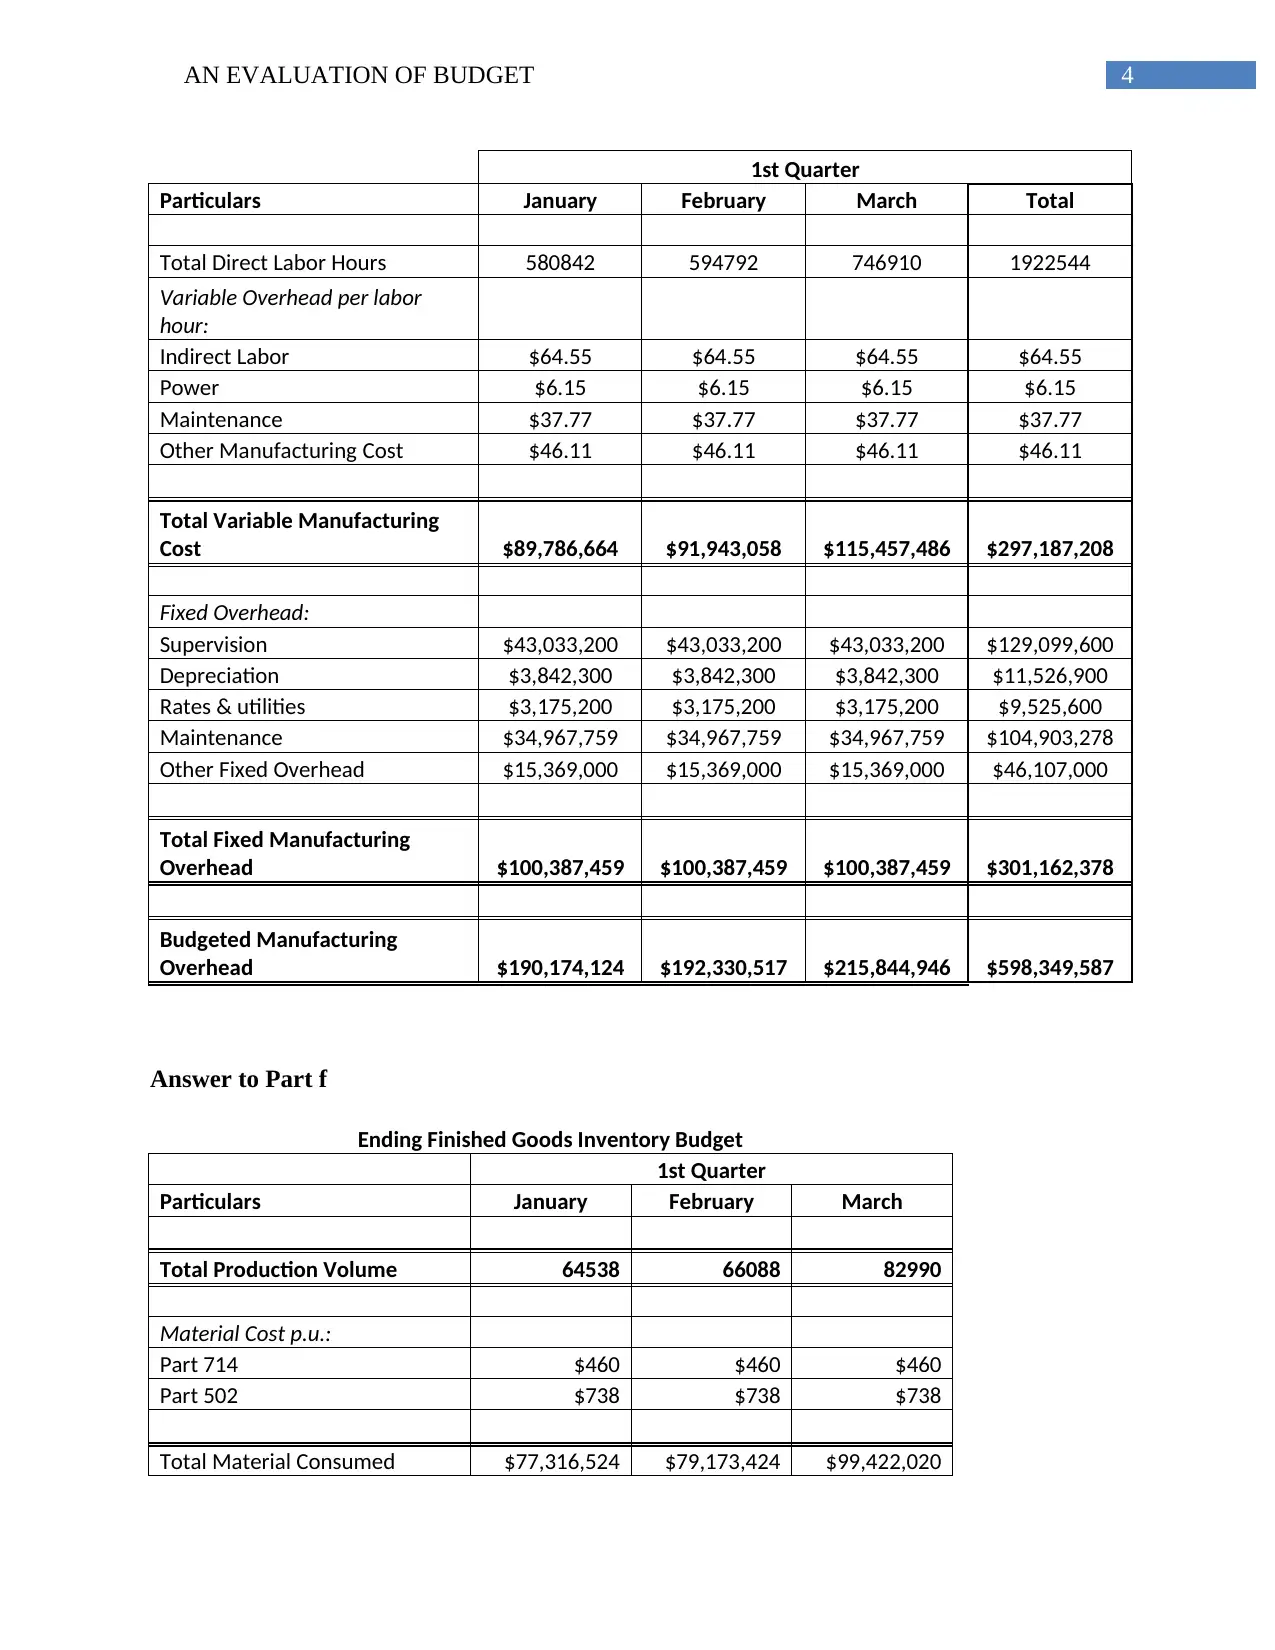
1st Quarter
Particulars January February March Total
Total Direct Labor Hours 580842 594792 746910 1922544
Variable Overhead per labor
hour:
Indirect Labor $64.55 $64.55 $64.55 $64.55
Power $6.15 $6.15 $6.15 $6.15
Maintenance $37.77 $37.77 $37.77 $37.77
Other Manufacturing Cost $46.11 $46.11 $46.11 $46.11
Total Variable Manufacturing
Cost $89,786,664 $91,943,058 $115,457,486 $297,187,208
Fixed Overhead:
Supervision $43,033,200 $43,033,200 $43,033,200 $129,099,600
Depreciation $3,842,300 $3,842,300 $3,842,300 $11,526,900
Rates & utilities $3,175,200 $3,175,200 $3,175,200 $9,525,600
Maintenance $34,967,759 $34,967,759 $34,967,759 $104,903,278
Other Fixed Overhead $15,369,000 $15,369,000 $15,369,000 $46,107,000
Total Fixed Manufacturing
Overhead $100,387,459 $100,387,459 $100,387,459 $301,162,378
Budgeted Manufacturing
Overhead $190,174,124 $192,330,517 $215,844,946 $598,349,587
Answer to Part f
Ending Finished Goods Inventory Budget
1st Quarter
Particulars January February March
Total Production Volume 64538 66088 82990
Material Cost p.u.:
Part 714 $460 $460 $460
Part 502 $738 $738 $738
Total Material Consumed $77,316,524 $79,173,424 $99,422,020
1st Quarter
Particulars January February March Total
Total Direct Labor Hours 580842 594792 746910 1922544
Variable Overhead per labor
hour:
Indirect Labor $64.55 $64.55 $64.55 $64.55
Power $6.15 $6.15 $6.15 $6.15
Maintenance $37.77 $37.77 $37.77 $37.77
Other Manufacturing Cost $46.11 $46.11 $46.11 $46.11
Total Variable Manufacturing
Cost $89,786,664 $91,943,058 $115,457,486 $297,187,208
Fixed Overhead:
Supervision $43,033,200 $43,033,200 $43,033,200 $129,099,600
Depreciation $3,842,300 $3,842,300 $3,842,300 $11,526,900
Rates & utilities $3,175,200 $3,175,200 $3,175,200 $9,525,600
Maintenance $34,967,759 $34,967,759 $34,967,759 $104,903,278
Other Fixed Overhead $15,369,000 $15,369,000 $15,369,000 $46,107,000
Total Fixed Manufacturing
Overhead $100,387,459 $100,387,459 $100,387,459 $301,162,378
Budgeted Manufacturing
Overhead $190,174,124 $192,330,517 $215,844,946 $598,349,587
Answer to Part f
Ending Finished Goods Inventory Budget
1st Quarter
Particulars January February March
Total Production Volume 64538 66088 82990
Material Cost p.u.:
Part 714 $460 $460 $460
Part 502 $738 $738 $738
Total Material Consumed $77,316,524 $79,173,424 $99,422,020
5AN EVALUATION OF BUDGET
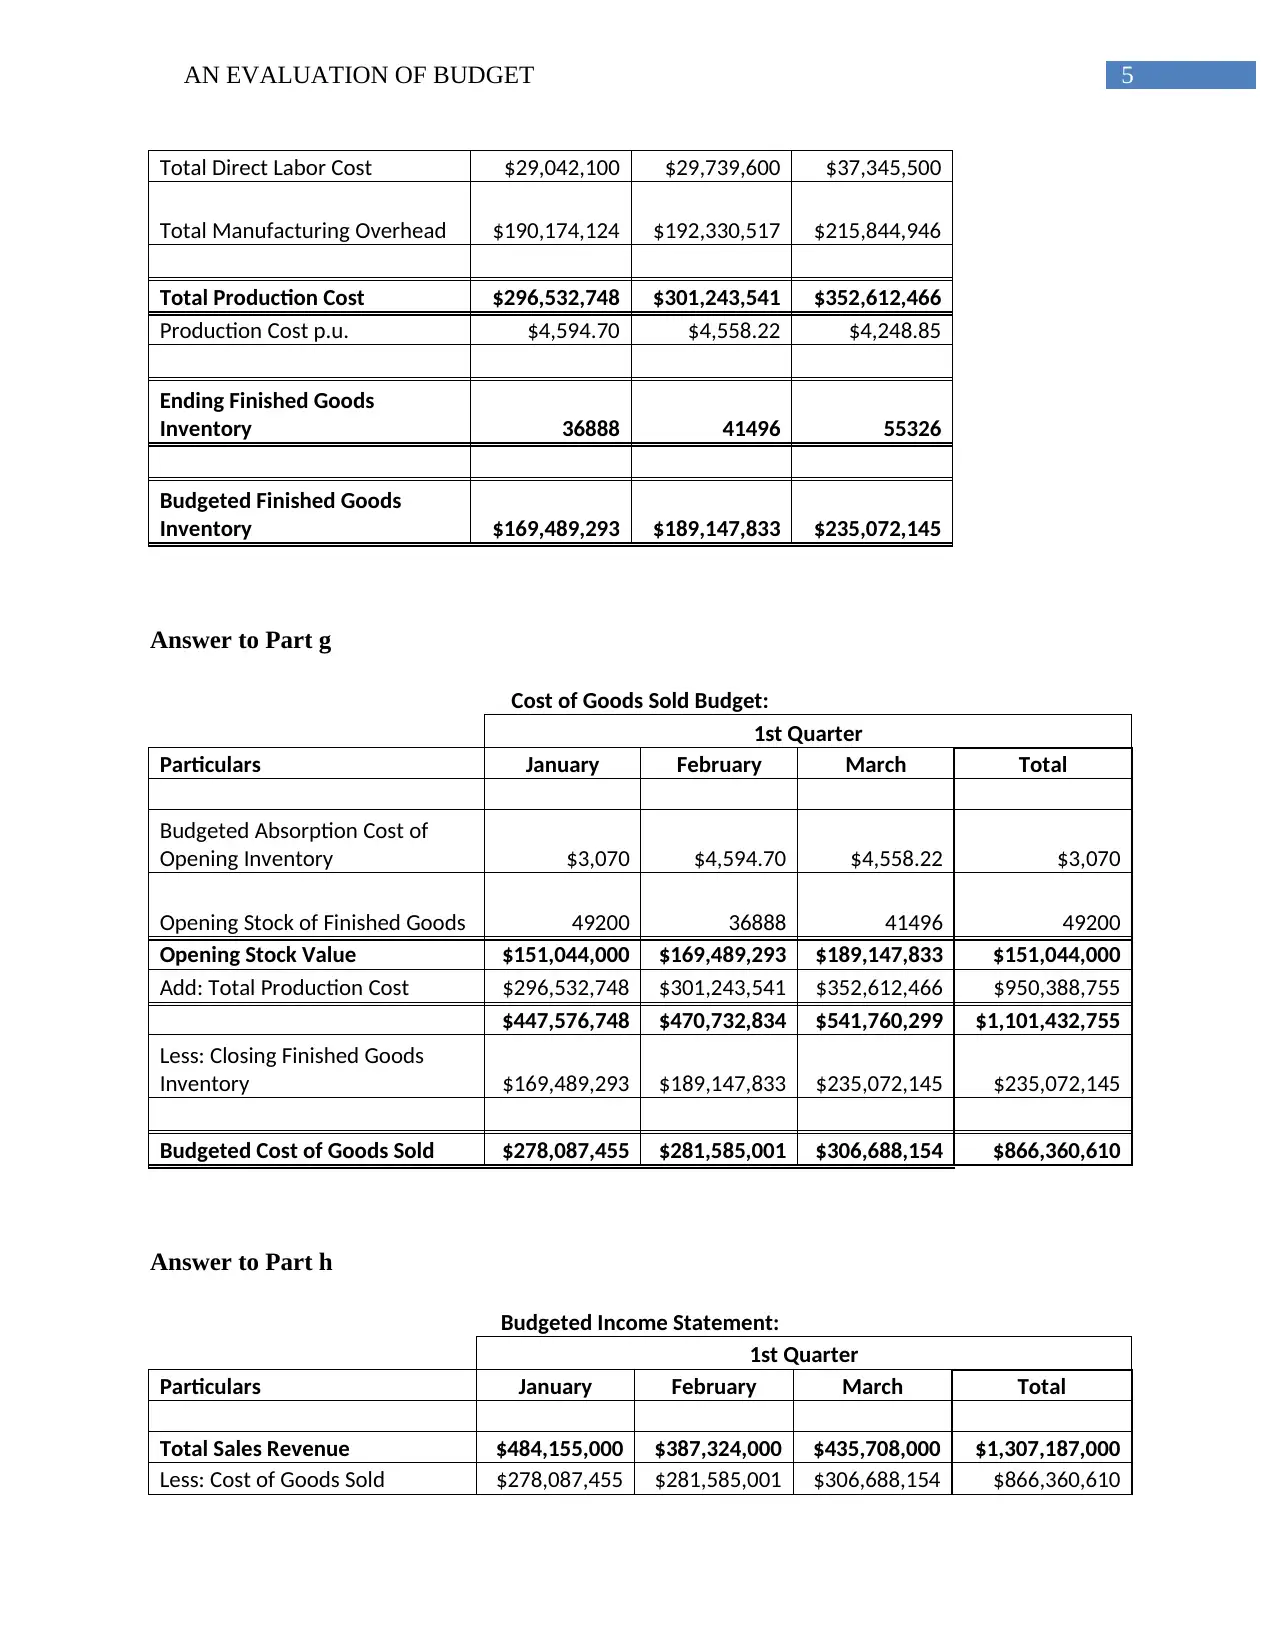
Total Direct Labor Cost $29,042,100 $29,739,600 $37,345,500
Total Manufacturing Overhead $190,174,124 $192,330,517 $215,844,946
Total Production Cost $296,532,748 $301,243,541 $352,612,466
Production Cost p.u. $4,594.70 $4,558.22 $4,248.85
Ending Finished Goods
Inventory 36888 41496 55326
Budgeted Finished Goods
Inventory $169,489,293 $189,147,833 $235,072,145
Answer to Part g
Cost of Goods Sold Budget:
1st Quarter
Particulars January February March Total
Budgeted Absorption Cost of
Opening Inventory $3,070 $4,594.70 $4,558.22 $3,070
Opening Stock of Finished Goods 49200 36888 41496 49200
Opening Stock Value $151,044,000 $169,489,293 $189,147,833 $151,044,000
Add: Total Production Cost $296,532,748 $301,243,541 $352,612,466 $950,388,755
$447,576,748 $470,732,834 $541,760,299 $1,101,432,755
Less: Closing Finished Goods
Inventory $169,489,293 $189,147,833 $235,072,145 $235,072,145
Budgeted Cost of Goods Sold $278,087,455 $281,585,001 $306,688,154 $866,360,610
Answer to Part h
Budgeted Income Statement:
1st Quarter
Particulars January February March Total
Total Sales Revenue $484,155,000 $387,324,000 $435,708,000 $1,307,187,000
Less: Cost of Goods Sold $278,087,455 $281,585,001 $306,688,154 $866,360,610
⊘ This is a preview!⊘
Do you want full access?
Subscribe today to unlock all pages.
Trusted by 1+ million students worldwide
6AN EVALUATION OF BUDGET
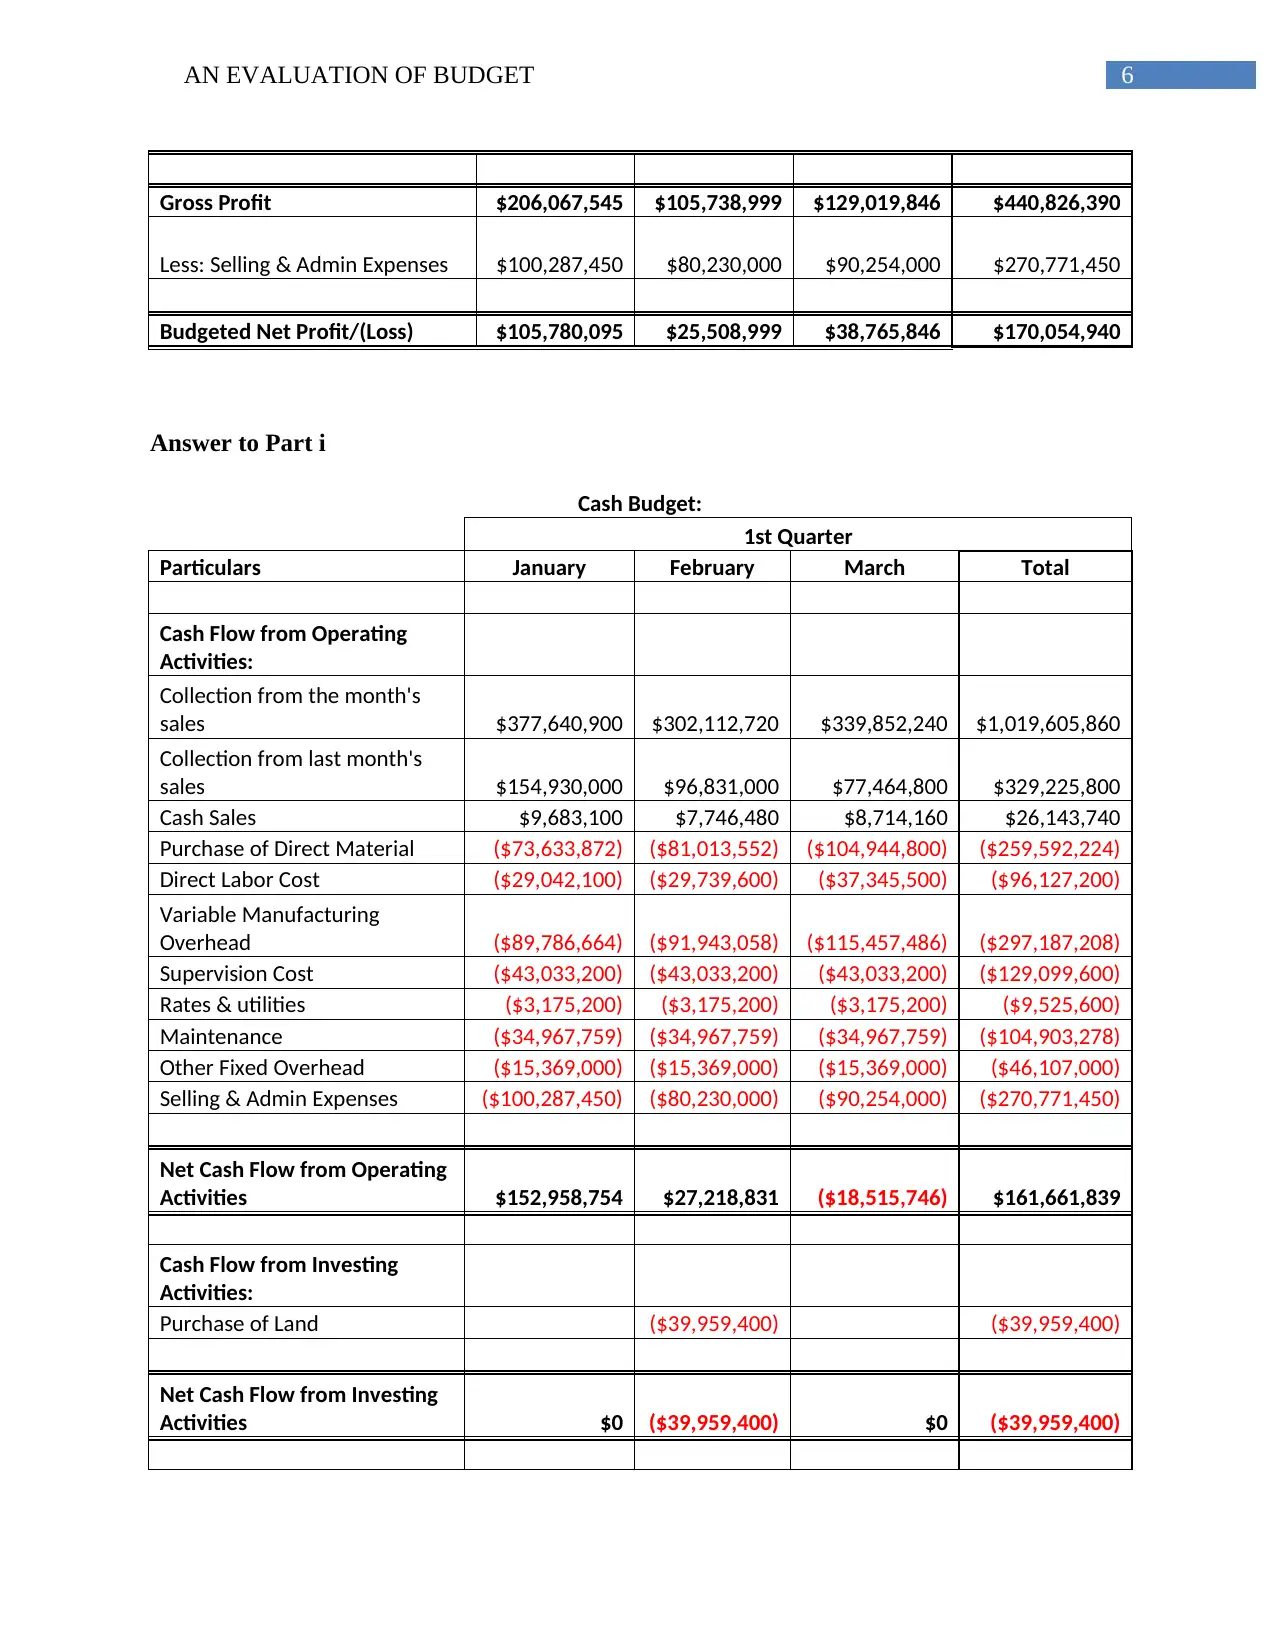
Gross Profit $206,067,545 $105,738,999 $129,019,846 $440,826,390
Less: Selling & Admin Expenses $100,287,450 $80,230,000 $90,254,000 $270,771,450
Budgeted Net Profit/(Loss) $105,780,095 $25,508,999 $38,765,846 $170,054,940
Answer to Part i
Cash Budget:
1st Quarter
Particulars January February March Total
Cash Flow from Operating
Activities:
Collection from the month's
sales $377,640,900 $302,112,720 $339,852,240 $1,019,605,860
Collection from last month's
sales $154,930,000 $96,831,000 $77,464,800 $329,225,800
Cash Sales $9,683,100 $7,746,480 $8,714,160 $26,143,740
Purchase of Direct Material ($73,633,872) ($81,013,552) ($104,944,800) ($259,592,224)
Direct Labor Cost ($29,042,100) ($29,739,600) ($37,345,500) ($96,127,200)
Variable Manufacturing
Overhead ($89,786,664) ($91,943,058) ($115,457,486) ($297,187,208)
Supervision Cost ($43,033,200) ($43,033,200) ($43,033,200) ($129,099,600)
Rates & utilities ($3,175,200) ($3,175,200) ($3,175,200) ($9,525,600)
Maintenance ($34,967,759) ($34,967,759) ($34,967,759) ($104,903,278)
Other Fixed Overhead ($15,369,000) ($15,369,000) ($15,369,000) ($46,107,000)
Selling & Admin Expenses ($100,287,450) ($80,230,000) ($90,254,000) ($270,771,450)
Net Cash Flow from Operating
Activities $152,958,754 $27,218,831 ($18,515,746) $161,661,839
Cash Flow from Investing
Activities:
Purchase of Land ($39,959,400) ($39,959,400)
Net Cash Flow from Investing
Activities $0 ($39,959,400) $0 ($39,959,400)
Paraphrase This Document
Need a fresh take? Get an instant paraphrase of this document with our AI Paraphraser
7AN EVALUATION OF BUDGET
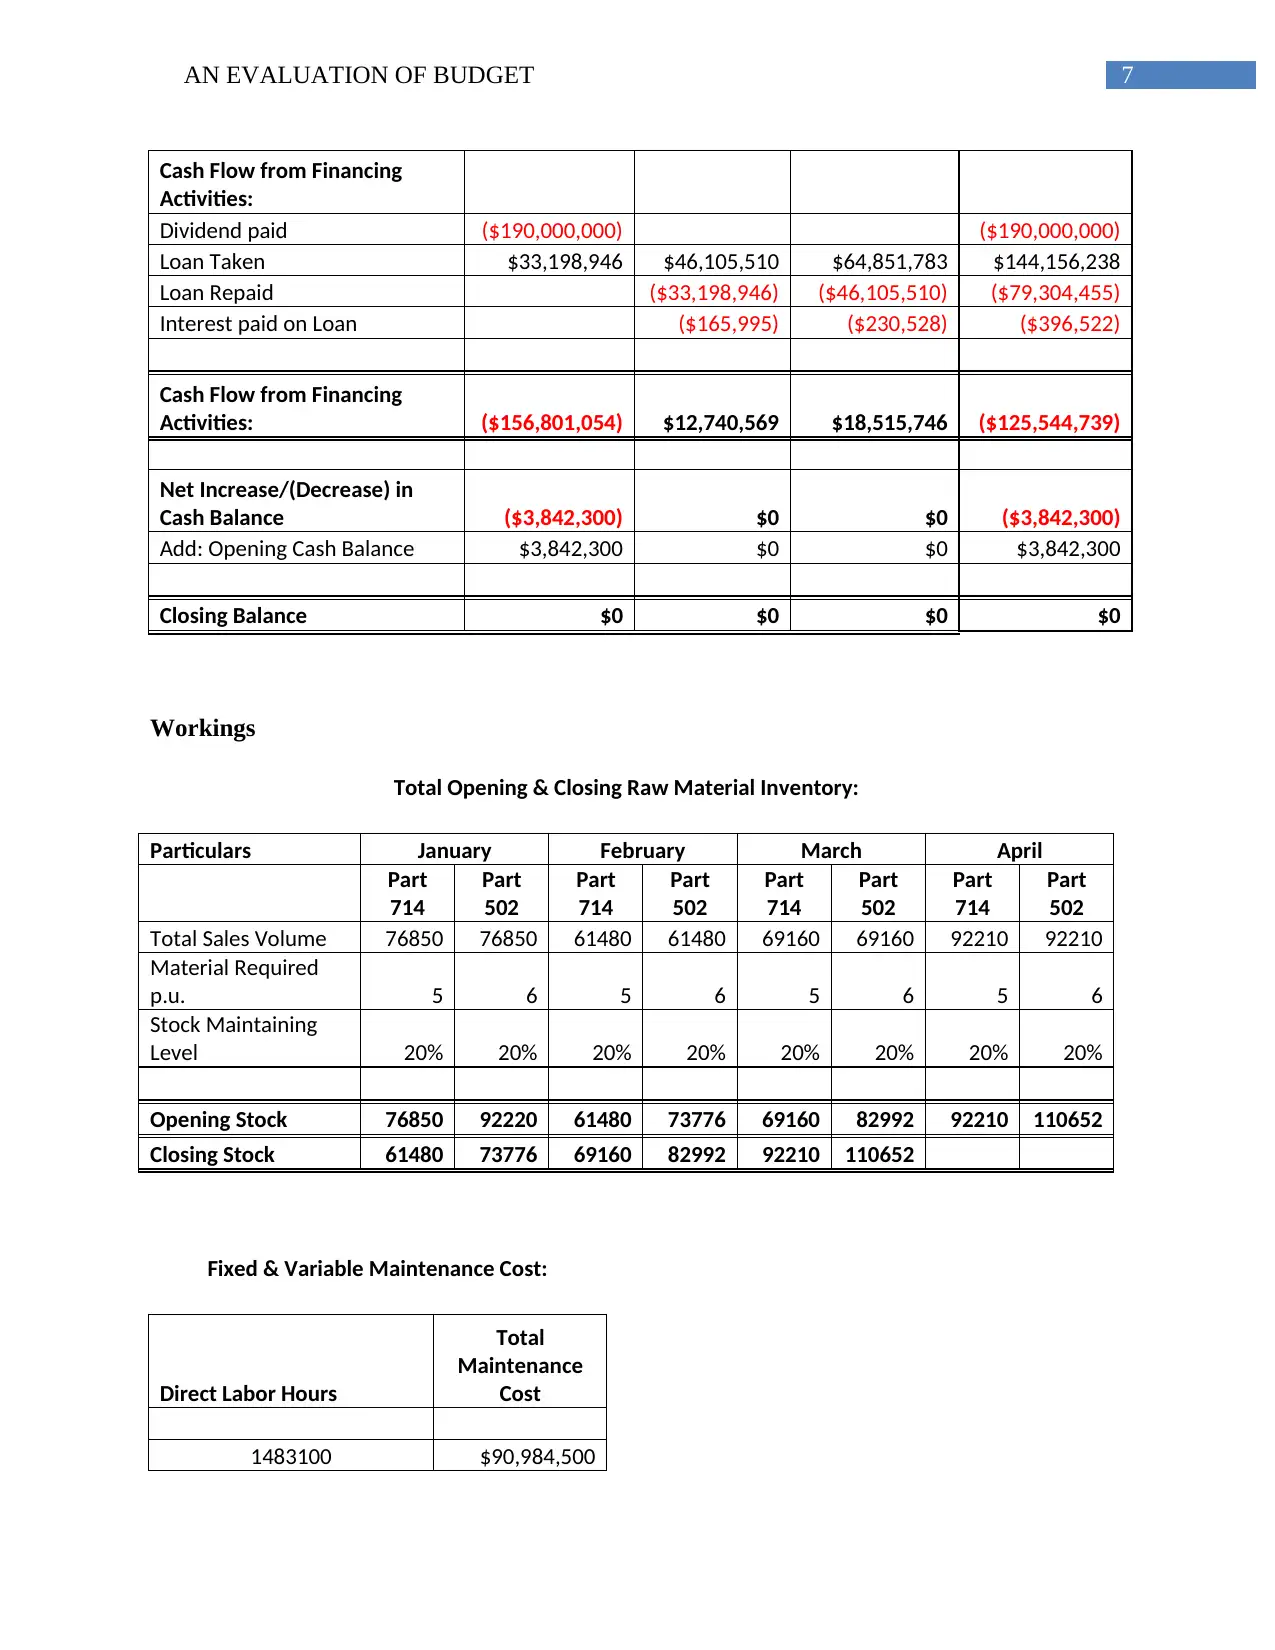
Cash Flow from Financing
Activities:
Dividend paid ($190,000,000) ($190,000,000)
Loan Taken $33,198,946 $46,105,510 $64,851,783 $144,156,238
Loan Repaid ($33,198,946) ($46,105,510) ($79,304,455)
Interest paid on Loan ($165,995) ($230,528) ($396,522)
Cash Flow from Financing
Activities: ($156,801,054) $12,740,569 $18,515,746 ($125,544,739)
Net Increase/(Decrease) in
Cash Balance ($3,842,300) $0 $0 ($3,842,300)
Add: Opening Cash Balance $3,842,300 $0 $0 $3,842,300
Closing Balance $0 $0 $0 $0
Workings
Total Opening & Closing Raw Material Inventory:
Particulars January February March April
Part
714
Part
502
Part
714
Part
502
Part
714
Part
502
Part
714
Part
502
Total Sales Volume 76850 76850 61480 61480 69160 69160 92210 92210
Material Required
p.u. 5 6 5 6 5 6 5 6
Stock Maintaining
Level 20% 20% 20% 20% 20% 20% 20% 20%
Opening Stock 76850 92220 61480 73776 69160 82992 92210 110652
Closing Stock 61480 73776 69160 82992 92210 110652
Fixed & Variable Maintenance Cost:
Direct Labor Hours
Total
Maintenance
Cost
1483100 $90,984,500
Cash Flow from Financing
Activities:
Dividend paid ($190,000,000) ($190,000,000)
Loan Taken $33,198,946 $46,105,510 $64,851,783 $144,156,238
Loan Repaid ($33,198,946) ($46,105,510) ($79,304,455)
Interest paid on Loan ($165,995) ($230,528) ($396,522)
Cash Flow from Financing
Activities: ($156,801,054) $12,740,569 $18,515,746 ($125,544,739)
Net Increase/(Decrease) in
Cash Balance ($3,842,300) $0 $0 ($3,842,300)
Add: Opening Cash Balance $3,842,300 $0 $0 $3,842,300
Closing Balance $0 $0 $0 $0
Workings
Total Opening & Closing Raw Material Inventory:
Particulars January February March April
Part
714
Part
502
Part
714
Part
502
Part
714
Part
502
Part
714
Part
502
Total Sales Volume 76850 76850 61480 61480 69160 69160 92210 92210
Material Required
p.u. 5 6 5 6 5 6 5 6
Stock Maintaining
Level 20% 20% 20% 20% 20% 20% 20% 20%
Opening Stock 76850 92220 61480 73776 69160 82992 92210 110652
Closing Stock 61480 73776 69160 82992 92210 110652
Fixed & Variable Maintenance Cost:
Direct Labor Hours
Total
Maintenance
Cost
1483100 $90,984,500
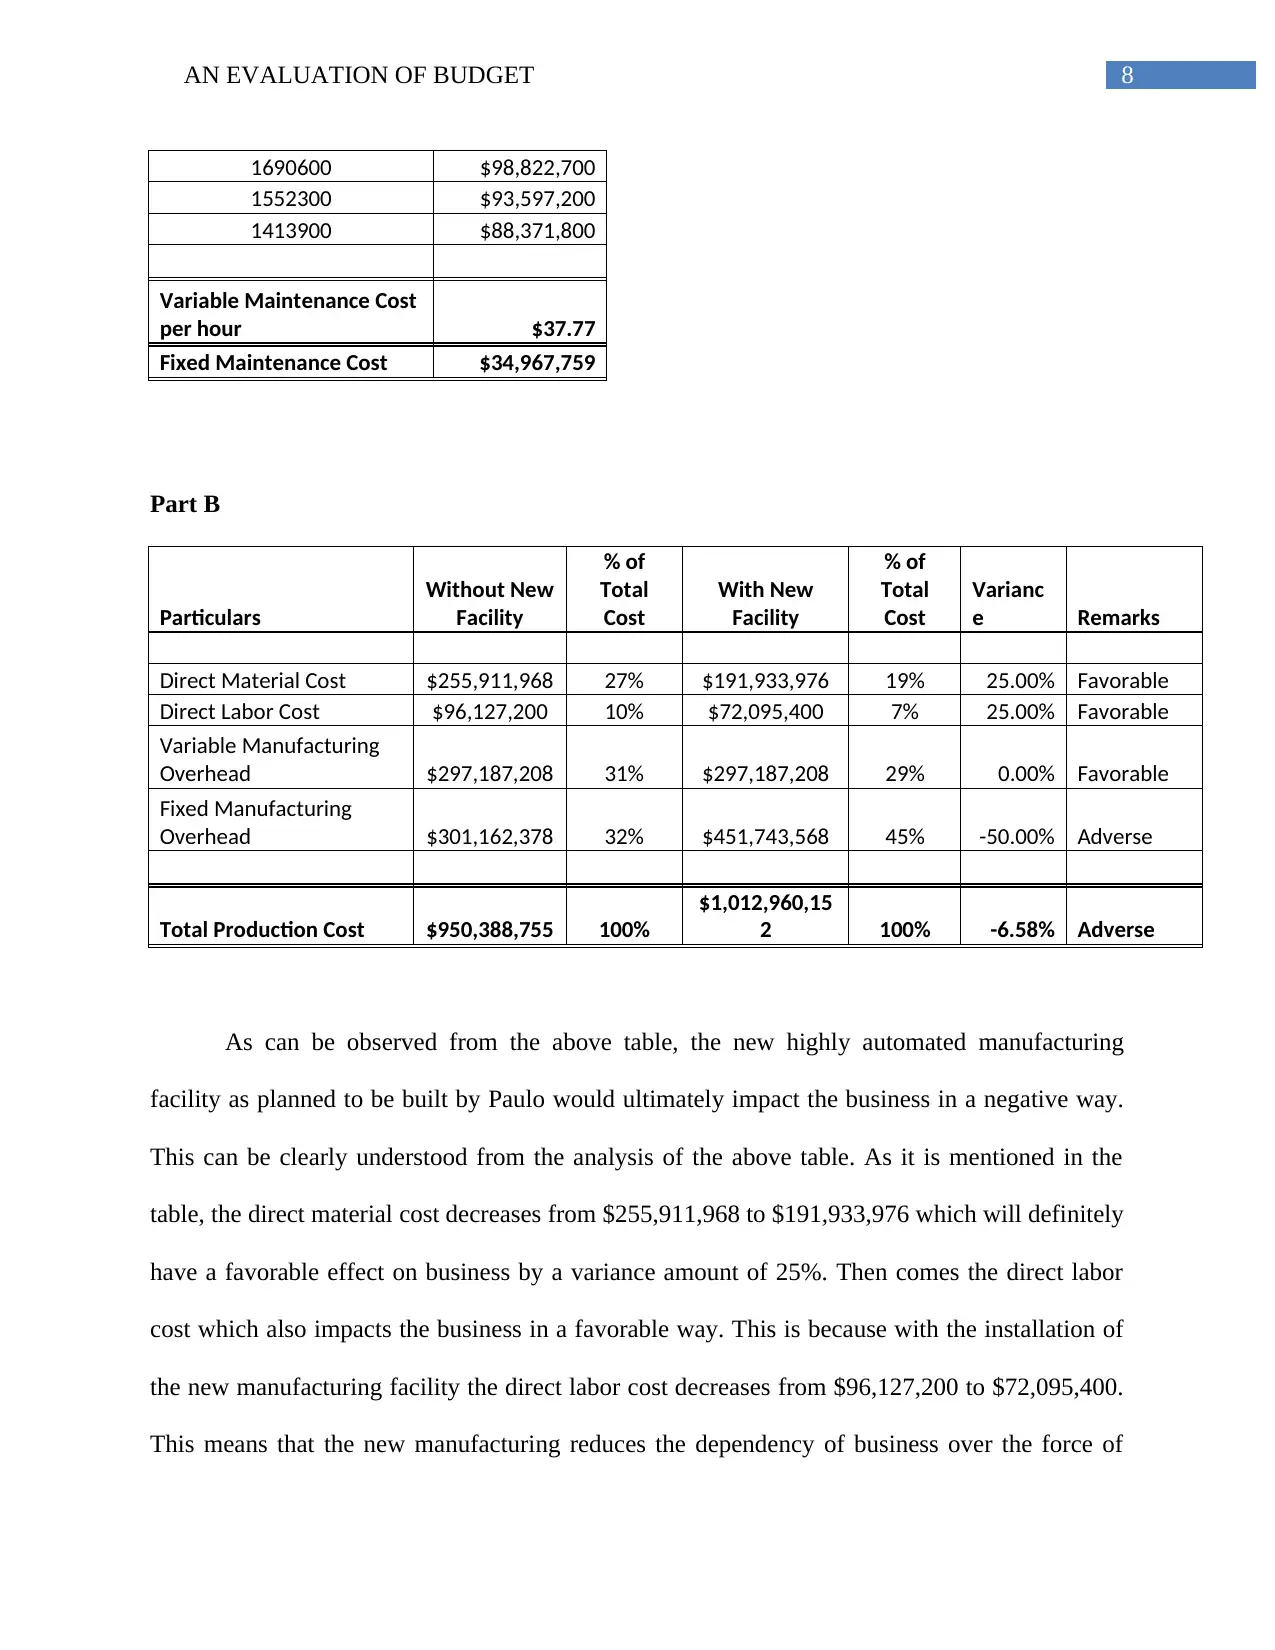
8AN EVALUATION OF BUDGET
1690600 $98,822,700
1552300 $93,597,200
1413900 $88,371,800
Variable Maintenance Cost
per hour $37.77
Fixed Maintenance Cost $34,967,759
Part B
Particulars
Without New
Facility
% of
Total
Cost
With New
Facility
% of
Total
Cost
Varianc
e Remarks
Direct Material Cost $255,911,968 27% $191,933,976 19% 25.00% Favorable
Direct Labor Cost $96,127,200 10% $72,095,400 7% 25.00% Favorable
Variable Manufacturing
Overhead $297,187,208 31% $297,187,208 29% 0.00% Favorable
Fixed Manufacturing
Overhead $301,162,378 32% $451,743,568 45% -50.00% Adverse
Total Production Cost $950,388,755 100%
$1,012,960,15
2 100% -6.58% Adverse
As can be observed from the above table, the new highly automated manufacturing
facility as planned to be built by Paulo would ultimately impact the business in a negative way.
This can be clearly understood from the analysis of the above table. As it is mentioned in the
table, the direct material cost decreases from $255,911,968 to $191,933,976 which will definitely
have a favorable effect on business by a variance amount of 25%. Then comes the direct labor
cost which also impacts the business in a favorable way. This is because with the installation of
the new manufacturing facility the direct labor cost decreases from $96,127,200 to $72,095,400.
This means that the new manufacturing reduces the dependency of business over the force of
⊘ This is a preview!⊘
Do you want full access?
Subscribe today to unlock all pages.
Trusted by 1+ million students worldwide
9AN EVALUATION OF BUDGET
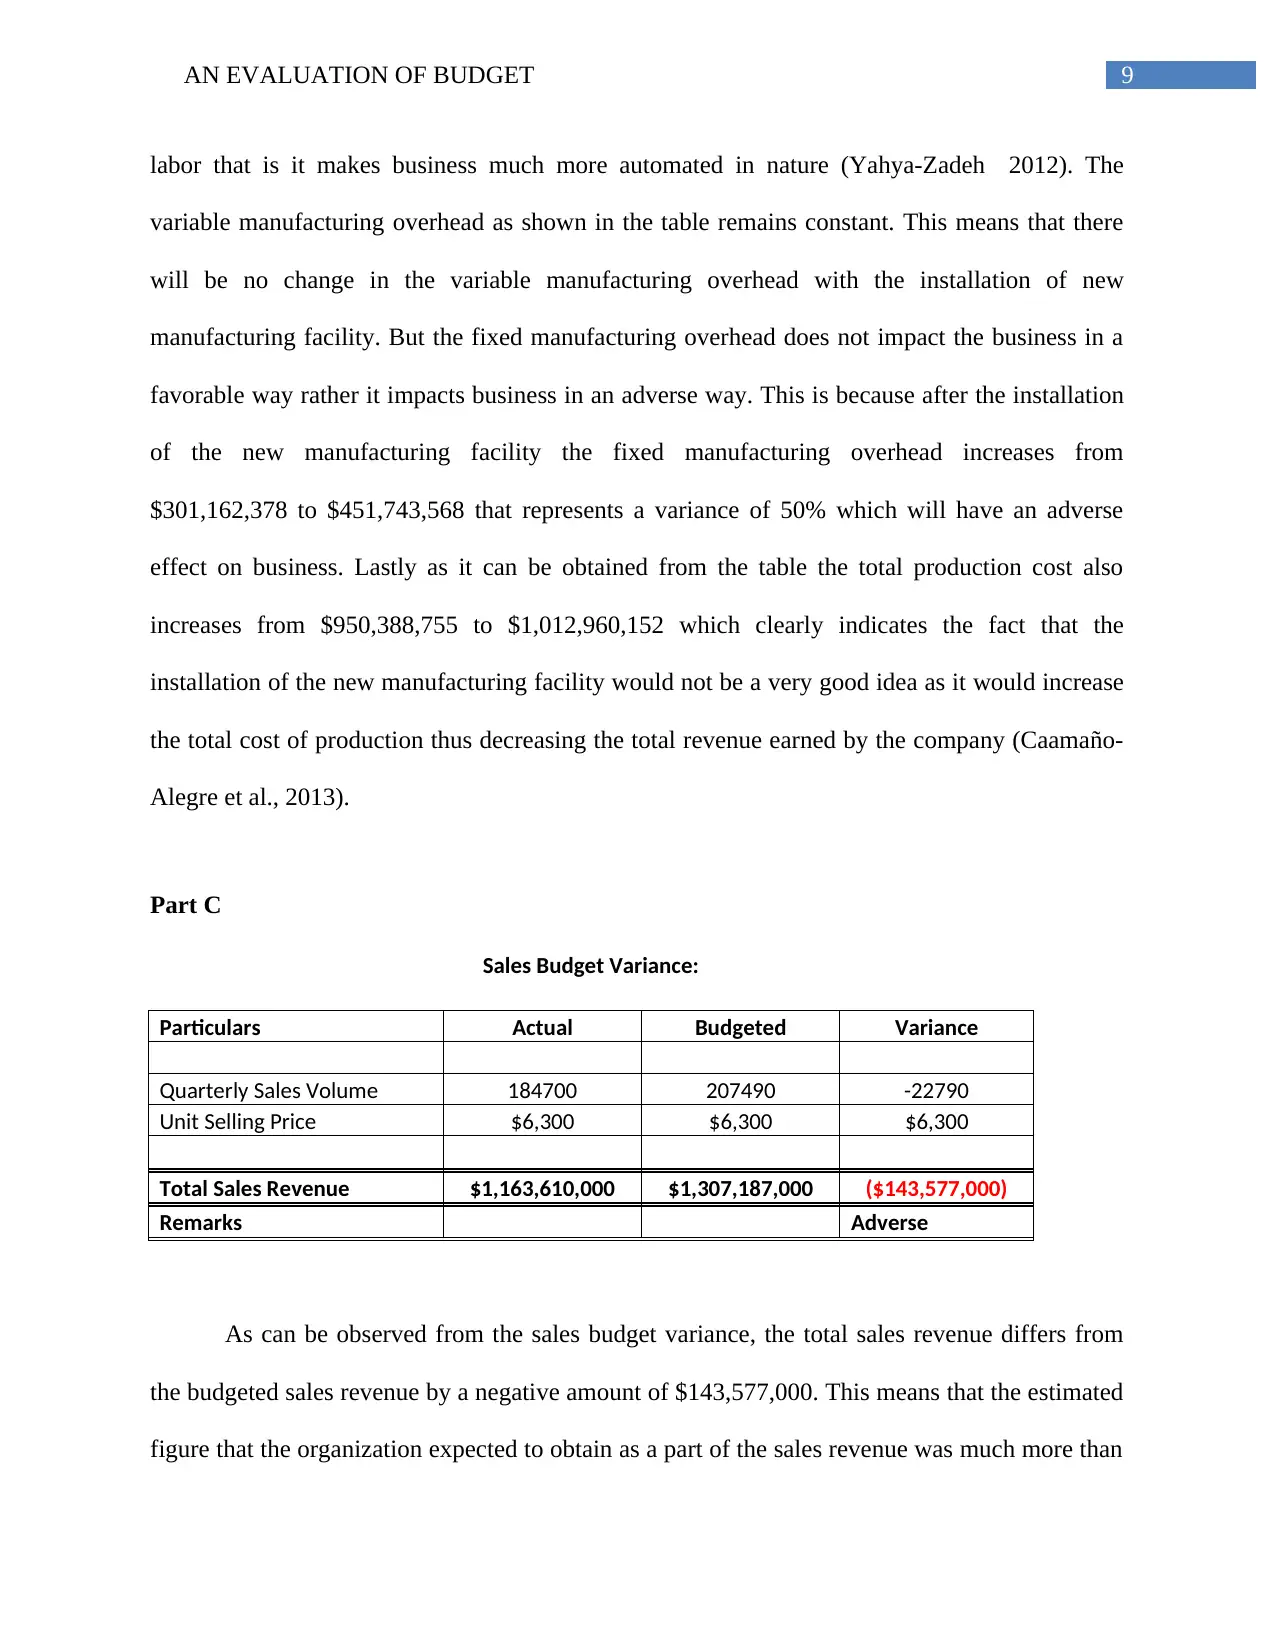
labor that is it makes business much more automated in nature (Yahya-Zadeh 2012). The
variable manufacturing overhead as shown in the table remains constant. This means that there
will be no change in the variable manufacturing overhead with the installation of new
manufacturing facility. But the fixed manufacturing overhead does not impact the business in a
favorable way rather it impacts business in an adverse way. This is because after the installation
of the new manufacturing facility the fixed manufacturing overhead increases from
$301,162,378 to $451,743,568 that represents a variance of 50% which will have an adverse
effect on business. Lastly as it can be obtained from the table the total production cost also
increases from $950,388,755 to $1,012,960,152 which clearly indicates the fact that the
installation of the new manufacturing facility would not be a very good idea as it would increase
the total cost of production thus decreasing the total revenue earned by the company (Caamaño-
Alegre et al., 2013).
Part C
Sales Budget Variance:
Particulars Actual Budgeted Variance
Quarterly Sales Volume 184700 207490 -22790
Unit Selling Price $6,300 $6,300 $6,300
Total Sales Revenue $1,163,610,000 $1,307,187,000 ($143,577,000)
Remarks Adverse
As can be observed from the sales budget variance, the total sales revenue differs from
the budgeted sales revenue by a negative amount of $143,577,000. This means that the estimated
figure that the organization expected to obtain as a part of the sales revenue was much more than
Paraphrase This Document
Need a fresh take? Get an instant paraphrase of this document with our AI Paraphraser
10AN EVALUATION OF BUDGET
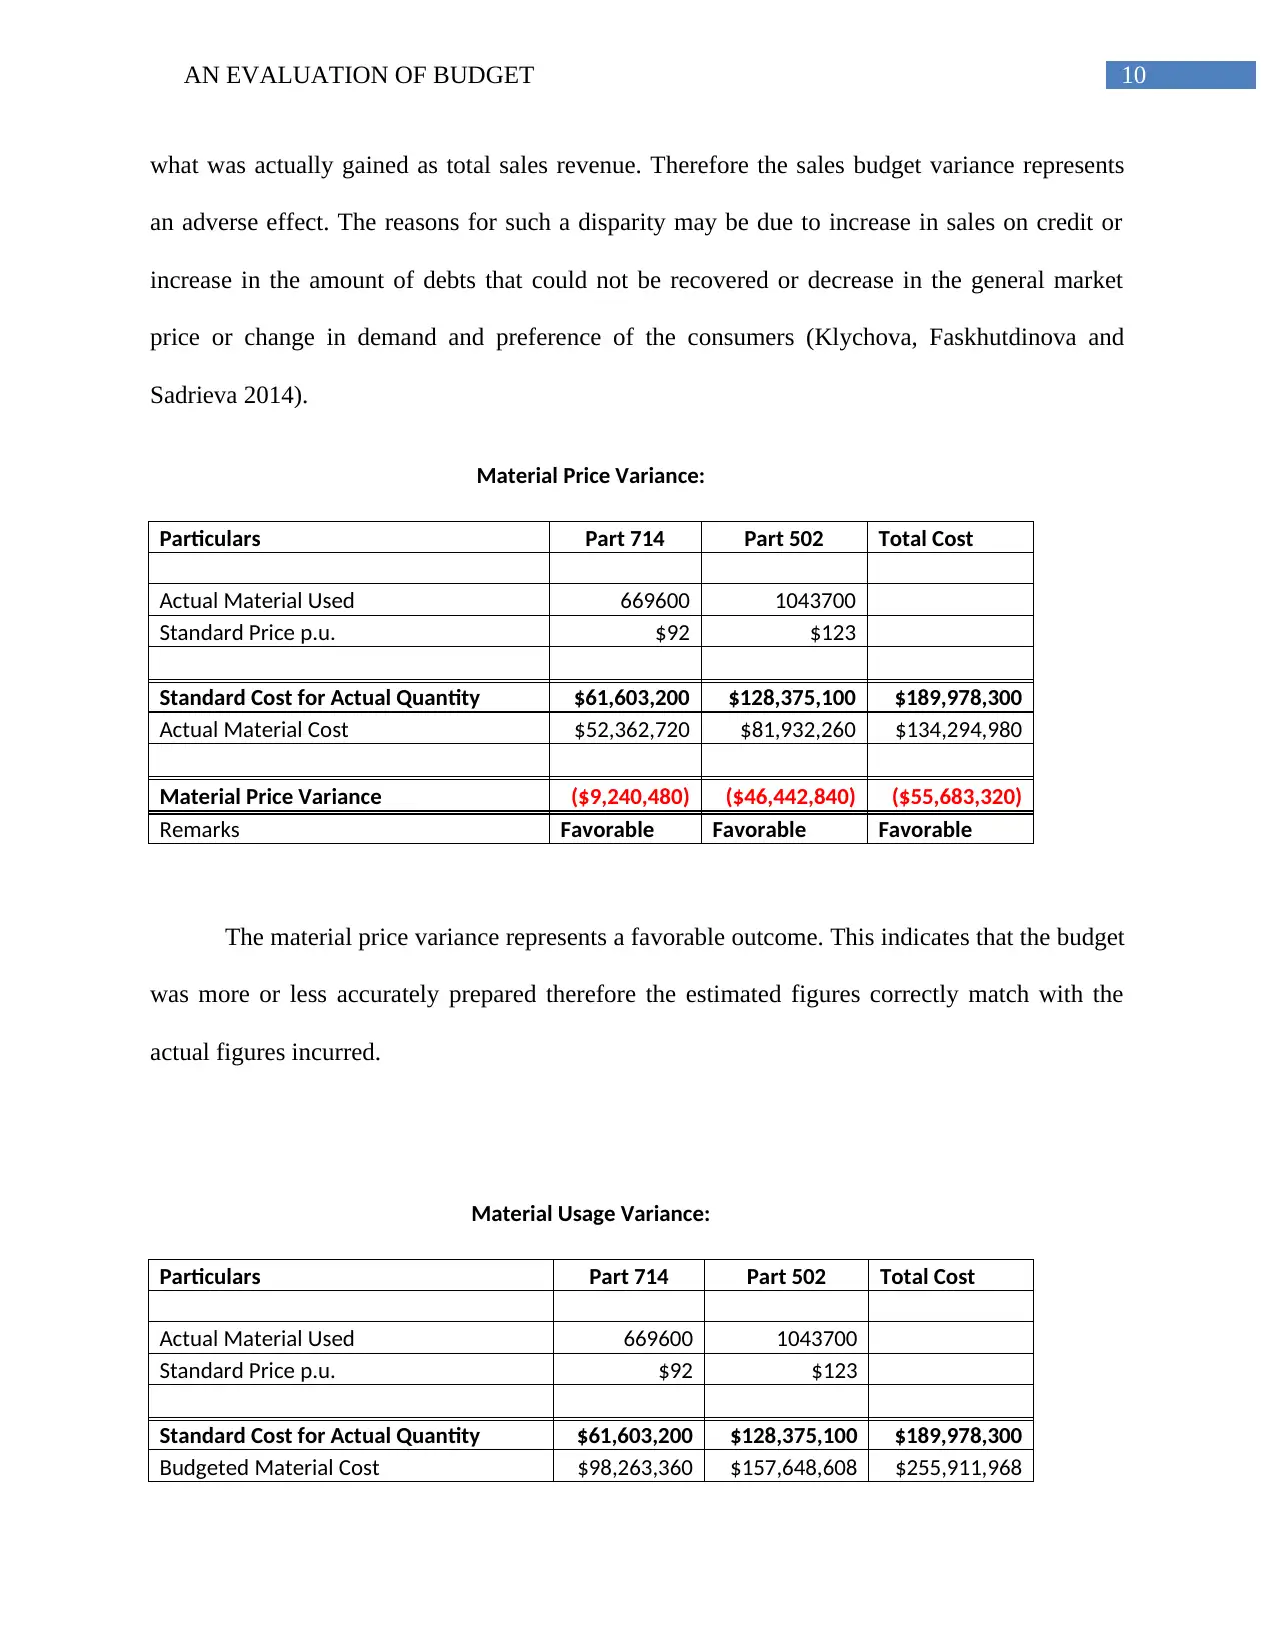
what was actually gained as total sales revenue. Therefore the sales budget variance represents
an adverse effect. The reasons for such a disparity may be due to increase in sales on credit or
increase in the amount of debts that could not be recovered or decrease in the general market
price or change in demand and preference of the consumers (Klychova, Faskhutdinova and
Sadrieva 2014).
Material Price Variance:
Particulars Part 714 Part 502 Total Cost
Actual Material Used 669600 1043700
Standard Price p.u. $92 $123
Standard Cost for Actual Quantity $61,603,200 $128,375,100 $189,978,300
Actual Material Cost $52,362,720 $81,932,260 $134,294,980
Material Price Variance ($9,240,480) ($46,442,840) ($55,683,320)
Remarks Favorable Favorable Favorable
The material price variance represents a favorable outcome. This indicates that the budget
was more or less accurately prepared therefore the estimated figures correctly match with the
actual figures incurred.
Material Usage Variance:
Particulars Part 714 Part 502 Total Cost
Actual Material Used 669600 1043700
Standard Price p.u. $92 $123
Standard Cost for Actual Quantity $61,603,200 $128,375,100 $189,978,300
Budgeted Material Cost $98,263,360 $157,648,608 $255,911,968
11AN EVALUATION OF BUDGET
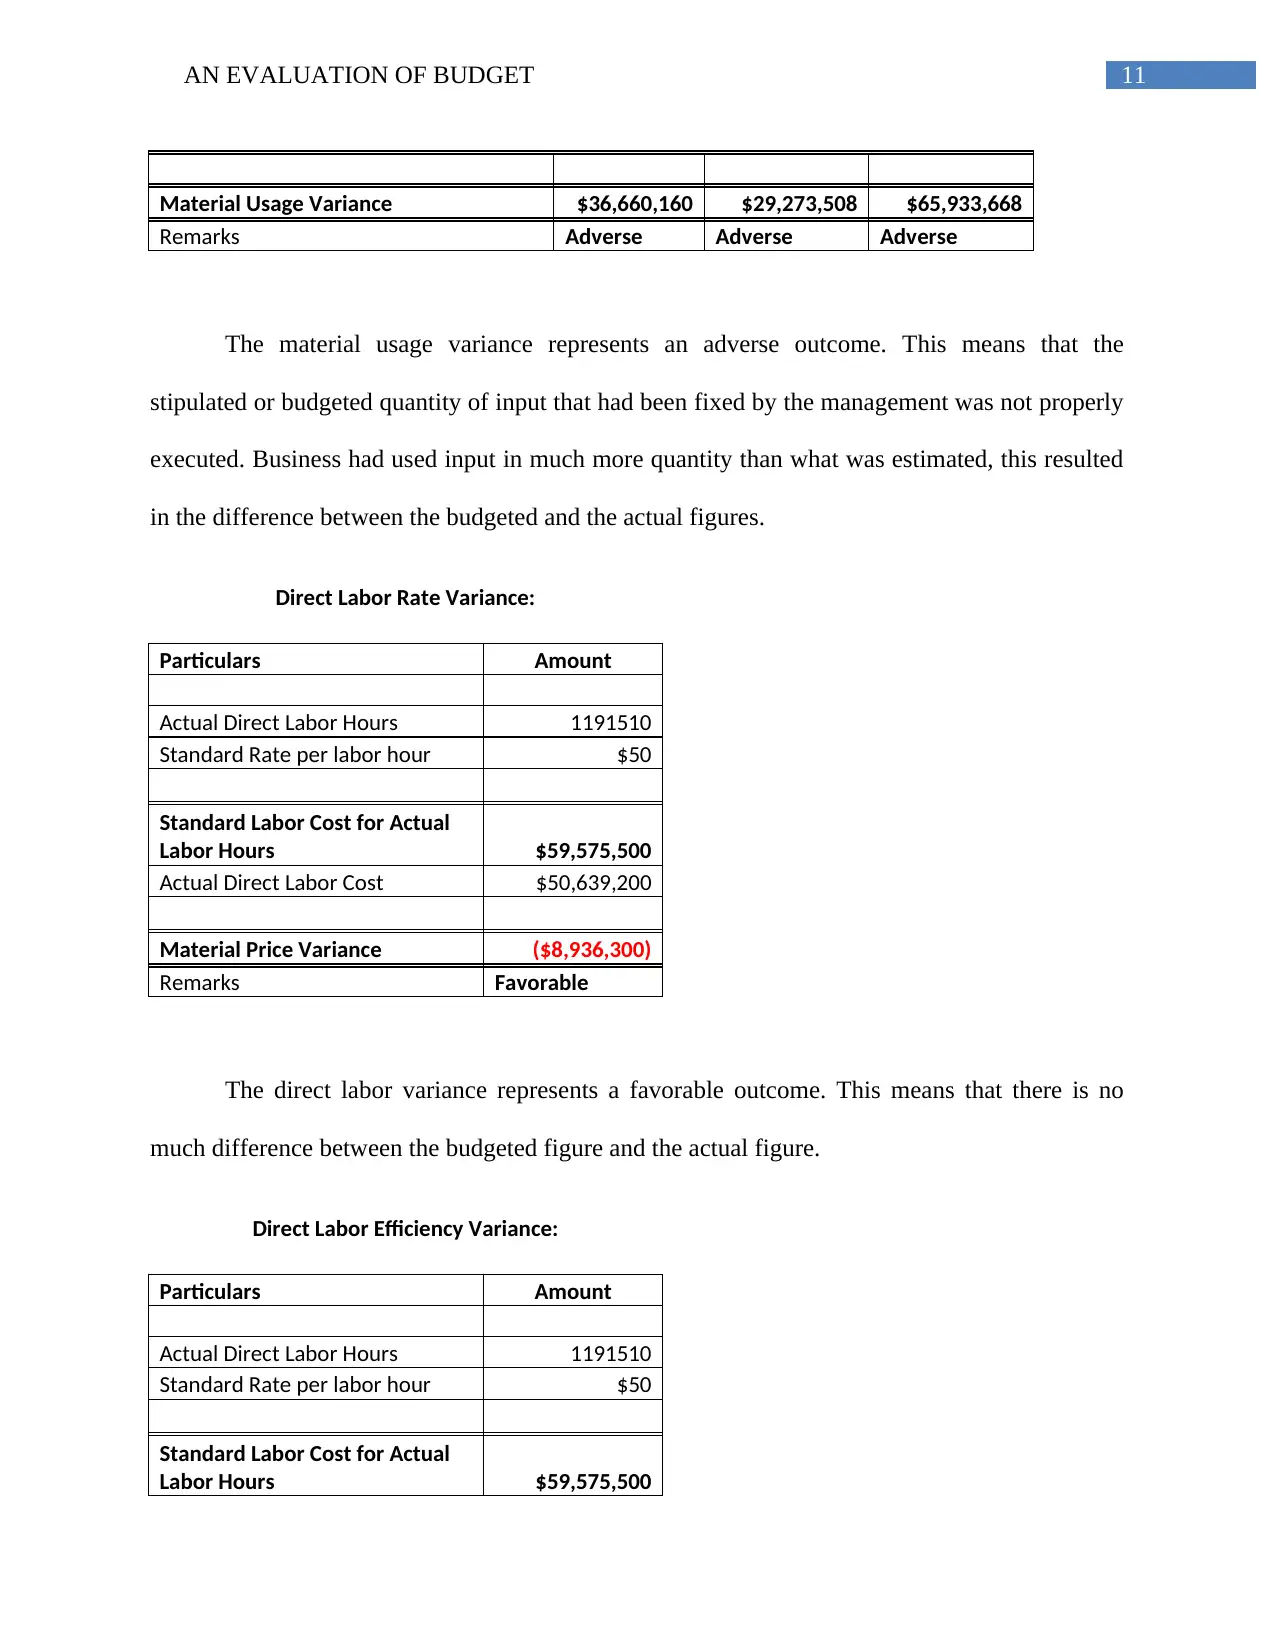
Material Usage Variance $36,660,160 $29,273,508 $65,933,668
Remarks Adverse Adverse Adverse
The material usage variance represents an adverse outcome. This means that the
stipulated or budgeted quantity of input that had been fixed by the management was not properly
executed. Business had used input in much more quantity than what was estimated, this resulted
in the difference between the budgeted and the actual figures.
Direct Labor Rate Variance:
Particulars Amount
Actual Direct Labor Hours 1191510
Standard Rate per labor hour $50
Standard Labor Cost for Actual
Labor Hours $59,575,500
Actual Direct Labor Cost $50,639,200
Material Price Variance ($8,936,300)
Remarks Favorable
The direct labor variance represents a favorable outcome. This means that there is no
much difference between the budgeted figure and the actual figure.
Direct Labor Efficiency Variance:
Particulars Amount
Actual Direct Labor Hours 1191510
Standard Rate per labor hour $50
Standard Labor Cost for Actual
Labor Hours $59,575,500
⊘ This is a preview!⊘
Do you want full access?
Subscribe today to unlock all pages.
Trusted by 1+ million students worldwide
1 out of 15
Related Documents


Your All-in-One AI-Powered Toolkit for Academic Success.
+13062052269
info@desklib.com
Available 24*7 on WhatsApp / Email
![[object Object]](/_next/static/media/star-bottom.7253800d.svg)
Unlock your academic potential
Copyright © 2020–2026 A2Z Services. All Rights Reserved. Developed and managed by ZUCOL.