Comprehensive Design Project: Analysis and Design of Slabs and Columns
VerifiedAdded on 2021/06/11
|26
|5851
|106
Project
AI Summary
This project focuses on the structural analysis and design of slabs and columns, adhering to Eurocode 2 (EC2) standards. It begins with an introduction to Reactive Powder Concrete (RPC) and Fiber Reinforced Concrete (FRC), discussing their properties and applications. The project then delves into load calculations for slabs and columns in multi-story buildings, considering dead loads, live loads, and self-slab loads. Detailed calculations are provided for both the 1st and 2nd slabs, including flexural reinforcement, shear design, and deflection checks. The design process includes determining the required steel reinforcement, checking for shear and punching shear, and ensuring the spacing and placement of reinforcement bars comply with design codes. The project also covers the design of interior columns, calculating column loads for various stories. Overall, the project offers a comprehensive guide to structural design principles, including load calculations, material properties, and compliance with design codes.
Contents
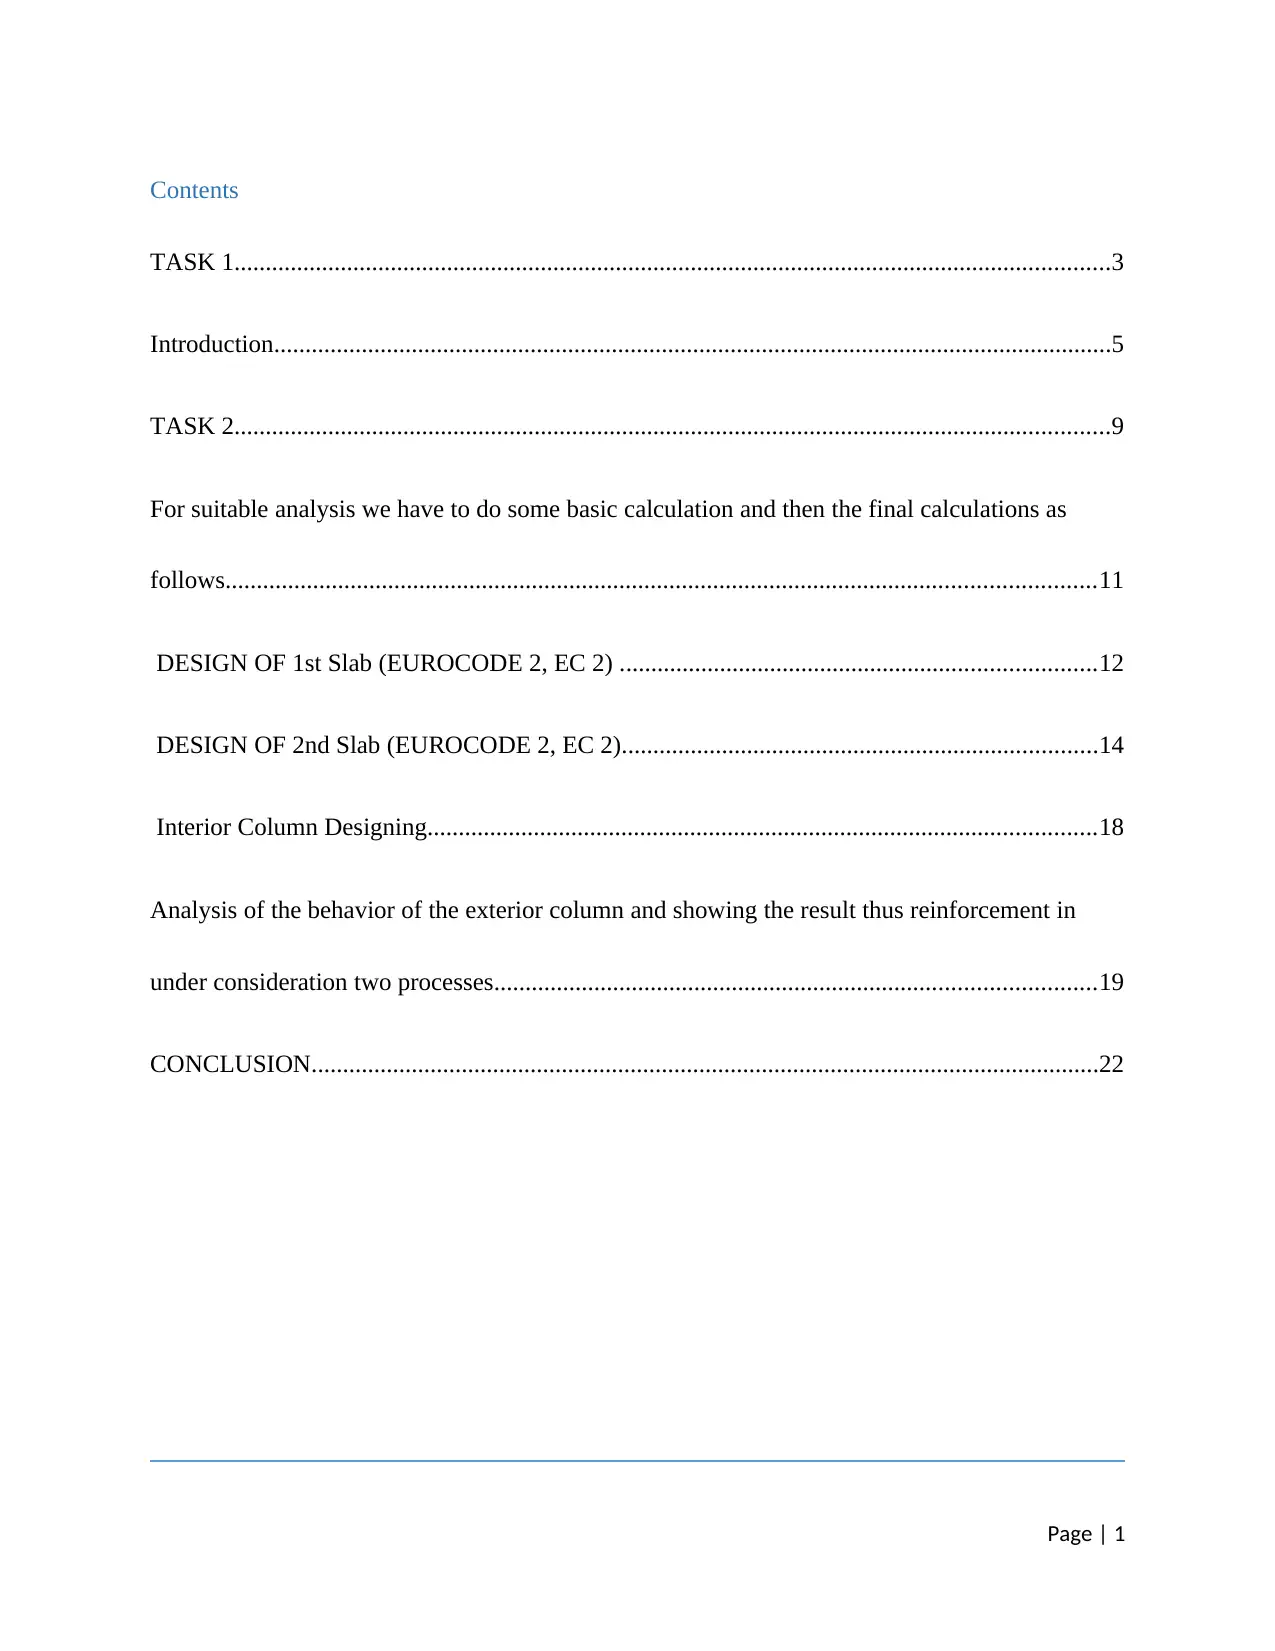
TASK 1............................................................................................................................................3
Introduction......................................................................................................................................5
TASK 2............................................................................................................................................9
For suitable analysis we have to do some basic calculation and then the final calculations as
follows...........................................................................................................................................11
DESIGN OF 1st Slab (EUROCODE 2, EC 2) ............................................................................12
DESIGN OF 2nd Slab (EUROCODE 2, EC 2)............................................................................14
Interior Column Designing...........................................................................................................18
Analysis of the behavior of the exterior column and showing the result thus reinforcement in
under consideration two processes................................................................................................19
CONCLUSION..............................................................................................................................22
Page | 1
Paraphrase This Document
Need a fresh take? Get an instant paraphrase of this document with our AI Paraphraser
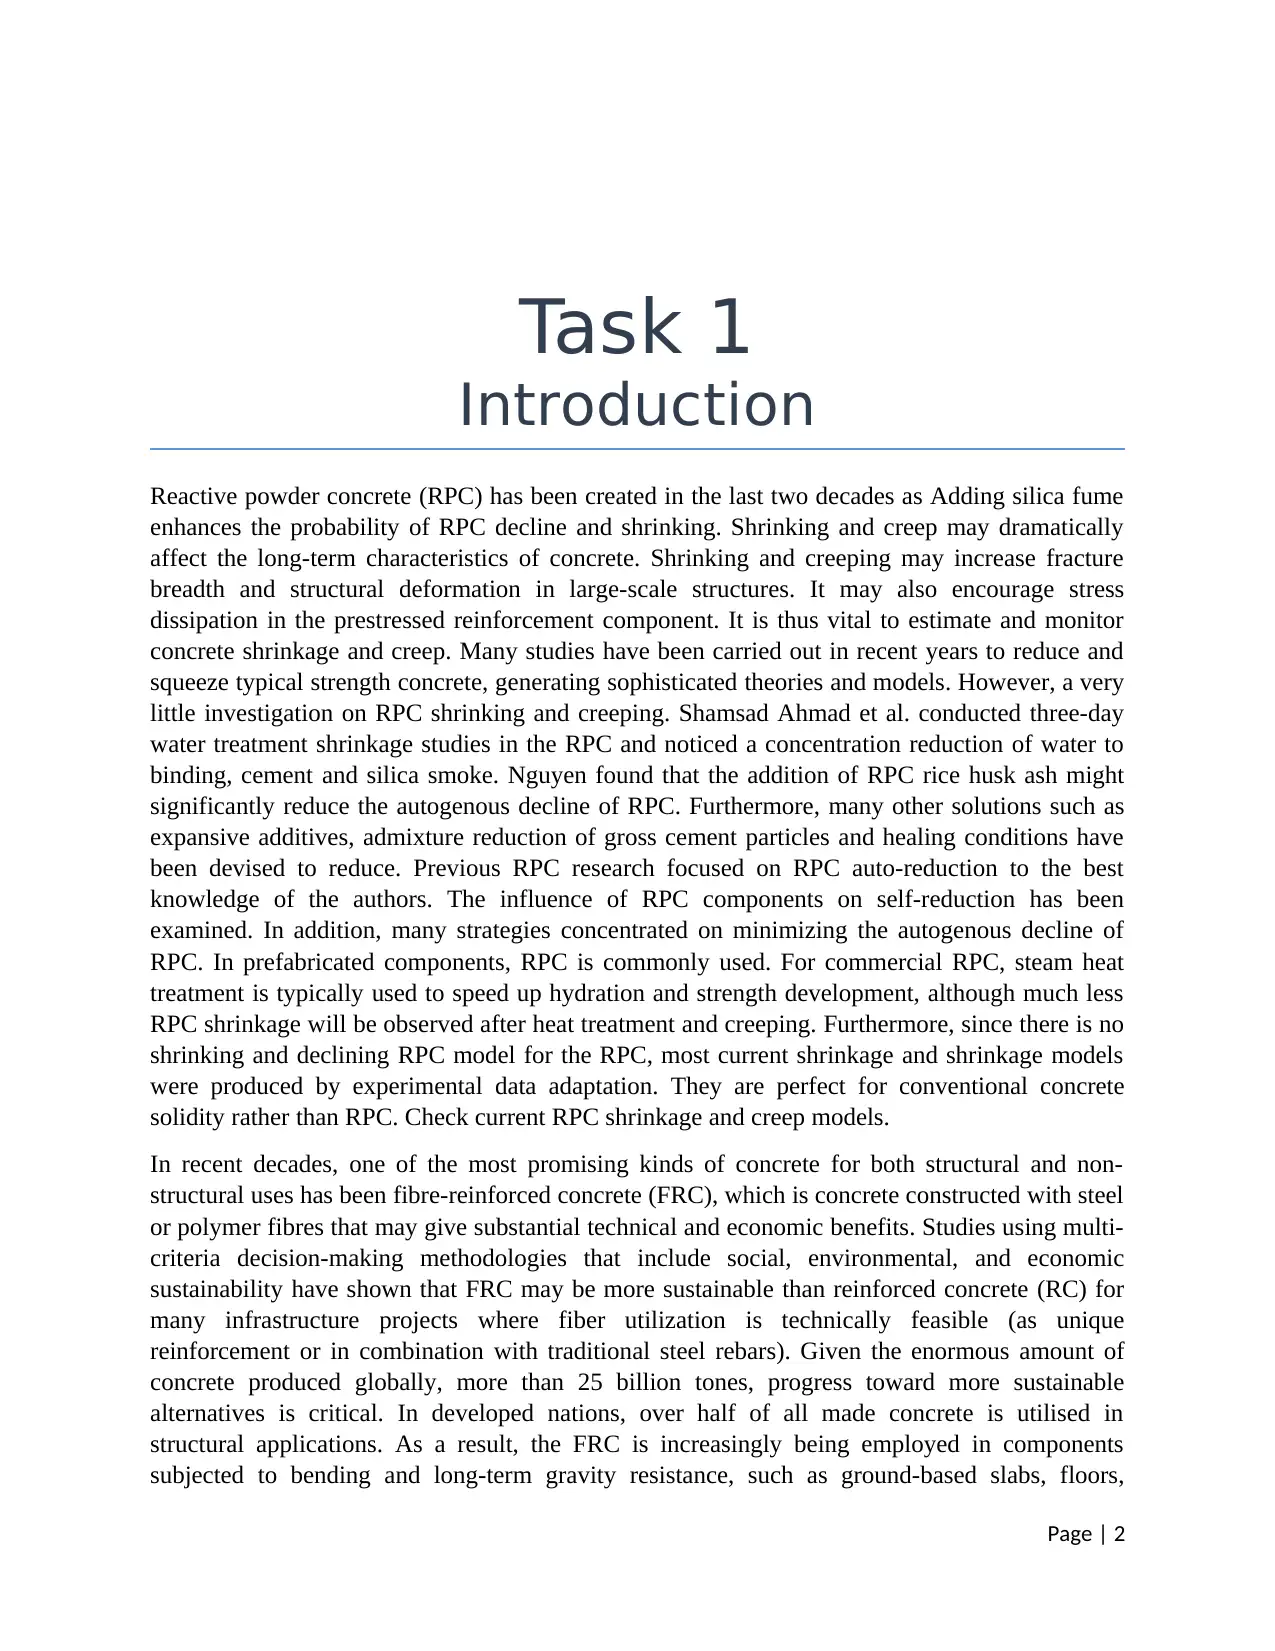
Task 1
Introduction
Reactive powder concrete (RPC) has been created in the last two decades as Adding silica fume
enhances the probability of RPC decline and shrinking. Shrinking and creep may dramatically
affect the long-term characteristics of concrete. Shrinking and creeping may increase fracture
breadth and structural deformation in large-scale structures. It may also encourage stress
dissipation in the prestressed reinforcement component. It is thus vital to estimate and monitor
concrete shrinkage and creep. Many studies have been carried out in recent years to reduce and
squeeze typical strength concrete, generating sophisticated theories and models. However, a very
little investigation on RPC shrinking and creeping. Shamsad Ahmad et al. conducted three-day
water treatment shrinkage studies in the RPC and noticed a concentration reduction of water to
binding, cement and silica smoke. Nguyen found that the addition of RPC rice husk ash might
significantly reduce the autogenous decline of RPC. Furthermore, many other solutions such as
expansive additives, admixture reduction of gross cement particles and healing conditions have
been devised to reduce. Previous RPC research focused on RPC auto-reduction to the best
knowledge of the authors. The influence of RPC components on self-reduction has been
examined. In addition, many strategies concentrated on minimizing the autogenous decline of
RPC. In prefabricated components, RPC is commonly used. For commercial RPC, steam heat
treatment is typically used to speed up hydration and strength development, although much less
RPC shrinkage will be observed after heat treatment and creeping. Furthermore, since there is no
shrinking and declining RPC model for the RPC, most current shrinkage and shrinkage models
were produced by experimental data adaptation. They are perfect for conventional concrete
solidity rather than RPC. Check current RPC shrinkage and creep models.
In recent decades, one of the most promising kinds of concrete for both structural and non-
structural uses has been fibre-reinforced concrete (FRC), which is concrete constructed with steel
or polymer fibres that may give substantial technical and economic benefits. Studies using multi-
criteria decision-making methodologies that include social, environmental, and economic
sustainability have shown that FRC may be more sustainable than reinforced concrete (RC) for
many infrastructure projects where fiber utilization is technically feasible (as unique
reinforcement or in combination with traditional steel rebars). Given the enormous amount of
concrete produced globally, more than 25 billion tones, progress toward more sustainable
alternatives is critical. In developed nations, over half of all made concrete is utilised in
structural applications. As a result, the FRC is increasingly being employed in components
subjected to bending and long-term gravity resistance, such as ground-based slabs, floors,
Page | 2

roadways, tunnel lines, pipe sewage lines, and flat slabs. Thanks to extensive study, FRC
structural design has been incorporated in various design codes in recent years, including the
2010, ACI 318, Italian, and Spanish Codes. Until recently, however, research has mostly
concentrated on short-term material and structural qualities, leaving additional FRC design
concerns to be addressed in the early phases of development.
Page | 3
⊘ This is a preview!⊘
Do you want full access?
Subscribe today to unlock all pages.
Trusted by 1+ million students worldwide
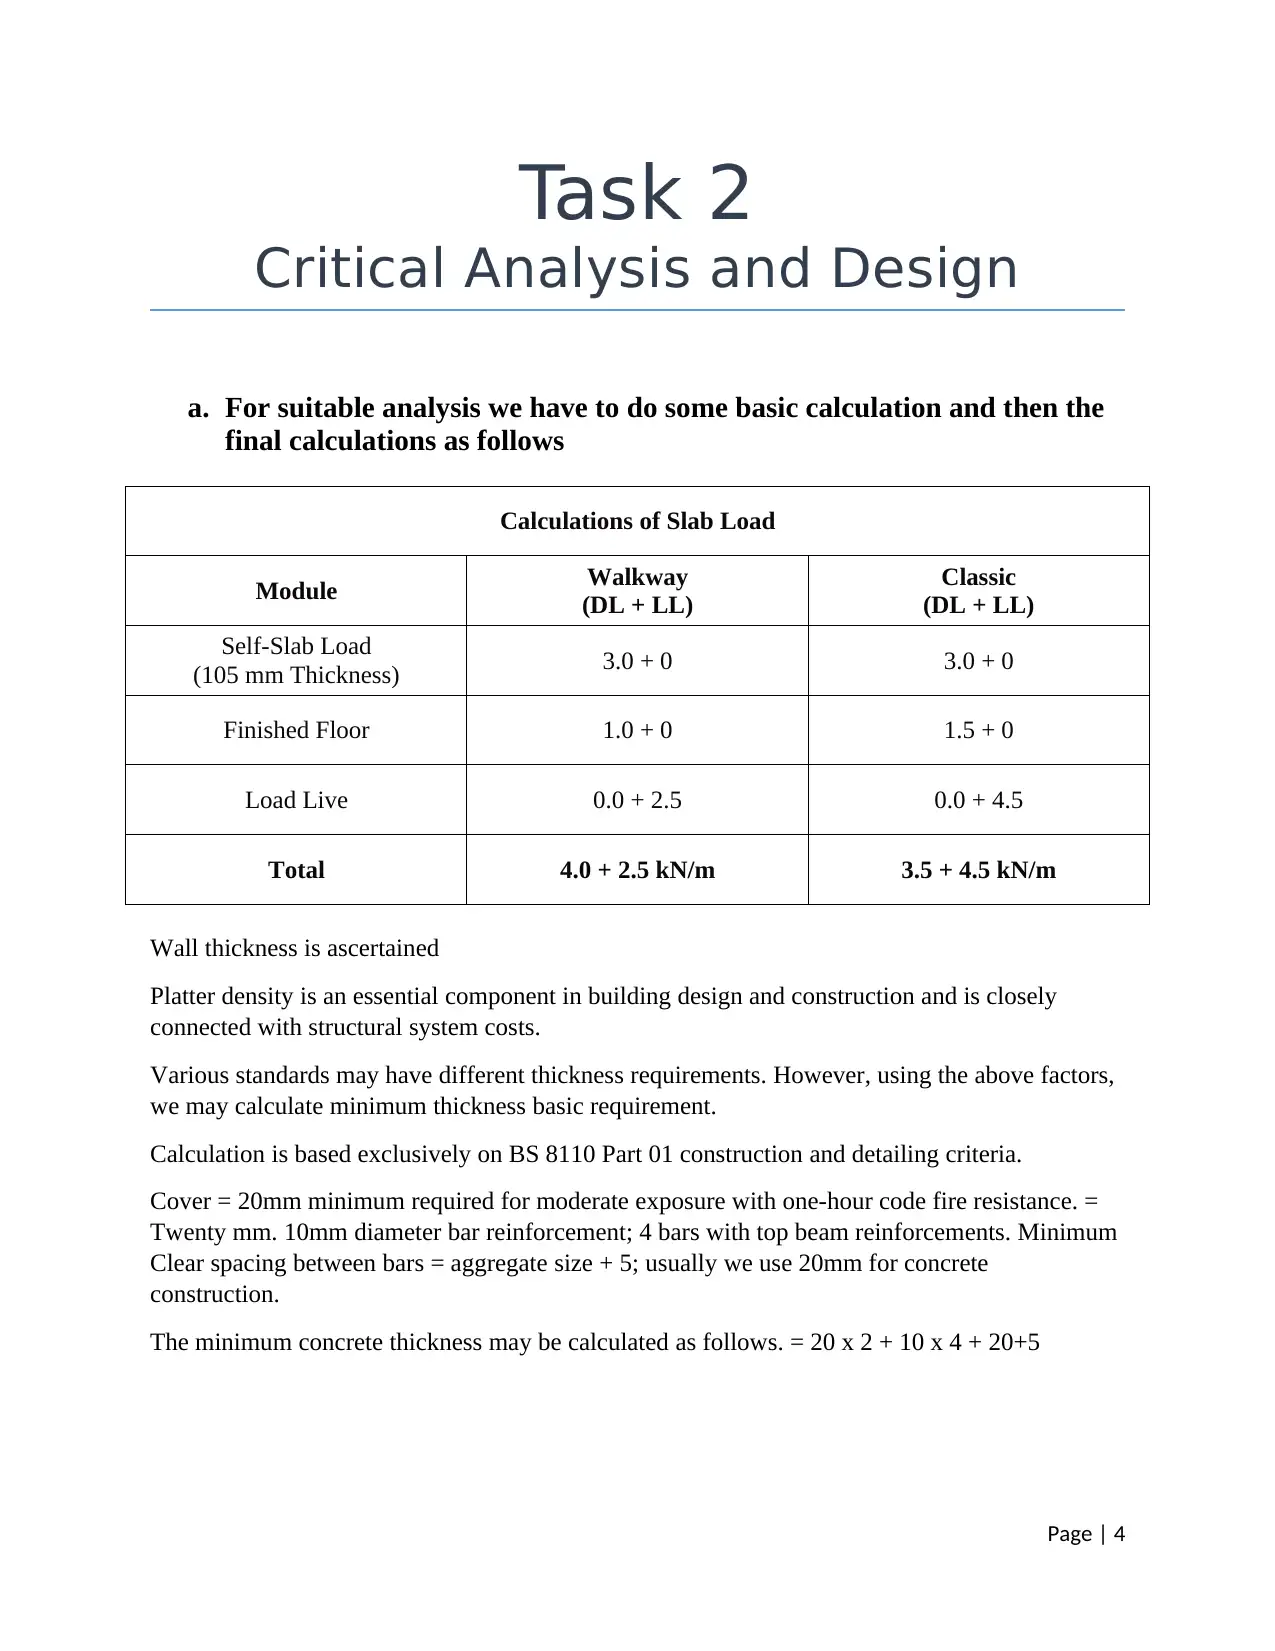
Task 2
Critical Analysis and Design
a. For suitable analysis we have to do some basic calculation and then the
final calculations as follows
Calculations of Slab Load
Module Walkway
(DL + LL)
Classic
(DL + LL)
Self-Slab Load
(105 mm Thickness) 3.0 + 0 3.0 + 0
Finished Floor 1.0 + 0 1.5 + 0
Load Live 0.0 + 2.5 0.0 + 4.5
Total 4.0 + 2.5 kN/m 3.5 + 4.5 kN/m
Wall thickness is ascertained
Platter density is an essential component in building design and construction and is closely
connected with structural system costs.
Various standards may have different thickness requirements. However, using the above factors,
we may calculate minimum thickness basic requirement.
Calculation is based exclusively on BS 8110 Part 01 construction and detailing criteria.
Cover = 20mm minimum required for moderate exposure with one-hour code fire resistance. =
Twenty mm. 10mm diameter bar reinforcement; 4 bars with top beam reinforcements. Minimum
Clear spacing between bars = aggregate size + 5; usually we use 20mm for concrete
construction.
The minimum concrete thickness may be calculated as follows. = 20 x 2 + 10 x 4 + 20+5
Page | 4
Paraphrase This Document
Need a fresh take? Get an instant paraphrase of this document with our AI Paraphraser
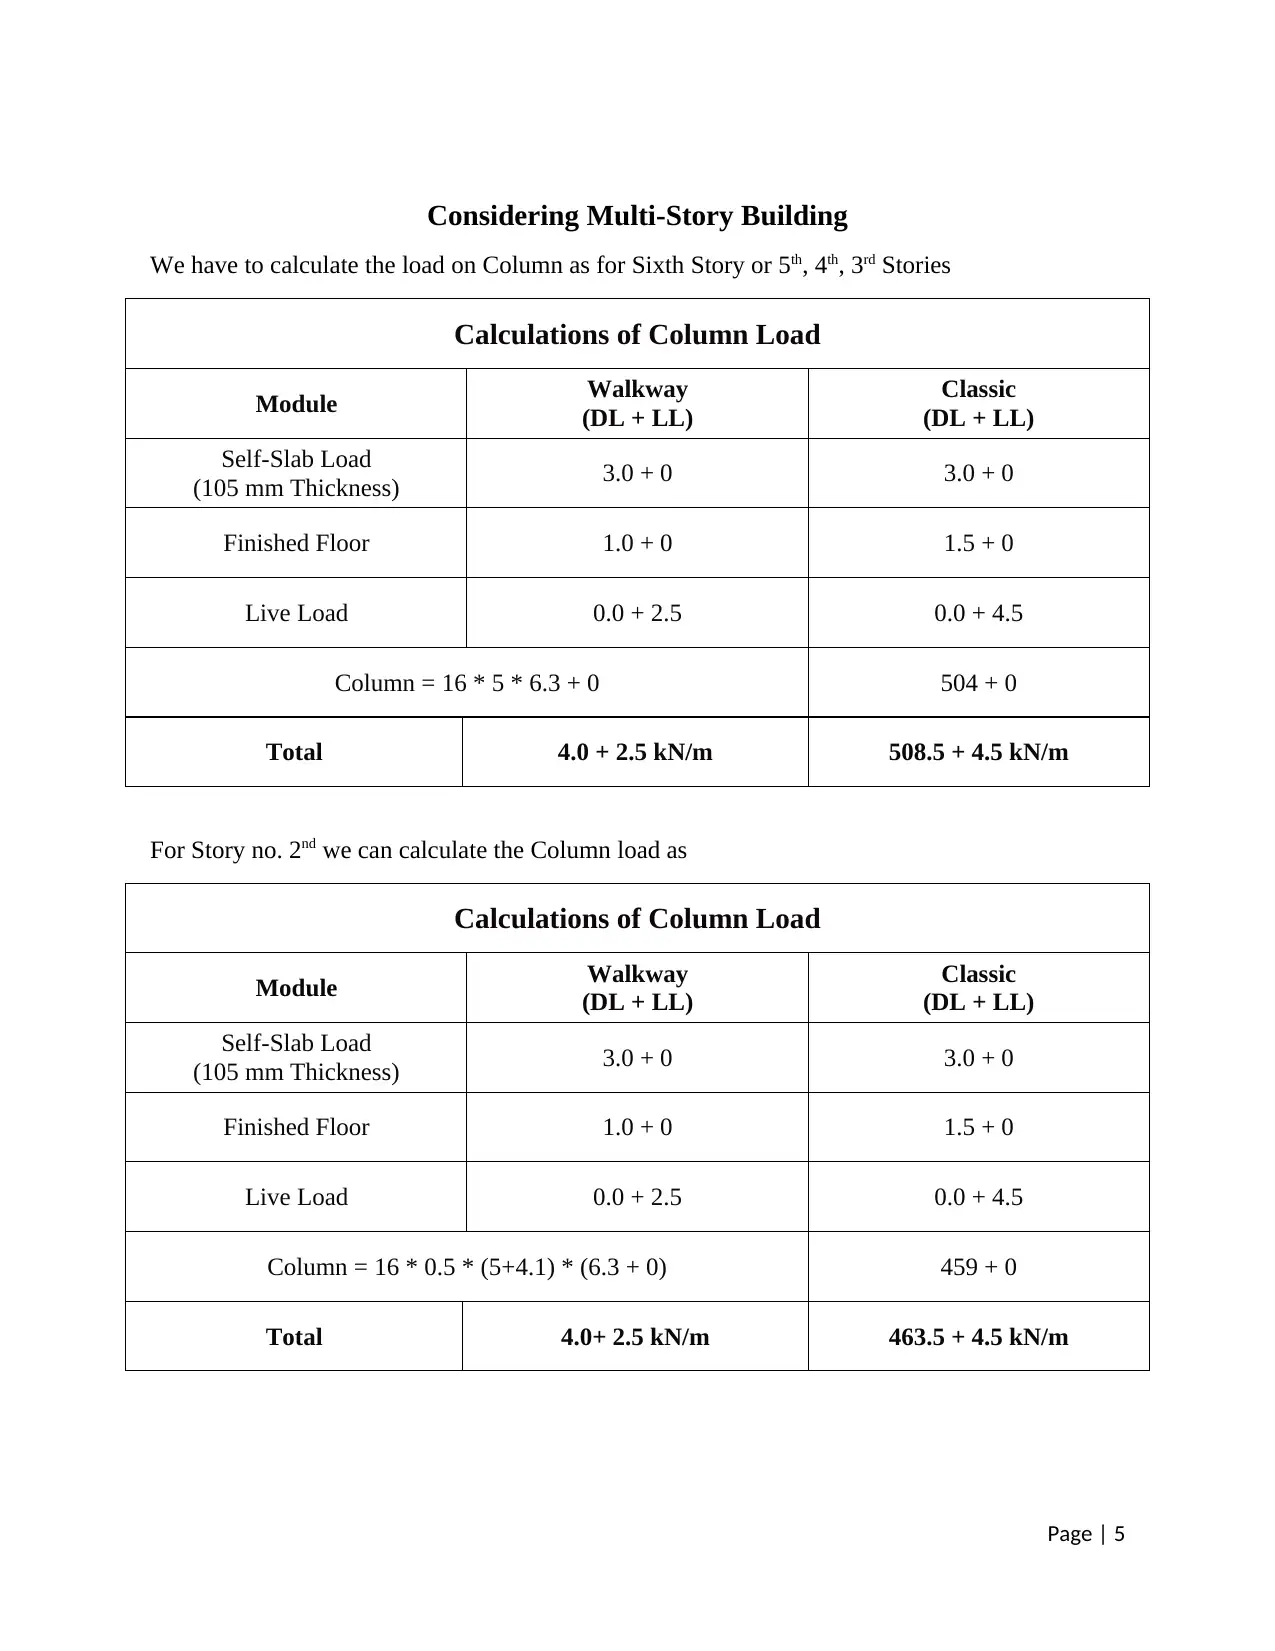
Considering Multi-Story Building
We have to calculate the load on Column as for Sixth Story or 5th, 4th, 3rd Stories
Calculations of Column Load
Module Walkway
(DL + LL)
Classic
(DL + LL)
Self-Slab Load
(105 mm Thickness) 3.0 + 0 3.0 + 0
Finished Floor 1.0 + 0 1.5 + 0
Live Load 0.0 + 2.5 0.0 + 4.5
Column = 16 * 5 * 6.3 + 0 504 + 0
Total 4.0 + 2.5 kN/m 508.5 + 4.5 kN/m
For Story no. 2nd we can calculate the Column load as
Calculations of Column Load
Module Walkway
(DL + LL)
Classic
(DL + LL)
Self-Slab Load
(105 mm Thickness) 3.0 + 0 3.0 + 0
Finished Floor 1.0 + 0 1.5 + 0
Live Load 0.0 + 2.5 0.0 + 4.5
Column = 16 * 0.5 * (5+4.1) * (6.3 + 0) 459 + 0
Total 4.0+ 2.5 kN/m 463.5 + 4.5 kN/m
Page | 5
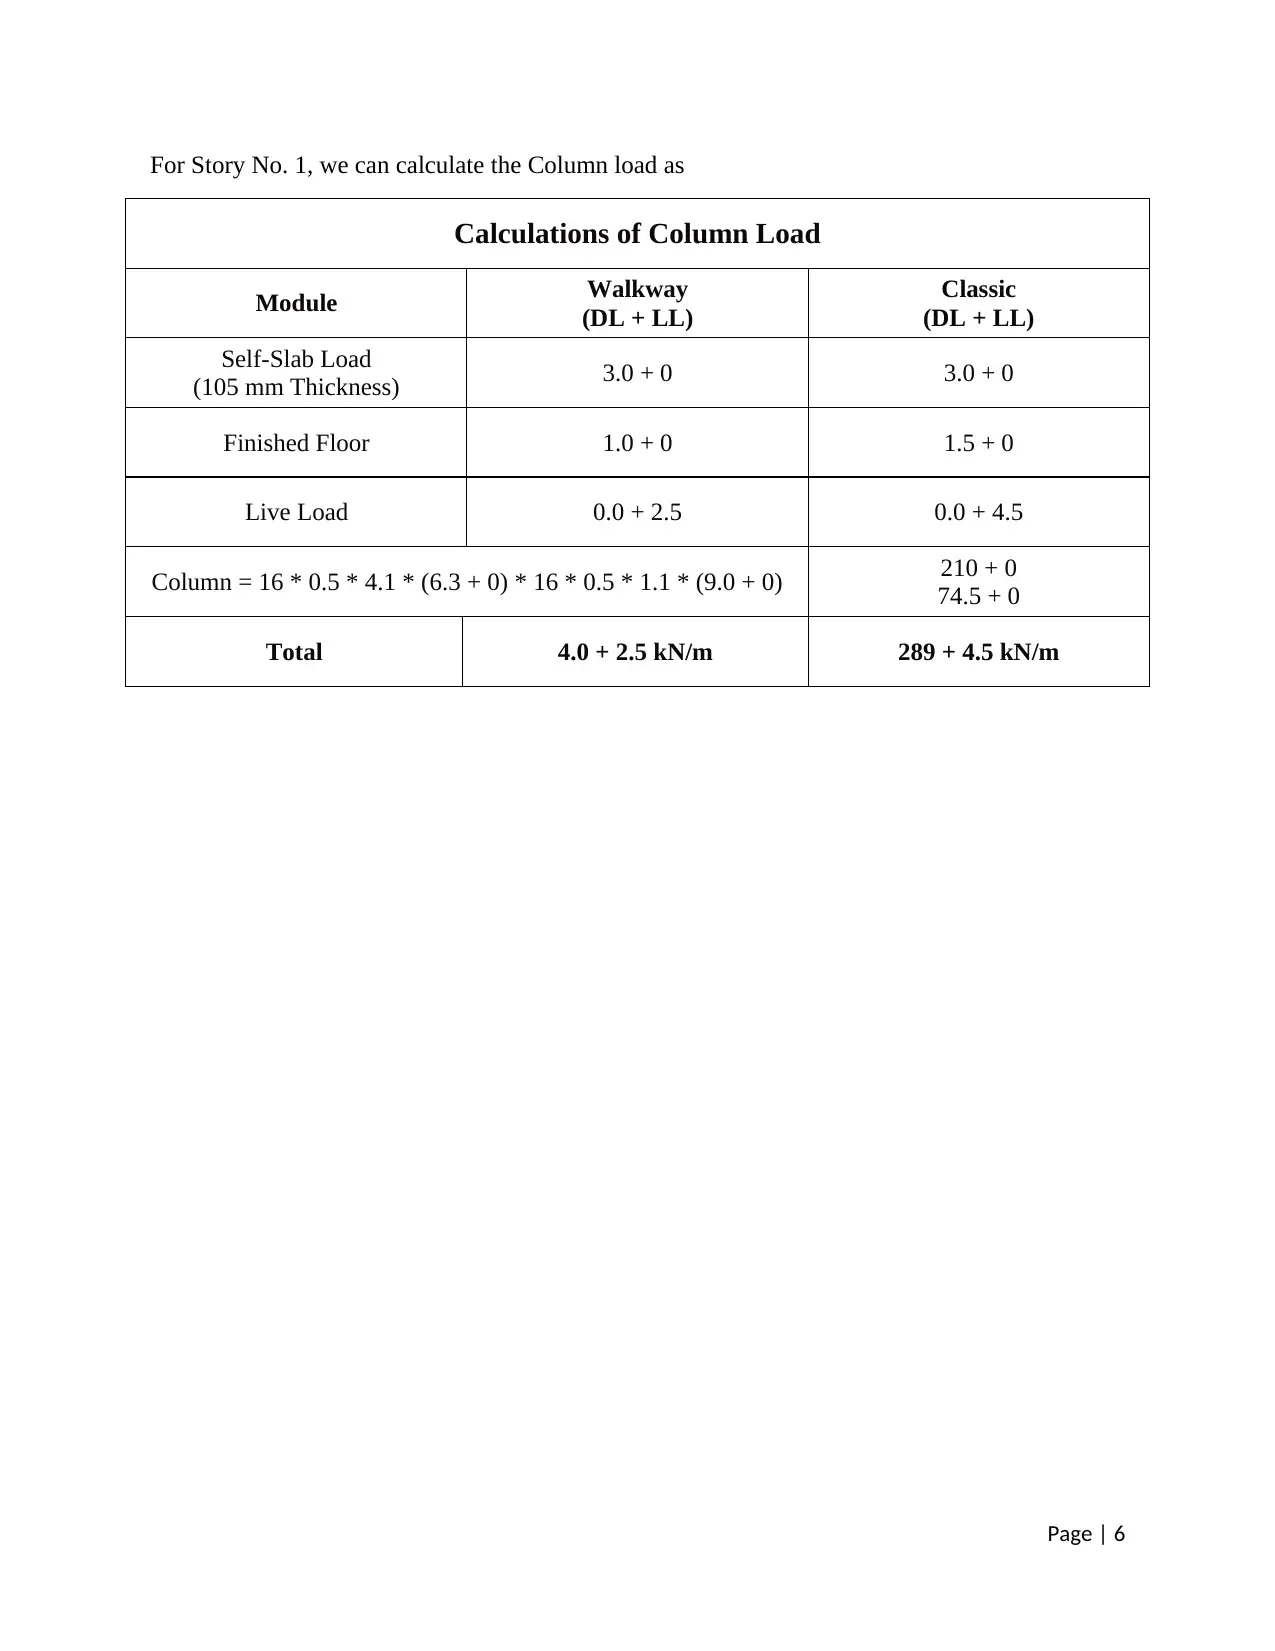
For Story No. 1, we can calculate the Column load as
Calculations of Column Load
Module Walkway
(DL + LL)
Classic
(DL + LL)
Self-Slab Load
(105 mm Thickness) 3.0 + 0 3.0 + 0
Finished Floor 1.0 + 0 1.5 + 0
Live Load 0.0 + 2.5 0.0 + 4.5
Column = 16 * 0.5 * 4.1 * (6.3 + 0) * 16 * 0.5 * 1.1 * (9.0 + 0) 210 + 0
74.5 + 0
Total 4.0 + 2.5 kN/m 289 + 4.5 kN/m
Page | 6
⊘ This is a preview!⊘
Do you want full access?
Subscribe today to unlock all pages.
Trusted by 1+ million students worldwide
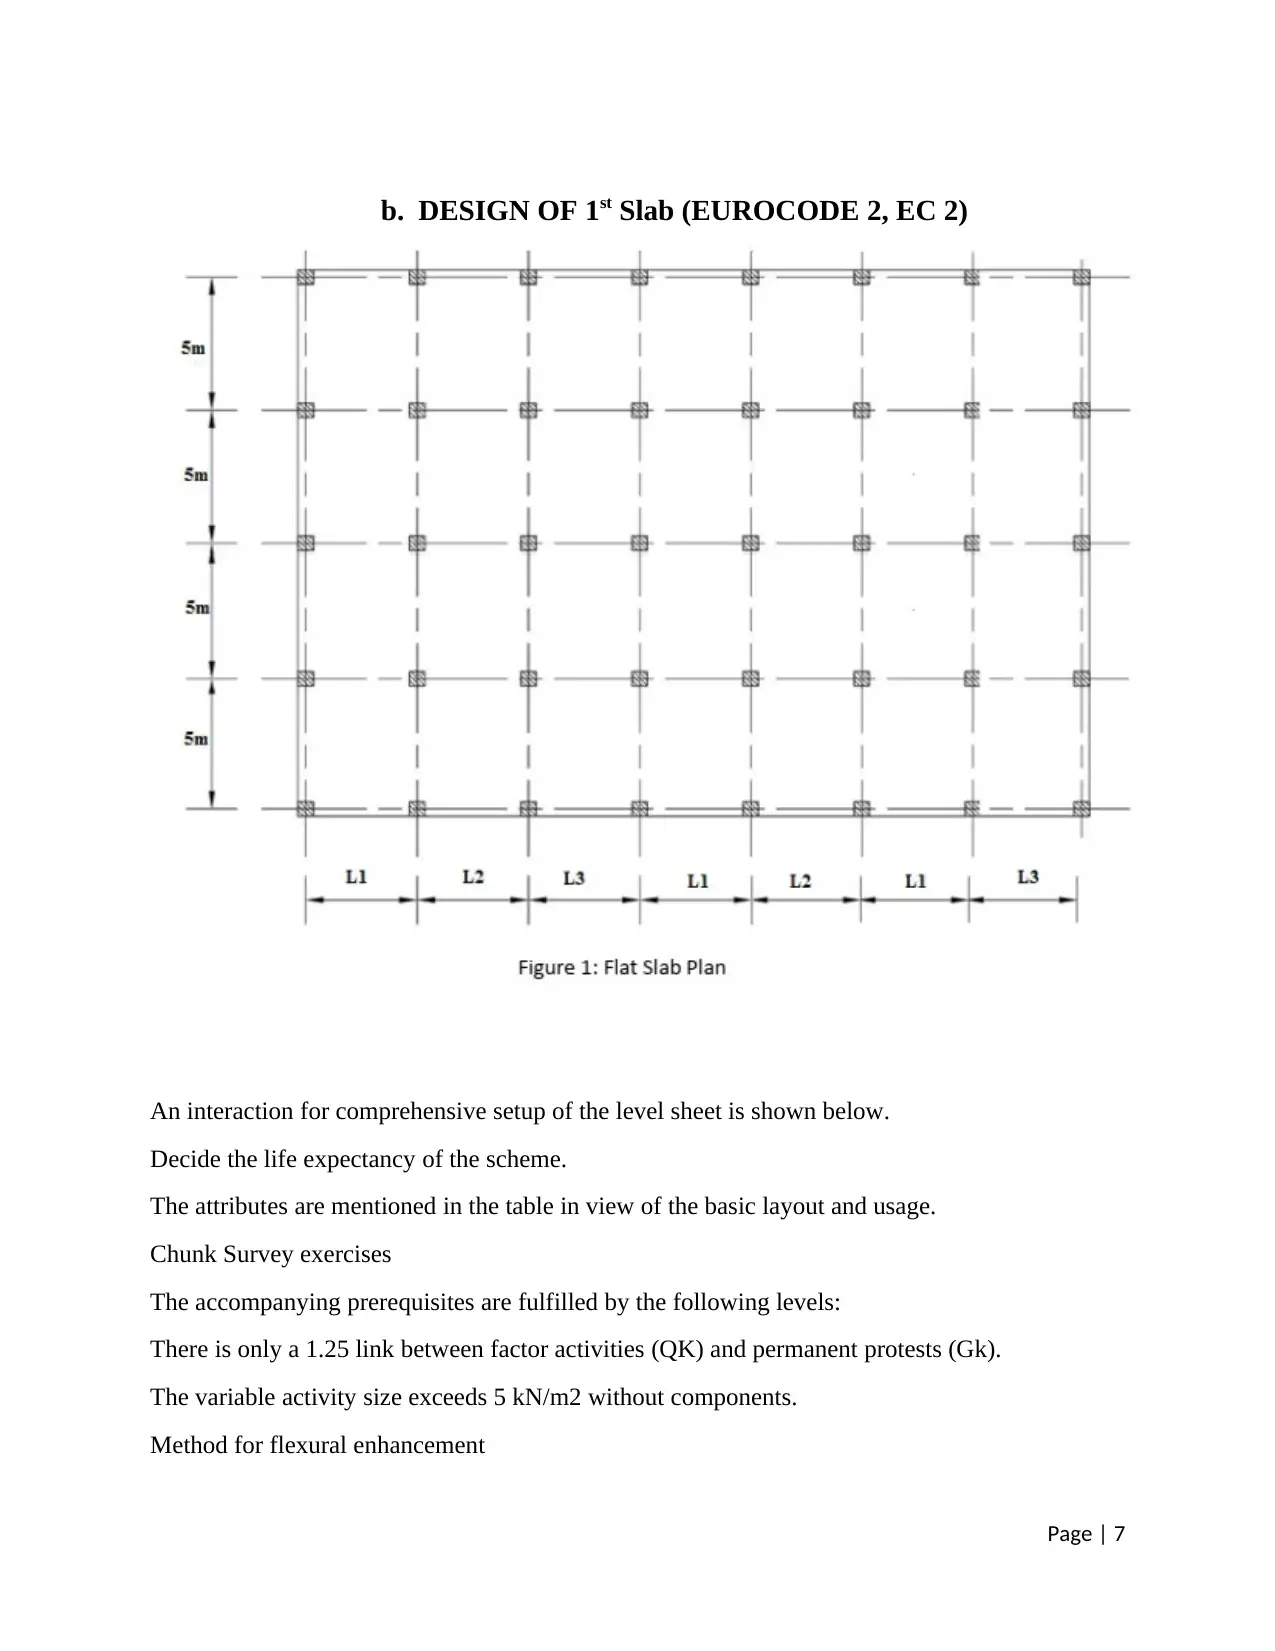
b. DESIGN OF 1st Slab (EUROCODE 2, EC 2)
An interaction for comprehensive setup of the level sheet is shown below.
Decide the life expectancy of the scheme.
The attributes are mentioned in the table in view of the basic layout and usage.
Chunk Survey exercises
The accompanying prerequisites are fulfilled by the following levels:
There is only a 1.25 link between factor activities (QK) and permanent protests (Gk).
The variable activity size exceeds 5 kN/m2 without components.
Method for flexural enhancement
Page | 7
Paraphrase This Document
Need a fresh take? Get an instant paraphrase of this document with our AI Paraphraser
Look at planning opening parts (M)
F is the definitive load of the scheme, whereas l represents the overriding burden.
This test is limited to significant class C5 0/60.
Find the solution to the problem K=M/bd2fck.
K'= 0.60 – 0.182 2 – 0.21 in which = 1.0% of d'or 0.60 – 0.182 2 – 0.21 (rearrangement
proportion) K' Fix the pressure in case of KK. There will be no support for pressure if this is not
the case.
Getting value of Z = d / 2 (1-3.53K) = 0.95 d.
Figure Pressure enhancement requirements for As=M/Fyd*z; requires minor upgrade track.
Fctm* d/FYK, Fyk=25, in, Fctm* d / Fyk, Fyk=25 Fctm*
Check for the most severe expansion prerequisites.
For stress or combination, max = 0.04 Ac outside lap regions.
Look at the evasion.
Eurocode 2 takes into account two types of diversion configuration: restricting range to depth
proportions or investigating hypothetical forwarding using Eurocode articulations. The ratio to
depth should be addressed. System for redirect detection. Calculate the l/d of the diagram below.
Page | 8
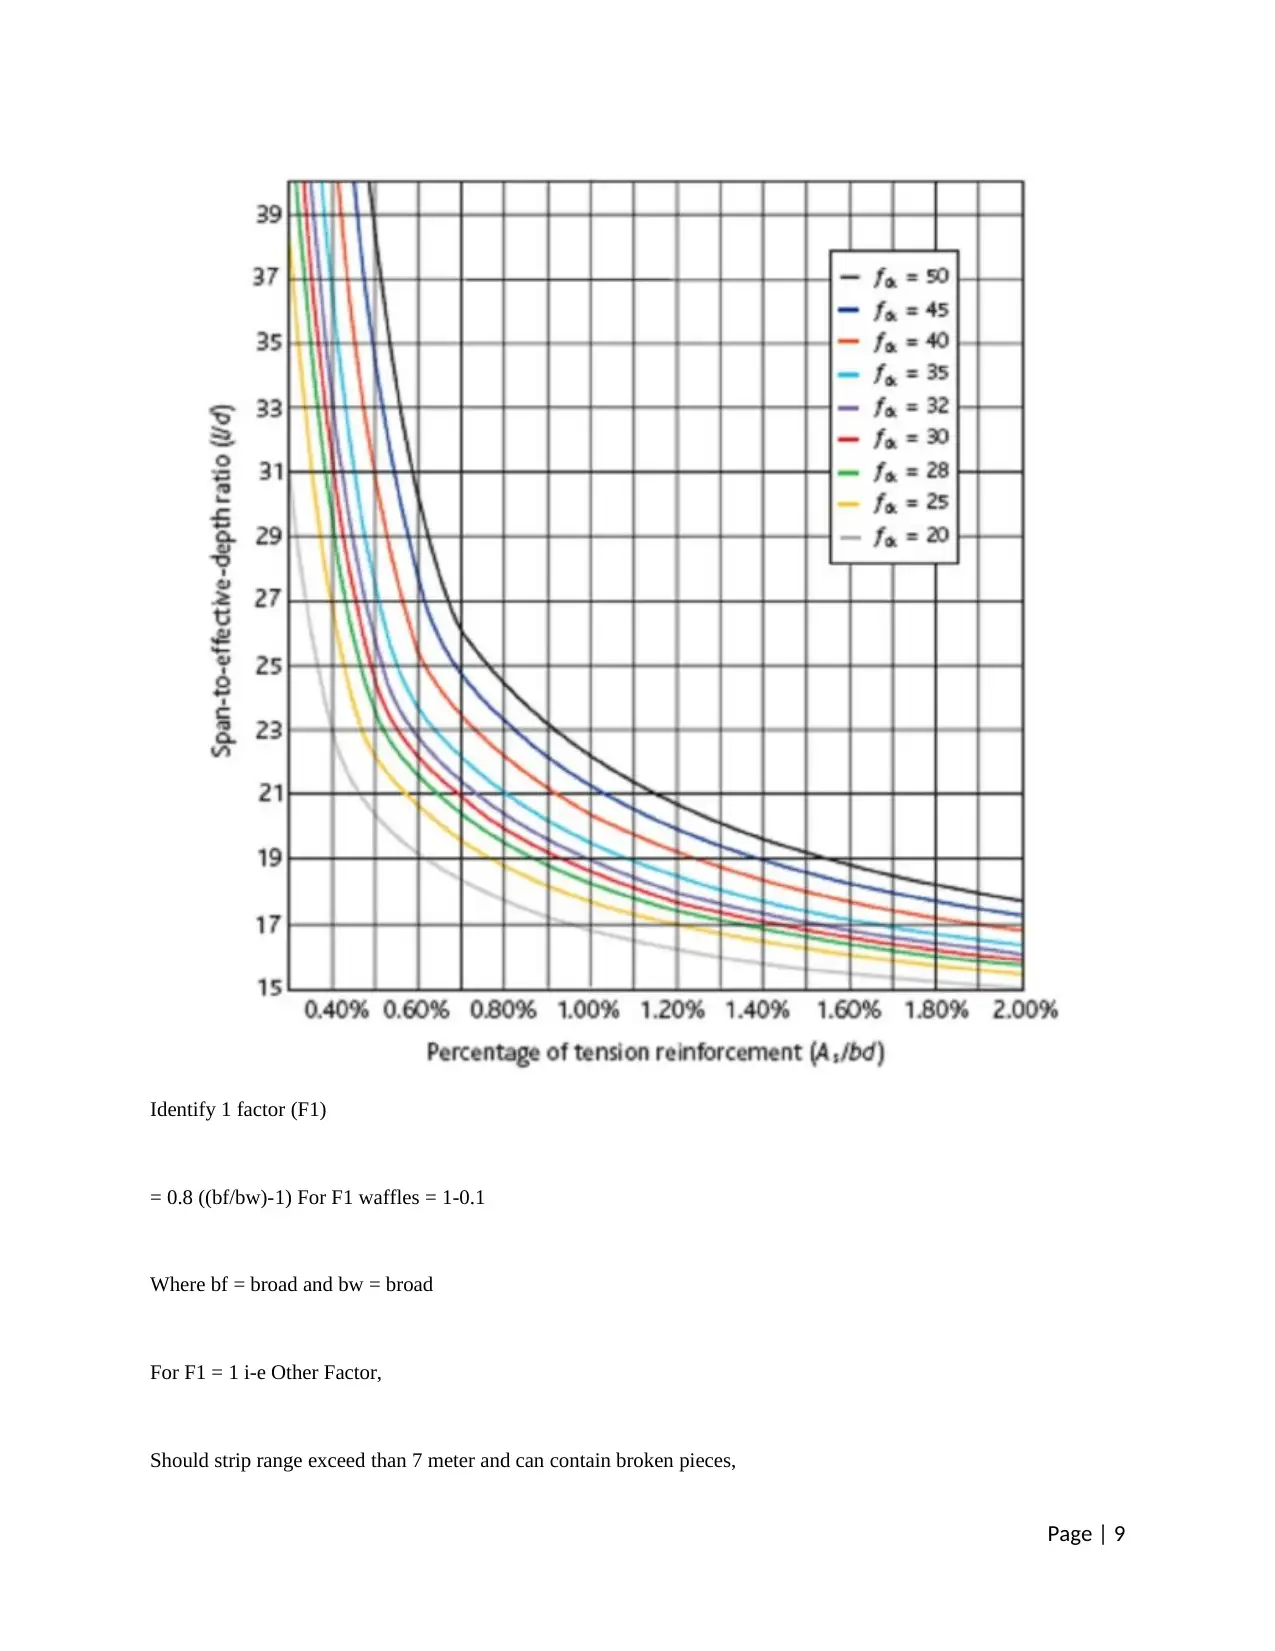
Identify 1 factor (F1)
= 0.8 ((bf/bw)-1) For F1 waffles = 1-0.1
Where bf = broad and bw = broad
For F1 = 1 i-e Other Factor,
Should strip range exceed than 7 meter and can contain broken pieces,
Page | 9
= 0.8 ((bf/bw)-1) For F1 waffles = 1-0.1
Where bf = broad and bw = broad
For F1 = 1 i-e Other Factor,
Should strip range exceed than 7 meter and can contain broken pieces,
Page | 9
⊘ This is a preview!⊘
Do you want full access?
Subscribe today to unlock all pages.
Trusted by 1+ million students worldwide
Thus, F2 = 7 /lef
Factor F2 = 1.0 Factor
Factor 3. F3: 310/s
Where
SS = functionality weight may be considered 290 MPa
(F3 = 1.0)
Essential l/d * F1 * F2 * F3 * Current l/d If this is achieved,
Then further we can calculate as
Shear's shots
Punching the plan appreciation of shear power, VEd, is usually the state support response.
Support should be in a spiral case. However, support might be extended to a matrix where divising requirements are
maintained.
Technique for assurance improvement
Choose factor β
Decide vEd esteem, the most severe shear configuration tension,
where ui is defined as = ( dy + dz ) / 2 segment edge
Decide vRd, Table 1 most extreme
If not adjust, check vEd,max vRd.
Identify vEd thisem (plan shear pressure)
VEd,max = β VEd/(ui deff) with length u1 border controls
Page | 10
Paraphrase This Document
Need a fresh take? Get an instant paraphrase of this document with our AI Paraphraser
In case it meets vEd > vRd,
c is called as Shear reinforcement which is not usually required
Borders of the Shear sponsor region:
Asw = (vEd – 0.75 vRd, c) sr u1 / (1.5 fywd, ef)
Where sr is the Fywd spiral distance,
Ef = 250 + 0.25
Decide which outer edge length is not required for shear support:
= VEd/Uut Uut (vRd,c d)
Check the distance of the bar
Mining or reinforcement
The base area in the main heading is As,
Min = 0.26 Fctm bt d/fyk but at least 0.0013b d.
We also know that foundation of the strength of the vertical punch shear is 1.5 As w,min/(sr.st)=0.08 fck 1⁄2 fyk.
Where sr = excess scattering association, st = distracting combination separating, F may be calculated or provided
Max region fortification
Max = 0.4 Ac should not reach outside lap spaces. Max = 0.4 Ac
Support for the last distance
The basis between bars should be:
Page | 11

Bar width + 20 mm.
Max support distance
The largest dispersion restrictions apply to plates less than 200 mm in thickness:
3h but not more than 400 mm for large support
For support: 3.5h, but not in excess of 450 mm.
The exclusion must apply where concentrated loads or very rapid regions apply:
There is 2 hors but not more than 250mm momentous support
Also for 3h but not in excess of 400 mm for support
Somewhere is the depth of the segment?
Section Calculation as specified by EC 2, Now the plate might be measured for 5 m longer as per the
aforementioned requirements.
More than 5.0 m long
Live load=6.5 kN/m2
Given significant assessment C20/25, e.g. fck=30 MPa
If C20/25 is to be 25 MPa for the chambers and C20/25 to be 20 MPa for the 3D square, chunk depth = range/21
(this depends on longer range)
Depth of effectiveness=314mm
Page | 12
⊘ This is a preview!⊘
Do you want full access?
Subscribe today to unlock all pages.
Trusted by 1+ million students worldwide
1 out of 26
Your All-in-One AI-Powered Toolkit for Academic Success.
+13062052269
info@desklib.com
Available 24*7 on WhatsApp / Email
![[object Object]](/_next/static/media/star-bottom.7253800d.svg)
Unlock your academic potential
Copyright © 2020–2026 A2Z Services. All Rights Reserved. Developed and managed by ZUCOL.