Detailed Investment Portfolio Report: Strategies and Analysis
VerifiedAdded on 2020/02/14
|16
|4968
|31
Report
AI Summary
This report presents a detailed analysis of an investment portfolio, encompassing equities, mutual funds, bonds, bullion, and commodities. It begins with an introduction and macro/microeconomic views, focusing on the UK economy and market sentiments. The report outlines fund diversification strategies, identifying specific holdings with justifications for their selection, comparing intrinsic values to market prices, and assessing associated risk factors. It includes detailed tables illustrating the performance of each asset class, calculating capital gains, and determining return percentages. Investment theories such as Modern Portfolio Theory, CAPM, Gordon's Growth Model, investment styles, and the Efficient Market Hypothesis are also explained. The portfolio aims for a balanced approach, incorporating a variety of financial instruments to achieve a target return of at least 10% while managing moderate risk. The report concludes with an overview of the investment objectives, risk profile, and overall portfolio strategy, highlighting the rationale behind the asset allocation and hedging strategies. The report is prepared for a one-year investment horizon and includes the investment of cash in banks to maximize returns.
INVESTMENT
PORTOFLIO
PORTOFLIO
Paraphrase This Document
Need a fresh take? Get an instant paraphrase of this document with our AI Paraphraser
TABLE OF CONTENTS
INTRODUCTION...........................................................................................................................3
(B) Marco and micro view on investment...................................................................................6
(2) Fund diversification....................................................................................................................9
(a) Industry..................................................................................................................................9
(b & c)Country/ developed and developing markets..................................................................9
(d) Investment vehicles...............................................................................................................9
(3) Identify the holdings.................................................................................................................10
(a) Factors that suggest that holding will perform better over chosen time period...................10
(B) Comparison between intrinsic value and market price ......................................................10
(c) Risk factors in portfolio.......................................................................................................11
(d) Expectation of performance form the portfolio...................................................................11
(4) Conclusion ...............................................................................................................................11
(5) Investment theory ....................................................................................................................12
(a) Modern portfolio theory .....................................................................................................12
(b) CAPM..................................................................................................................................12
(c) Gordon’s growth model.......................................................................................................12
(d) Investment styles.................................................................................................................13
(e) The efficient market hypothesis...........................................................................................13
REFERENCES..............................................................................................................................14
INDEX OF TABLES
Table 1: Portfolio of equity..............................................................................................................4
Table 2: Return percentage on equity after deducting stamp duty cost...........................................4
Table 3: Portfolio of mutual fund....................................................................................................5
Table 4: Actual return percentage on mutual fund after deducting initial cost...............................5
Table 5: Portfolio of bond................................................................................................................6
Table 6: Portfolio of bullion............................................................................................................6
Table 7: Portfolio of commodity......................................................................................................6
Table 8: Liquid amount that remaining after making investment in different financial instruments
..........................................................................................................................................................7
Table 9: Investment of cash in banks...............................................................................................7

Table 10: Aggregate capital gain of entire portfolio........................................................................7
⊘ This is a preview!⊘
Do you want full access?
Subscribe today to unlock all pages.
Trusted by 1+ million students worldwide
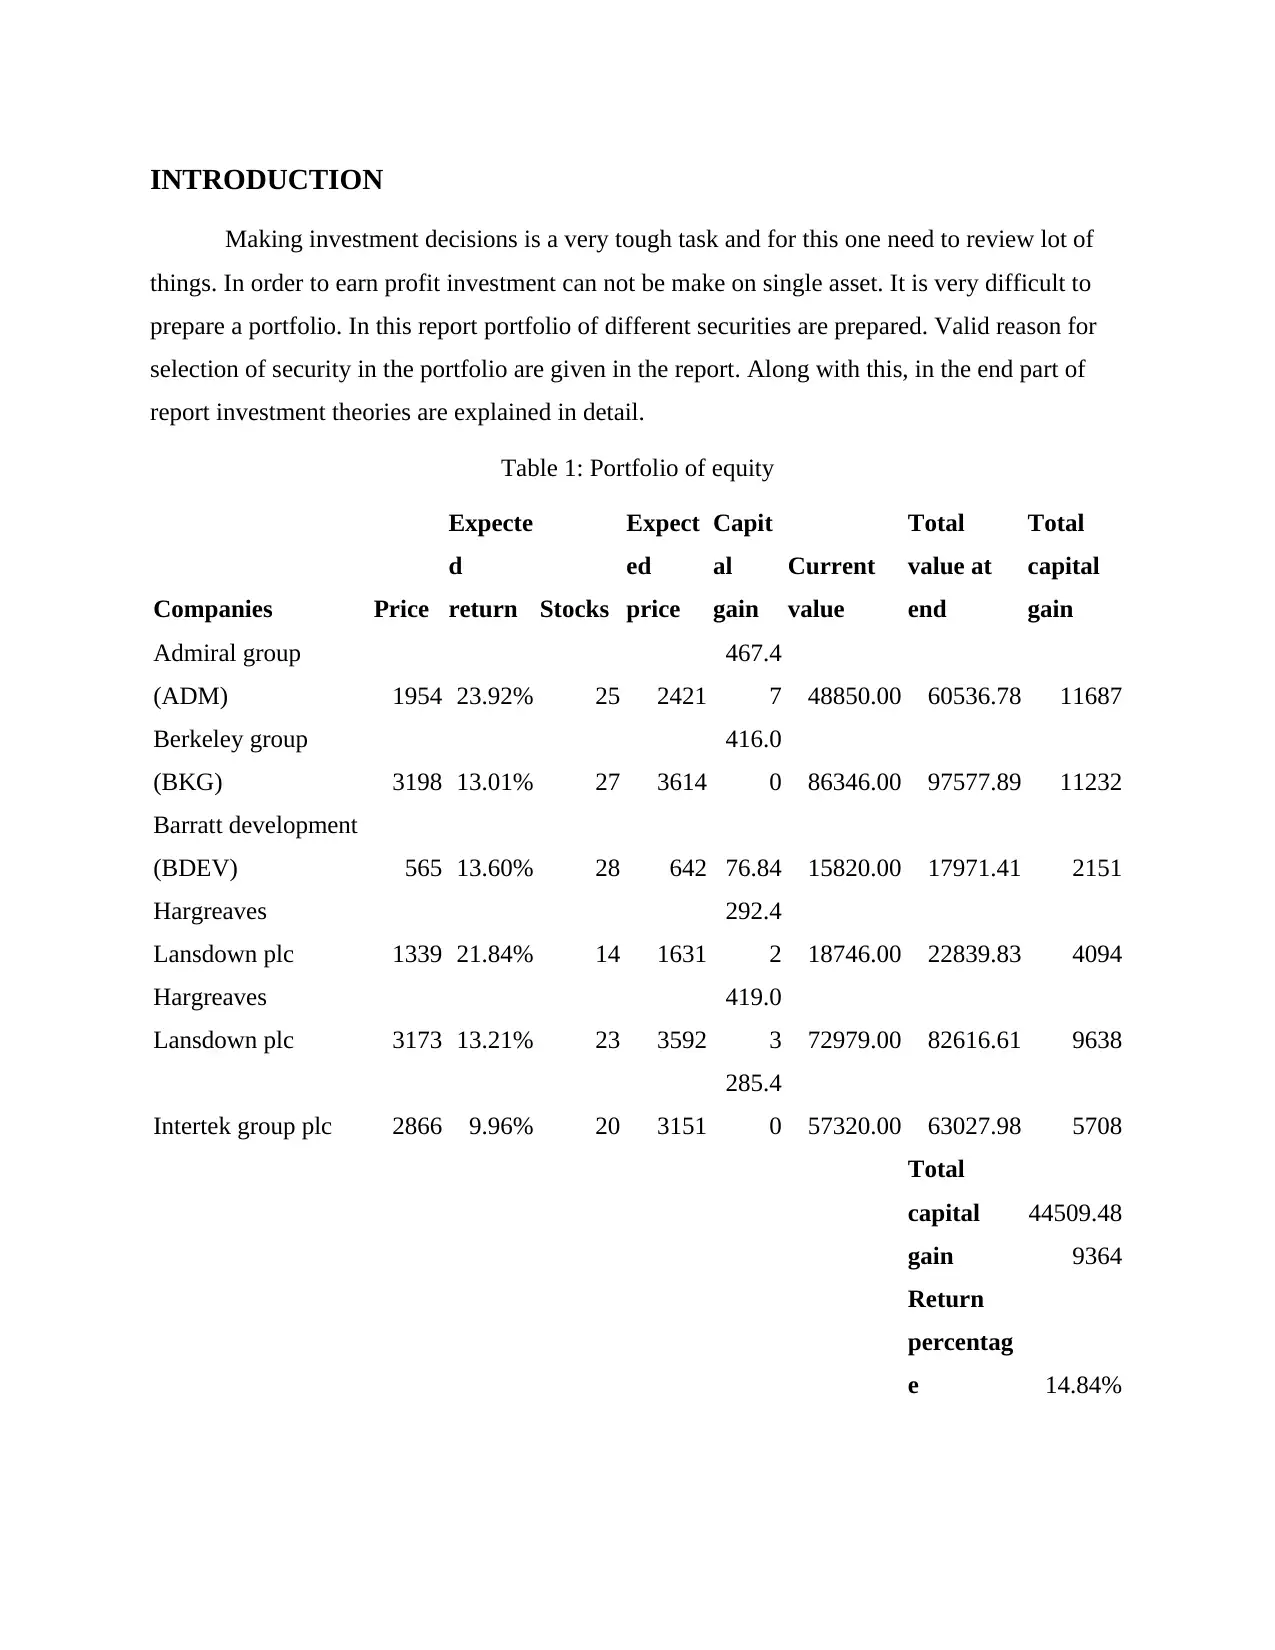
INTRODUCTION
Making investment decisions is a very tough task and for this one need to review lot of
things. In order to earn profit investment can not be make on single asset. It is very difficult to
prepare a portfolio. In this report portfolio of different securities are prepared. Valid reason for
selection of security in the portfolio are given in the report. Along with this, in the end part of
report investment theories are explained in detail.
Table 1: Portfolio of equity
Companies Price
Expecte
d
return Stocks
Expect
ed
price
Capit
al
gain
Current
value
Total
value at
end
Total
capital
gain
Admiral group
(ADM) 1954 23.92% 25 2421
467.4
7 48850.00 60536.78 11687
Berkeley group
(BKG) 3198 13.01% 27 3614
416.0
0 86346.00 97577.89 11232
Barratt development
(BDEV) 565 13.60% 28 642 76.84 15820.00 17971.41 2151
Hargreaves
Lansdown plc 1339 21.84% 14 1631
292.4
2 18746.00 22839.83 4094
Hargreaves
Lansdown plc 3173 13.21% 23 3592
419.0
3 72979.00 82616.61 9638
Intertek group plc 2866 9.96% 20 3151
285.4
0 57320.00 63027.98 5708
Total
capital
gain
44509.48
9364
Return
percentag
e 14.84%
Paraphrase This Document
Need a fresh take? Get an instant paraphrase of this document with our AI Paraphraser
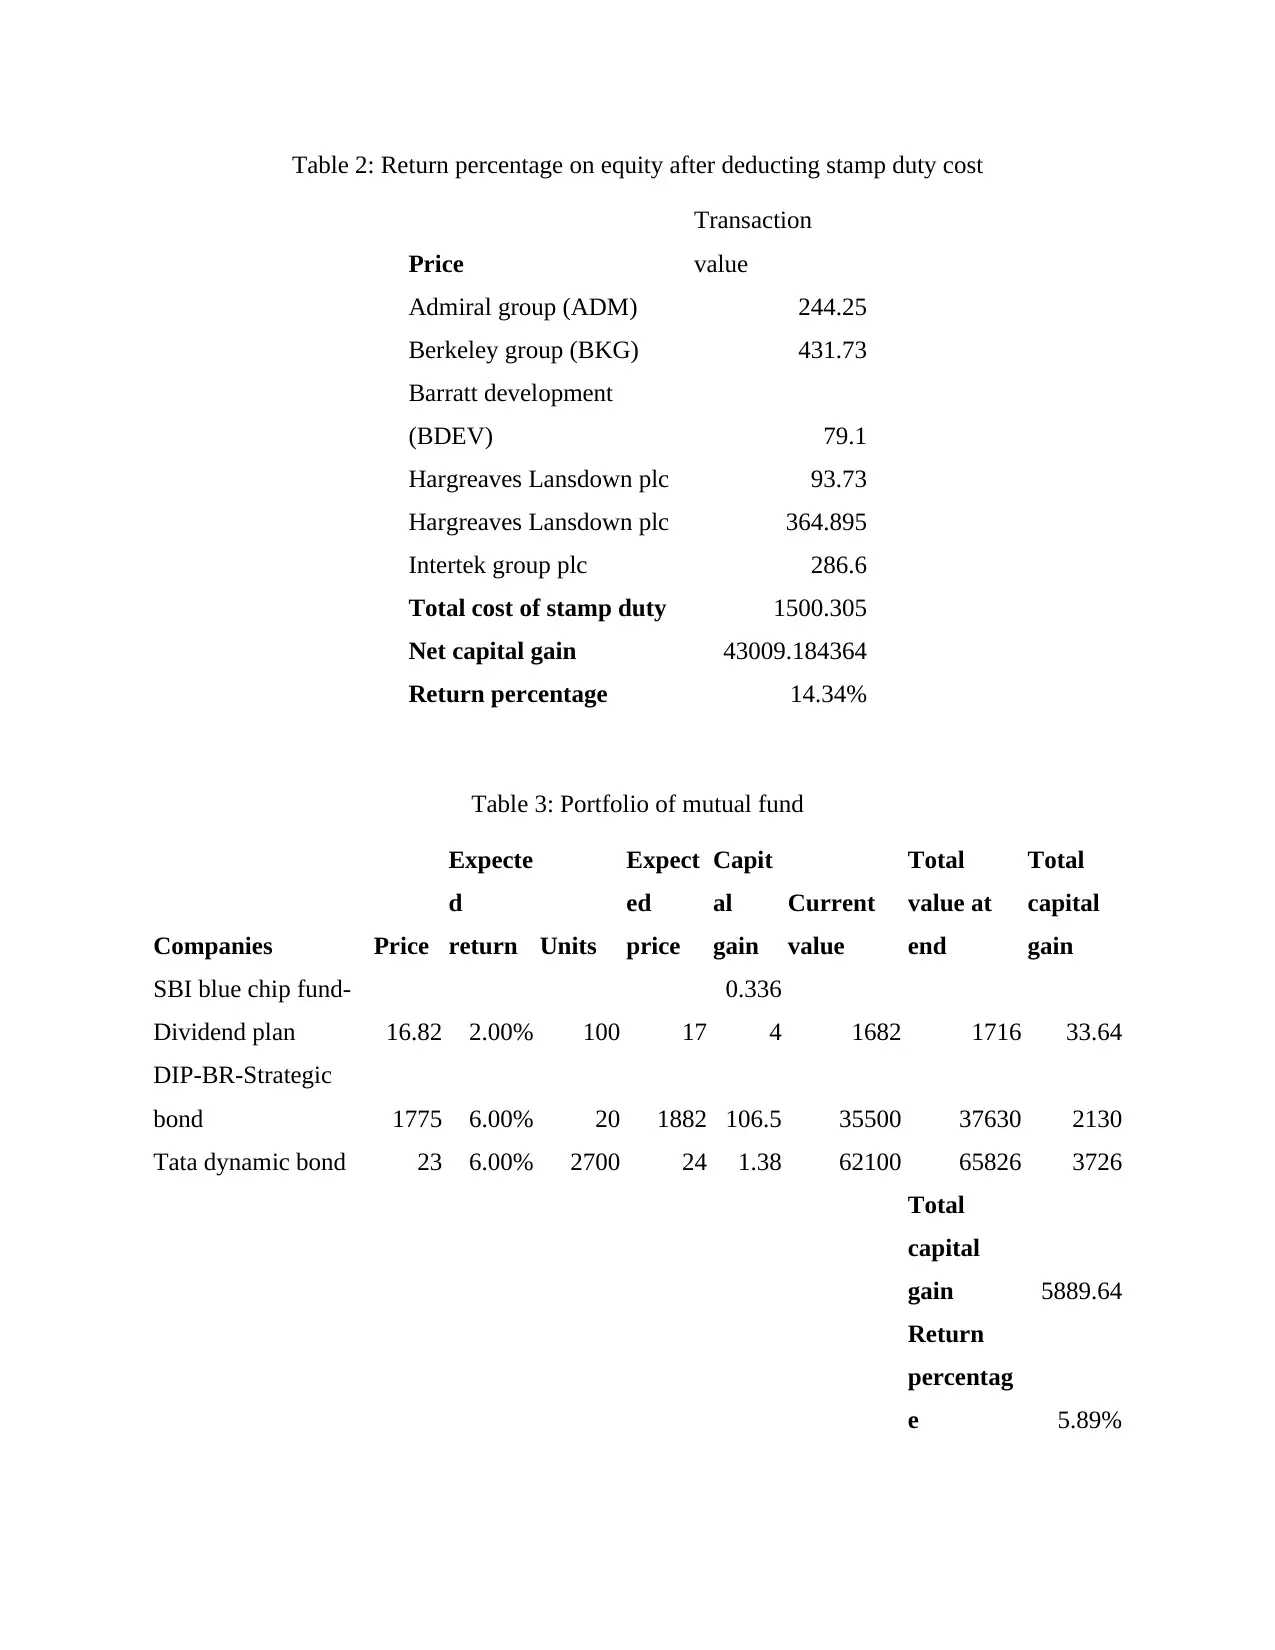
Table 2: Return percentage on equity after deducting stamp duty cost
Price
Transaction
value
Admiral group (ADM) 244.25
Berkeley group (BKG) 431.73
Barratt development
(BDEV) 79.1
Hargreaves Lansdown plc 93.73
Hargreaves Lansdown plc 364.895
Intertek group plc 286.6
Total cost of stamp duty 1500.305
Net capital gain 43009.184364
Return percentage 14.34%
Table 3: Portfolio of mutual fund
Companies Price
Expecte
d
return Units
Expect
ed
price
Capit
al
gain
Current
value
Total
value at
end
Total
capital
gain
SBI blue chip fund-
Dividend plan 16.82 2.00% 100 17
0.336
4 1682 1716 33.64
DIP-BR-Strategic
bond 1775 6.00% 20 1882 106.5 35500 37630 2130
Tata dynamic bond 23 6.00% 2700 24 1.38 62100 65826 3726
Total
capital
gain 5889.64
Return
percentag
e 5.89%
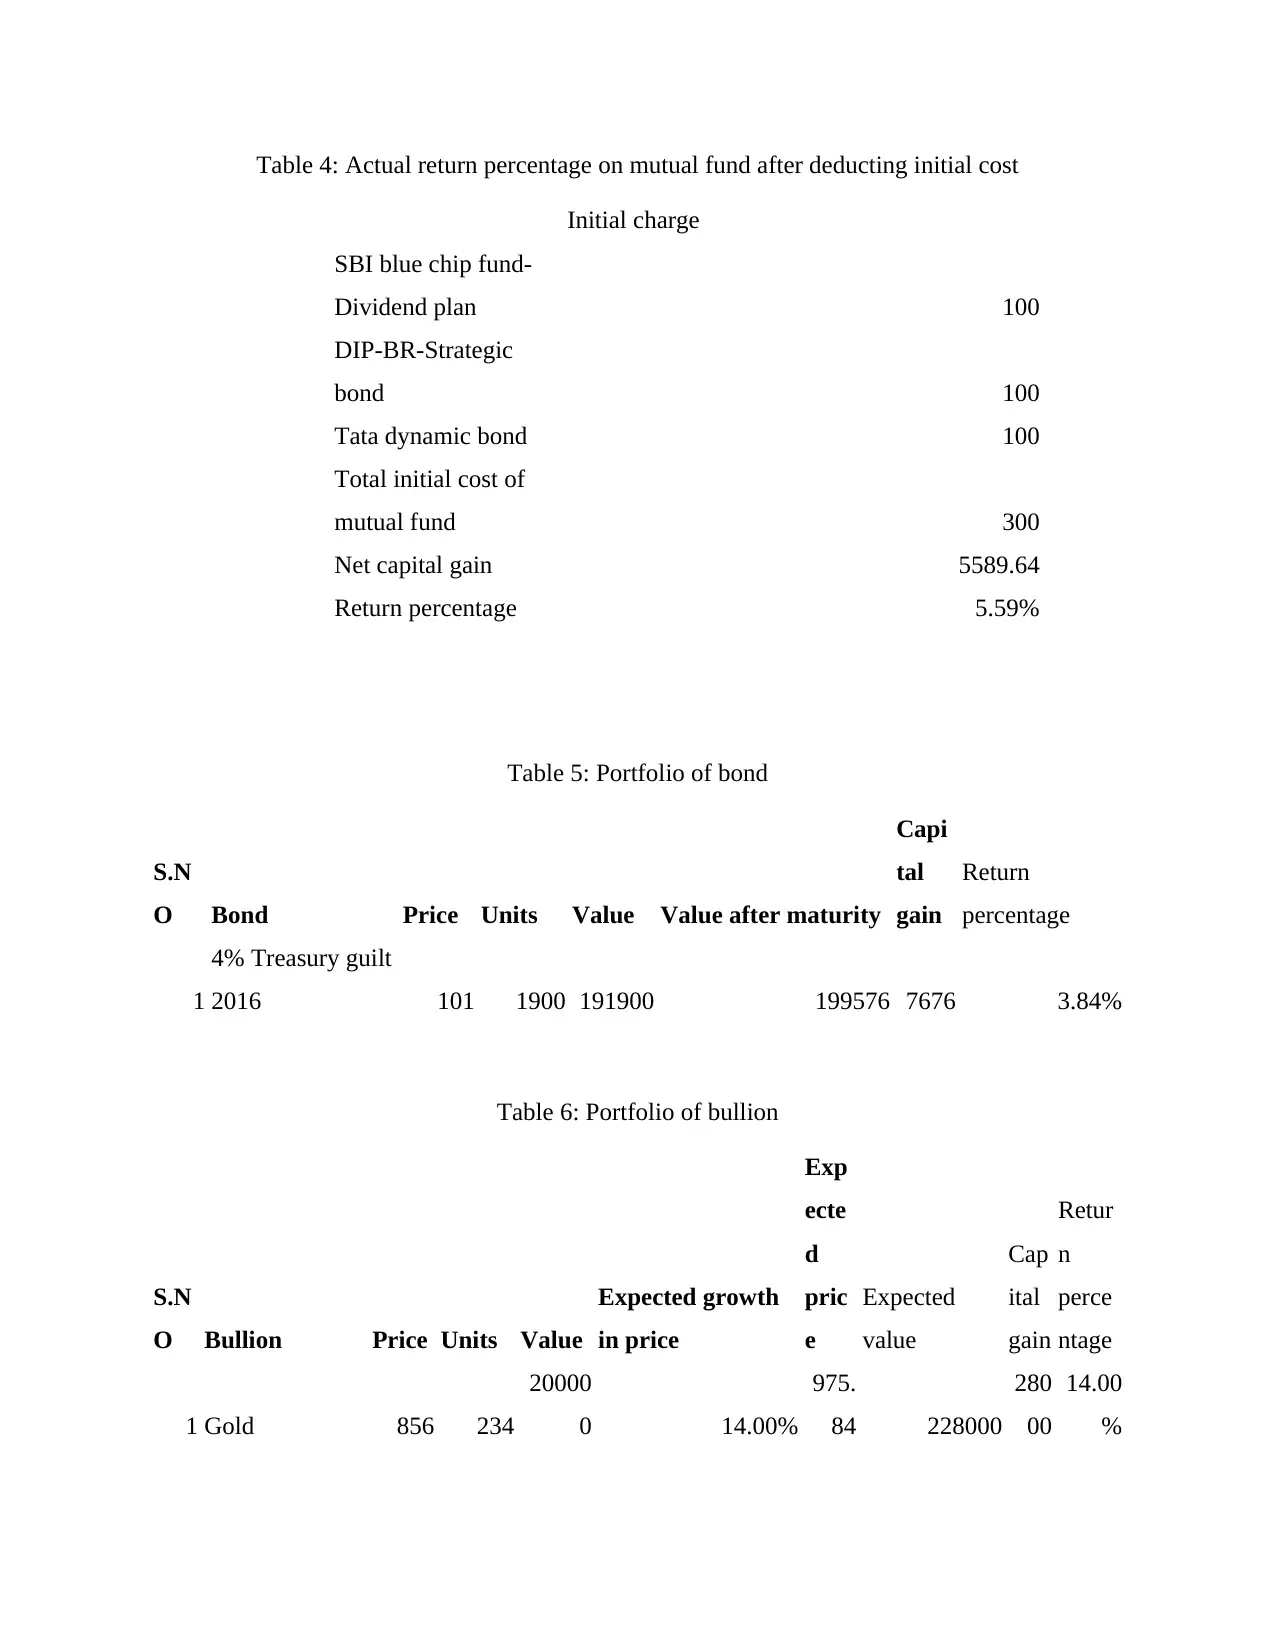
Table 4: Actual return percentage on mutual fund after deducting initial cost
Initial charge
SBI blue chip fund-
Dividend plan 100
DIP-BR-Strategic
bond 100
Tata dynamic bond 100
Total initial cost of
mutual fund 300
Net capital gain 5589.64
Return percentage 5.59%
Table 5: Portfolio of bond
S.N
O Bond Price Units Value Value after maturity
Capi
tal
gain
Return
percentage
1
4% Treasury guilt
2016 101 1900 191900 199576 7676 3.84%
Table 6: Portfolio of bullion
S.N
O Bullion Price Units Value
Expected growth
in price
Exp
ecte
d
pric
e
Expected
value
Cap
ital
gain
Retur
n
perce
ntage
1 Gold 856 234
20000
0 14.00%
975.
84 228000
280
00
14.00
%
⊘ This is a preview!⊘
Do you want full access?
Subscribe today to unlock all pages.
Trusted by 1+ million students worldwide
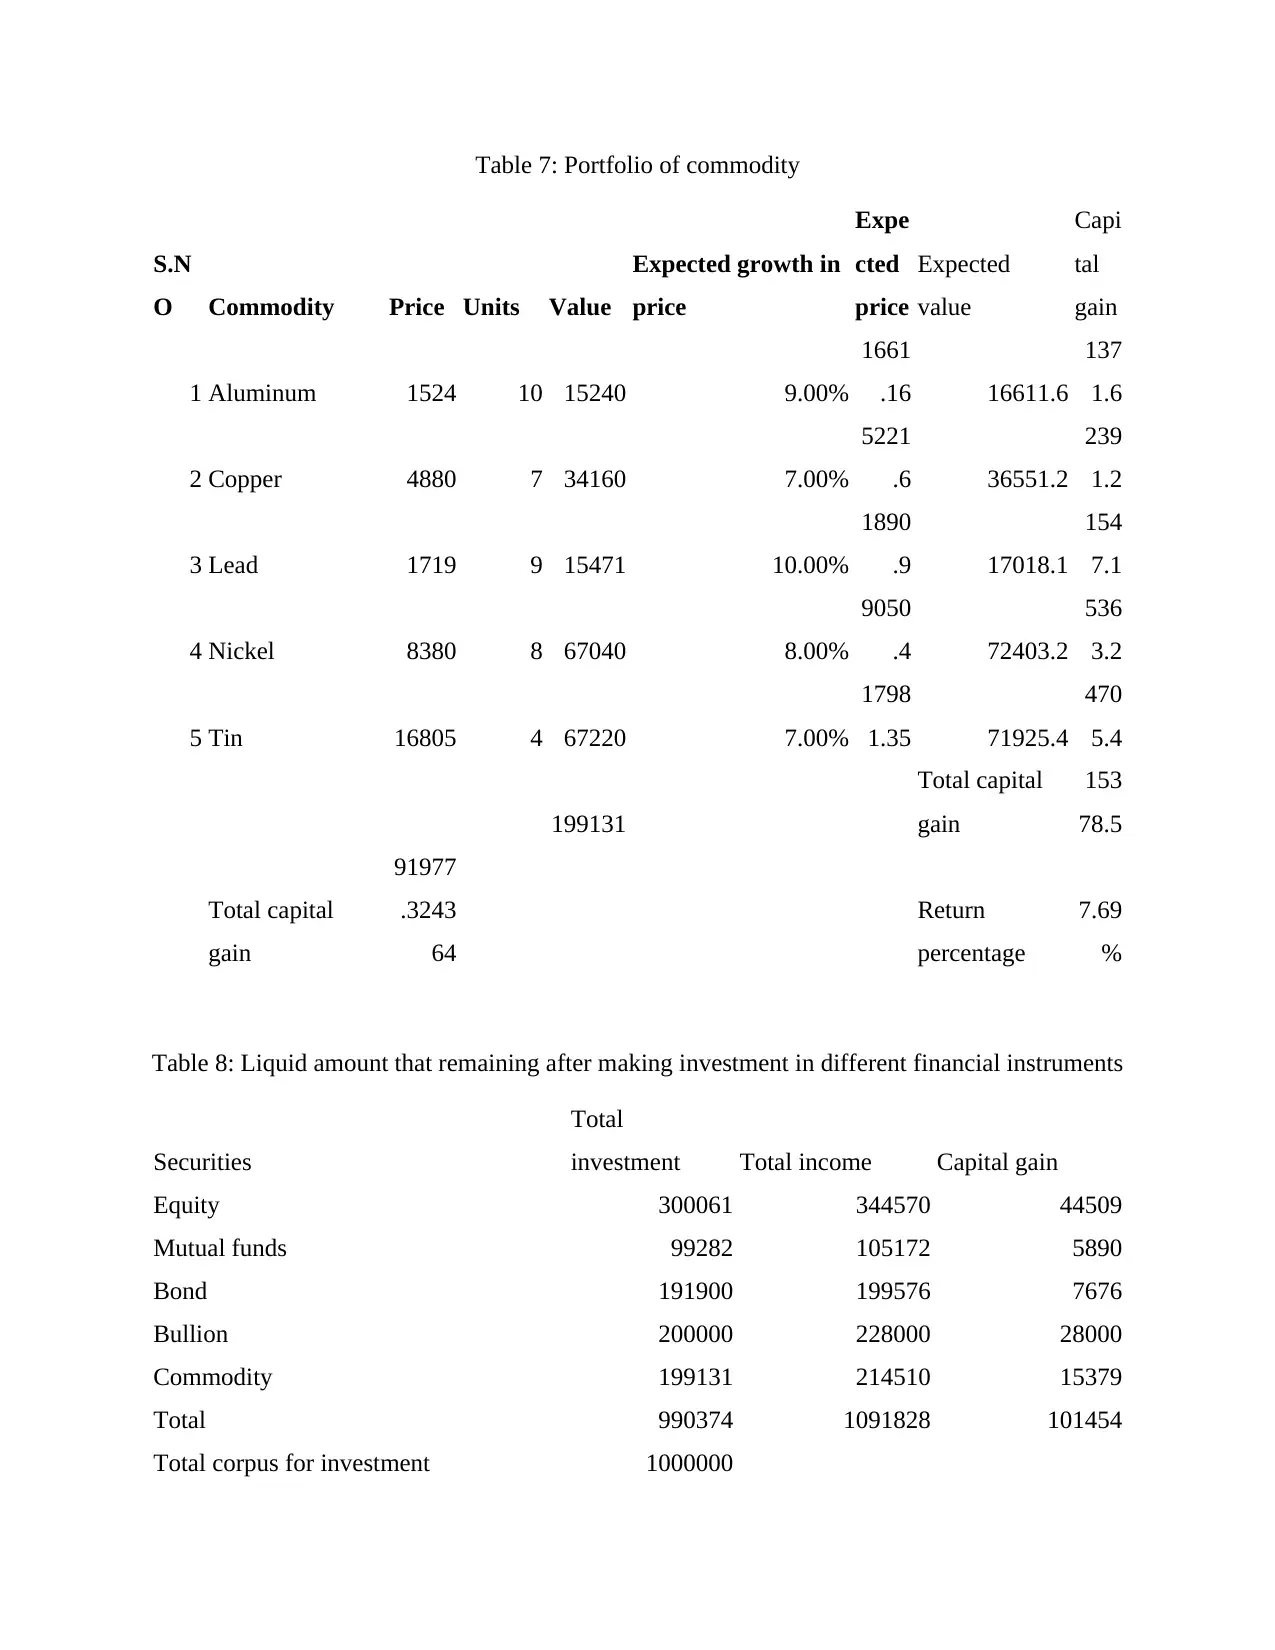
Table 7: Portfolio of commodity
S.N
O Commodity Price Units Value
Expected growth in
price
Expe
cted
price
Expected
value
Capi
tal
gain
1 Aluminum 1524 10 15240 9.00%
1661
.16 16611.6
137
1.6
2 Copper 4880 7 34160 7.00%
5221
.6 36551.2
239
1.2
3 Lead 1719 9 15471 10.00%
1890
.9 17018.1
154
7.1
4 Nickel 8380 8 67040 8.00%
9050
.4 72403.2
536
3.2
5 Tin 16805 4 67220 7.00%
1798
1.35 71925.4
470
5.4
199131
Total capital
gain
153
78.5
Total capital
gain
91977
.3243
64
Return
percentage
7.69
%
Table 8: Liquid amount that remaining after making investment in different financial instruments
Securities
Total
investment Total income Capital gain
Equity 300061 344570 44509
Mutual funds 99282 105172 5890
Bond 191900 199576 7676
Bullion 200000 228000 28000
Commodity 199131 214510 15379
Total 990374 1091828 101454
Total corpus for investment 1000000
Paraphrase This Document
Need a fresh take? Get an instant paraphrase of this document with our AI Paraphraser
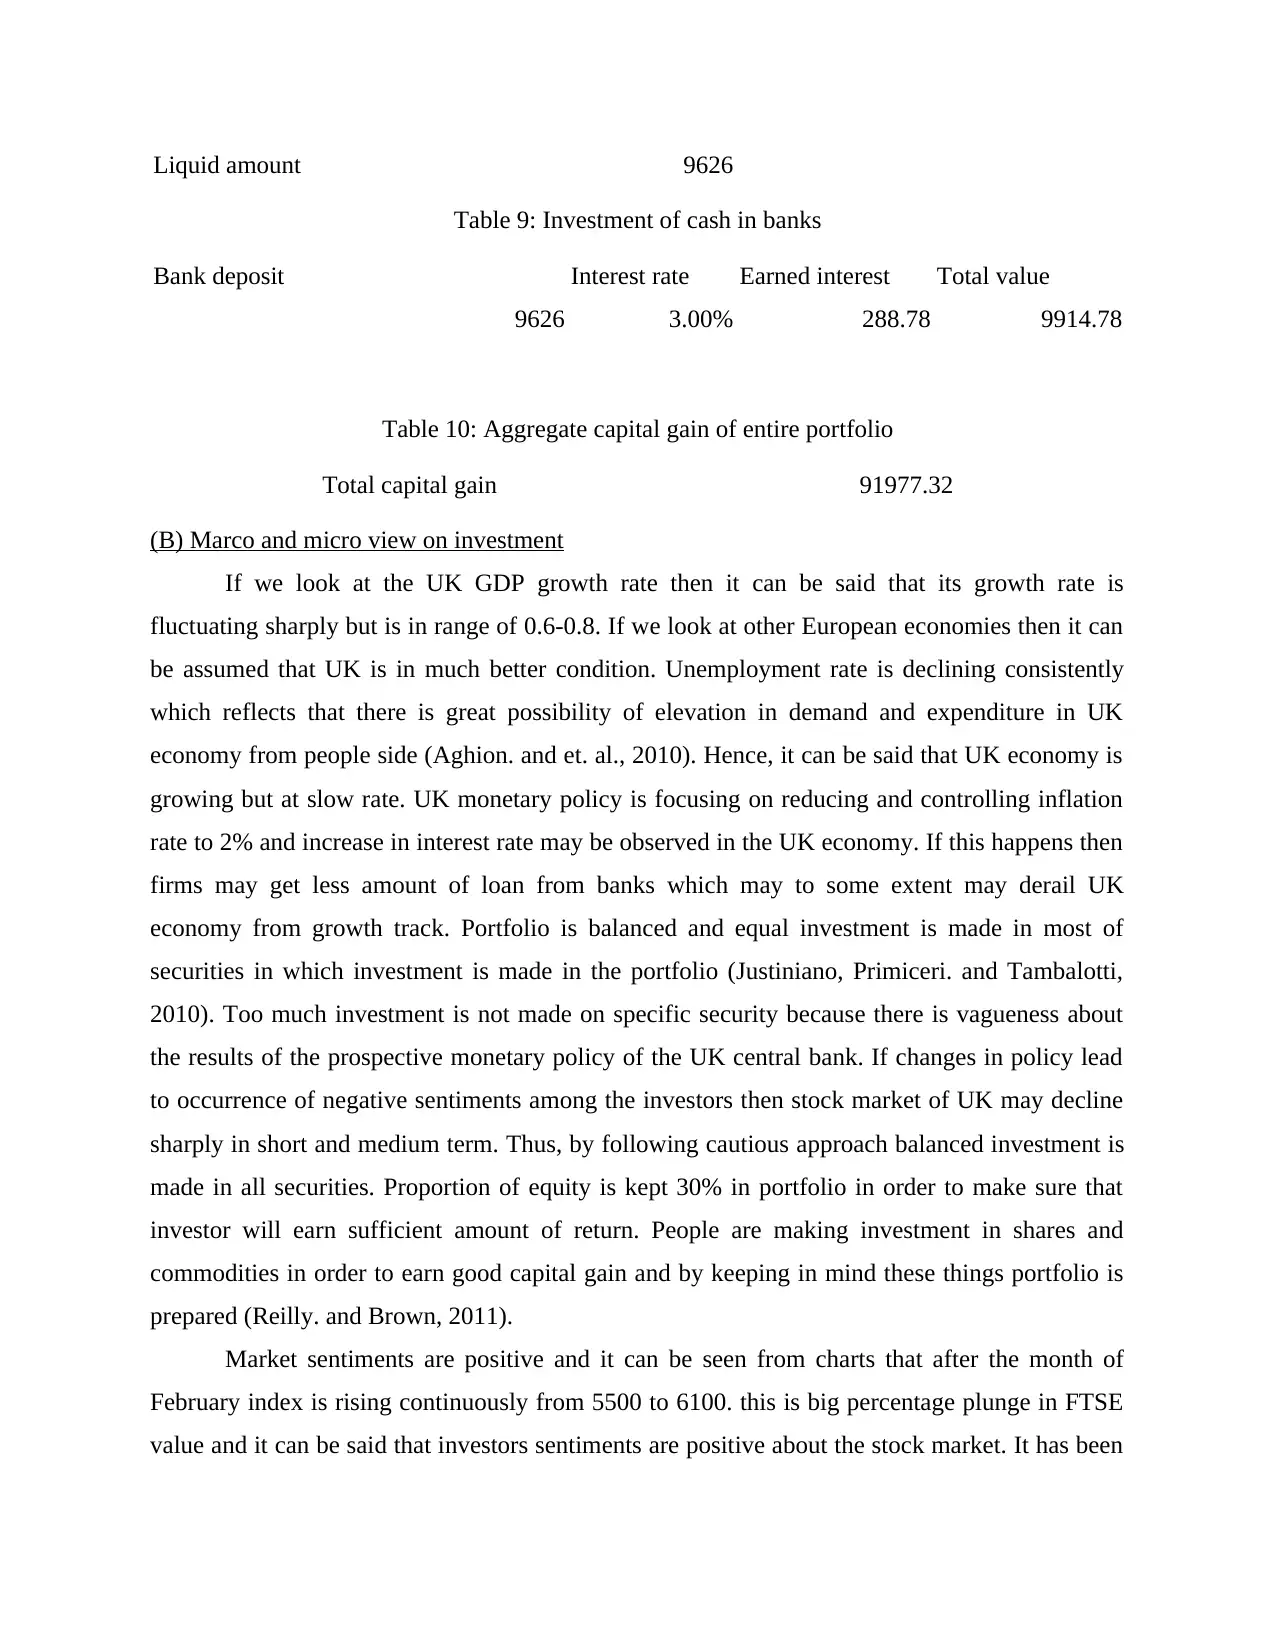
Liquid amount 9626
Table 9: Investment of cash in banks
Bank deposit Interest rate Earned interest Total value
9626 3.00% 288.78 9914.78
Table 10: Aggregate capital gain of entire portfolio
Total capital gain 91977.32
(B) Marco and micro view on investment
If we look at the UK GDP growth rate then it can be said that its growth rate is
fluctuating sharply but is in range of 0.6-0.8. If we look at other European economies then it can
be assumed that UK is in much better condition. Unemployment rate is declining consistently
which reflects that there is great possibility of elevation in demand and expenditure in UK
economy from people side (Aghion. and et. al., 2010). Hence, it can be said that UK economy is
growing but at slow rate. UK monetary policy is focusing on reducing and controlling inflation
rate to 2% and increase in interest rate may be observed in the UK economy. If this happens then
firms may get less amount of loan from banks which may to some extent may derail UK
economy from growth track. Portfolio is balanced and equal investment is made in most of
securities in which investment is made in the portfolio (Justiniano, Primiceri. and Tambalotti,
2010). Too much investment is not made on specific security because there is vagueness about
the results of the prospective monetary policy of the UK central bank. If changes in policy lead
to occurrence of negative sentiments among the investors then stock market of UK may decline
sharply in short and medium term. Thus, by following cautious approach balanced investment is
made in all securities. Proportion of equity is kept 30% in portfolio in order to make sure that
investor will earn sufficient amount of return. People are making investment in shares and
commodities in order to earn good capital gain and by keeping in mind these things portfolio is
prepared (Reilly. and Brown, 2011).
Market sentiments are positive and it can be seen from charts that after the month of
February index is rising continuously from 5500 to 6100. this is big percentage plunge in FTSE
value and it can be said that investors sentiments are positive about the stock market. It has been
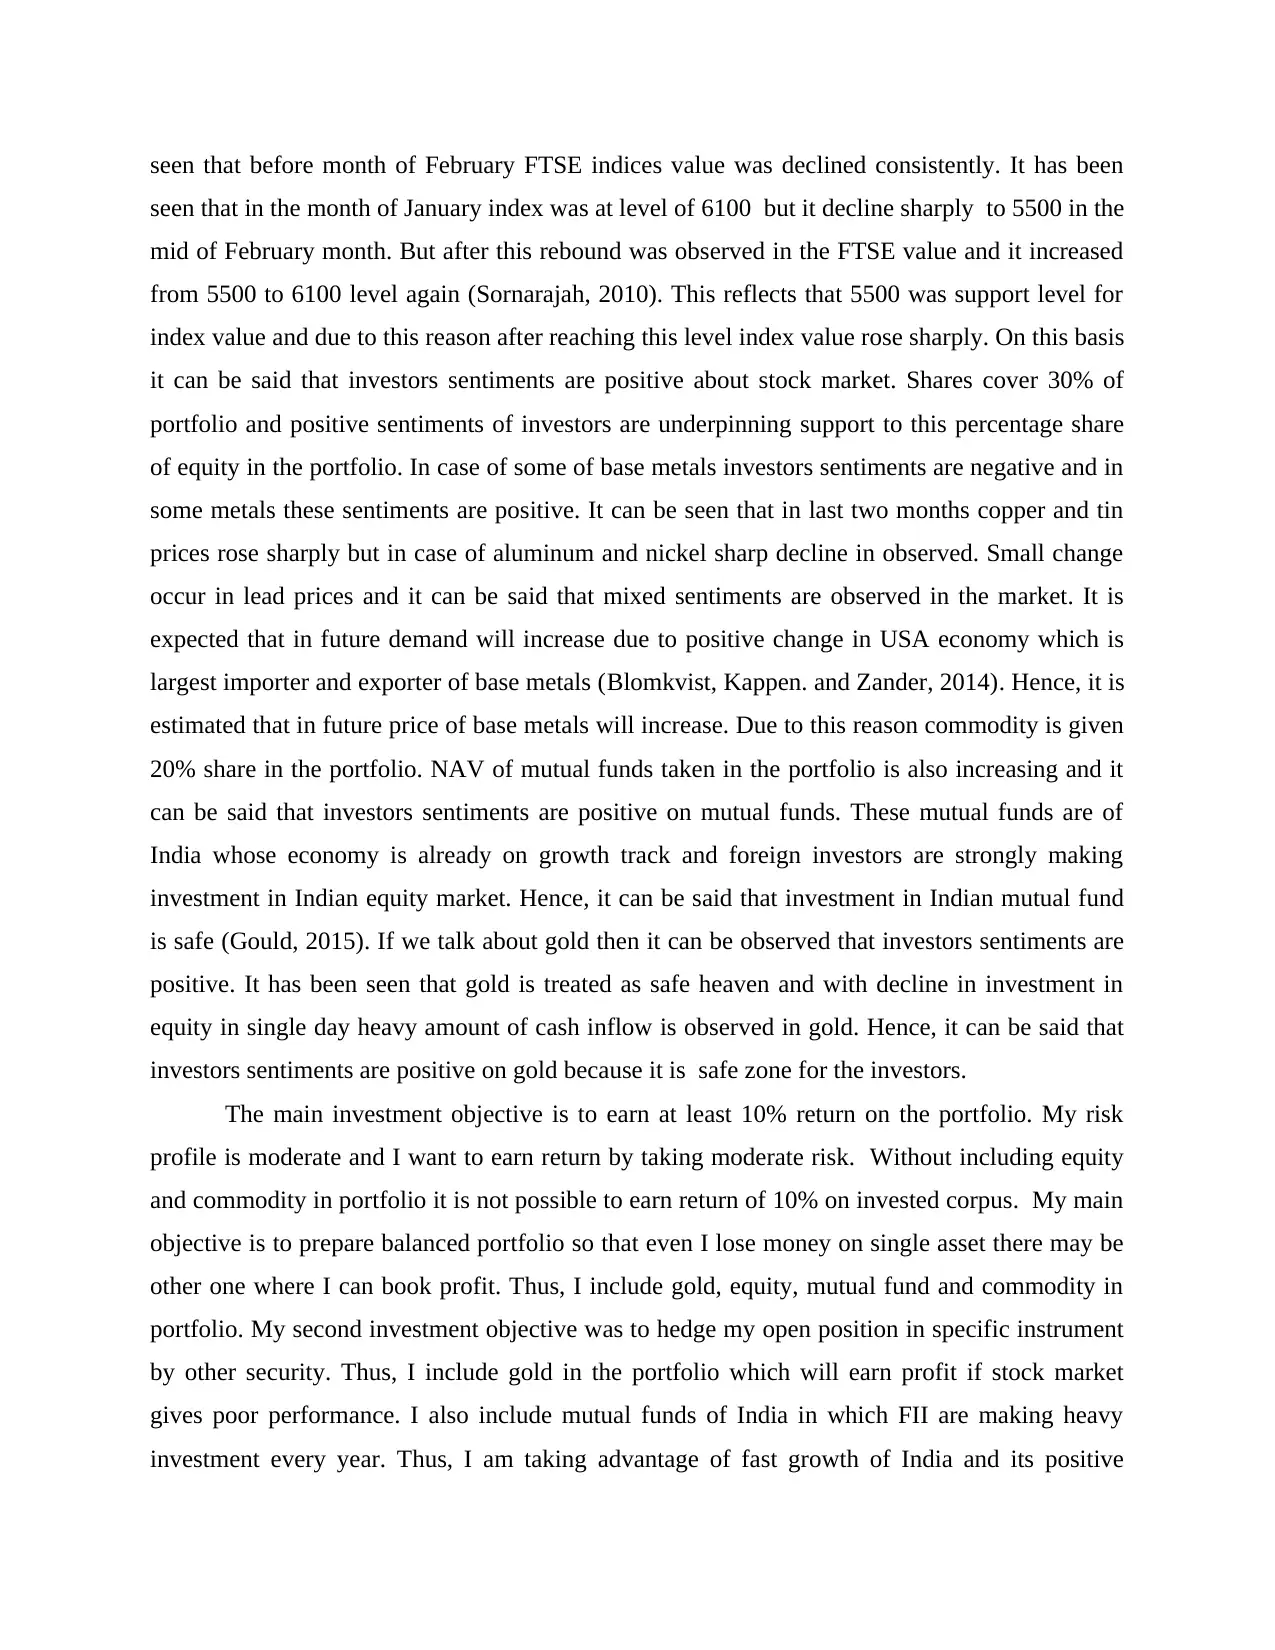
seen that before month of February FTSE indices value was declined consistently. It has been
seen that in the month of January index was at level of 6100 but it decline sharply to 5500 in the
mid of February month. But after this rebound was observed in the FTSE value and it increased
from 5500 to 6100 level again (Sornarajah, 2010). This reflects that 5500 was support level for
index value and due to this reason after reaching this level index value rose sharply. On this basis
it can be said that investors sentiments are positive about stock market. Shares cover 30% of
portfolio and positive sentiments of investors are underpinning support to this percentage share
of equity in the portfolio. In case of some of base metals investors sentiments are negative and in
some metals these sentiments are positive. It can be seen that in last two months copper and tin
prices rose sharply but in case of aluminum and nickel sharp decline in observed. Small change
occur in lead prices and it can be said that mixed sentiments are observed in the market. It is
expected that in future demand will increase due to positive change in USA economy which is
largest importer and exporter of base metals (Blomkvist, Kappen. and Zander, 2014). Hence, it is
estimated that in future price of base metals will increase. Due to this reason commodity is given
20% share in the portfolio. NAV of mutual funds taken in the portfolio is also increasing and it
can be said that investors sentiments are positive on mutual funds. These mutual funds are of
India whose economy is already on growth track and foreign investors are strongly making
investment in Indian equity market. Hence, it can be said that investment in Indian mutual fund
is safe (Gould, 2015). If we talk about gold then it can be observed that investors sentiments are
positive. It has been seen that gold is treated as safe heaven and with decline in investment in
equity in single day heavy amount of cash inflow is observed in gold. Hence, it can be said that
investors sentiments are positive on gold because it is safe zone for the investors.
The main investment objective is to earn at least 10% return on the portfolio. My risk
profile is moderate and I want to earn return by taking moderate risk. Without including equity
and commodity in portfolio it is not possible to earn return of 10% on invested corpus. My main
objective is to prepare balanced portfolio so that even I lose money on single asset there may be
other one where I can book profit. Thus, I include gold, equity, mutual fund and commodity in
portfolio. My second investment objective was to hedge my open position in specific instrument
by other security. Thus, I include gold in the portfolio which will earn profit if stock market
gives poor performance. I also include mutual funds of India in which FII are making heavy
investment every year. Thus, I am taking advantage of fast growth of India and its positive
⊘ This is a preview!⊘
Do you want full access?
Subscribe today to unlock all pages.
Trusted by 1+ million students worldwide
impact on the value of securities. Even, I face loss in equity and commodities there will be gold,
bonds and Indian mutual fund that will protect my capital to some extent and will help me in
earning 10% return on my portfolio.
This portfolio is prepared for one year and in this regard return percentage of all
securities in the portfolio are taken in to account. Currently, market are much volatile and in
short term is very difficult to take wise investment decisions (Gold price, 2016). In short run I
may face heavy loss on investment and by following cautious approach it is determined that
investment will be made for one year in all securities.
In order to measure performance of the portfolio in case of equity FTSE 100 will be
benchmark for equity. This is taken as benchmark because all shares in the portfolio are part of
FTSE 100. At end of the year, in order to measure performance of portfolio actual return of same
will be compared with FTSE 100 return percentage (Horie, 2015). In case of commodity LME
metals index will be considered and like equity it will be identified whether portfolio perform
better or worst. In case of mutual fund there is a scheme SBI blue chip fund which makes
investment in large cap firms. Means that this fund is making investment in BSE 30 companies.
Thus, performance of this mutual fund scheme will be compared with value of SENSEX.
MIBOR will act as parameter for debt mutual fund schemes. If these schemes gives at a rate
above MIBOR rate then it will be assumed that fund perform better.
(2) Fund diversification
(a) Industry
On the basis of industry portfolio for equity is prepared. In this portfolio five companies
shares are taken that belongs to insurance, home construction, finance services, management
consultancy and tourism sector. Hence, it can be said that focus is not on single industry and
those industries that are growing rapidly in UK are considered in the portfolio. Tourism sector is
one fastest growing industry of UK which have 10% share in its GDP (Kaiser, El Arbi. and
Ahlemann, 2015). Demand for houses is rising in UK and due to this reason two home
construction companies are taken in the portfolio. Management consultancy firms of UK have
good presence in nations like India from there these firms are earning huge revenue and it is the
reason due to which this industry firm is taken in the portfolio. There is good scope of growth in
this industry. Insurance firm which is doing same of vehicle is taken in portfolio because demand
Paraphrase This Document
Need a fresh take? Get an instant paraphrase of this document with our AI Paraphraser
of cars and other vehicles is increased in the UK (Klingebiel. and Rammer, 2014). Financial
services is important part of service sector of UK and due to this reason investment is made in
financial service sector. Hence, it can be said that there is reason for selection of each and every
sector in the portfolio.
(b & c)Country/ developed and developing markets
In portfolio construction two nations are taken one is UK and other is India. UK is taken because
it is homeland and there is detail knowledge of UK companies and FTSE 100 performance and
way in which it is fluctuate in the market (Kvist, 2015). Investment is made in the Indian mutual
funds because main purpose behind doing investment in same is to protect capital and to earn
good return. Investment in Indian market to large extent is safe and this nation receive heavy
amount of FII in last couple of years. Thus, in order to achieve objective investment is made in
the Indian market mutual funds.
(d) Investment vehicles
In portfolio investment is made in equity, mutual funds, bullion, commodity and bond.
While preparing this portfolio passive investment strategy is followed. In this strategy
investment is made in safe securities and frequently items in the portfolio are not changed ( Pan
and et.al., 2015). This portfolio is prepared for one year and no change will take place in same
before a year. Investment is made in balanced manner in all securities. This, proved that passive
investment strategy is followed in portfolio creation.
(3) Identify the holdings
(a) Factors that suggest that holding will perform better over chosen time period Equity- First of all it is necessary to make clear that while making investment
fundamental analysis approach is followed instead of technical analysis. So there is no
chart in the report. Holdings in equity will perform better because all shares included
either have good return percentage or have moderate beta. Companies are well known in
UK and belong to the sectors which are growing rapidly in UK. These are some of
features that suggest that holding will perform good. Mutual fund- Indian economy is growing and its mutual funds are giving good return
(Top performers, star ratings, most bought & sold funds: start your research here. 2016).
Thus, these are the features that are taken in to account while selecting mutual fund
schemes in portfolio. Bond- Rate of return is fixed in selected bond and investment in same is safe and it is the
feature due to this which it is selected in the portfolio. Commodity- Price of base metals will increase with elevation in demand in USA and
China market. USA market is on growth track and its growth rate will increase in future.
There is vagueness of likely performance of Chinese economy . With small change in
base metals price huge profit is earned on the commodity. Hence, these are the important
features due to which investment is made in commodity.
Bullion- It is observed that when stock market fall most of investors makes investment in
gold (Gold price, 2016). This is feature due to which investment is made in gold.
(B) Comparison between intrinsic value and market price
No comparison is made between the intrinsic value and market price because intrinsic
value only indicate true value of share by considering its performance. In real world investors
does not mainly consider intrinsic value before making investment. Hence, intrinsic value is not
considered in portfolio creation.
(c) Risk factors in portfolio Fall in stock market of UK- All companies in equity portfolio belong to UK and if
FTSE fall then value of shares will also decline. Beta of shares is above 0.50 and at least
shares will decline at moderate rate of FTSE fall sharply. Decline in growth rate of USA and other developed economies- If economy of
developed nations like USA derailed from growth track then this will negatively affect
commodity market (Guan,. and Liang, 2014). Due to less demand price of base metals
will fall and loss will be observed in the portfolio. Fall in stock market of India- If Indian stock market fall then SBI blue chip fund will
give negative return. Debt funds may also give low return. Hence, it big risk for mutual
fund portfolio.
Monetary policy- If interest rate will increase every quarter then stock market will fall at
a higher rate in a year. Hence, elevation in interest rate is big risk.
⊘ This is a preview!⊘
Do you want full access?
Subscribe today to unlock all pages.
Trusted by 1+ million students worldwide
1 out of 16
Related Documents


Your All-in-One AI-Powered Toolkit for Academic Success.
+13062052269
info@desklib.com
Available 24*7 on WhatsApp / Email
![[object Object]](/_next/static/media/star-bottom.7253800d.svg)
Unlock your academic potential
Copyright © 2020–2026 A2Z Services. All Rights Reserved. Developed and managed by ZUCOL.