Comprehensive Data Analysis Report: IT in Military Services

Verified

Added on Ā 2020/05/08

|23
|2793
|133
Report
AI Summary
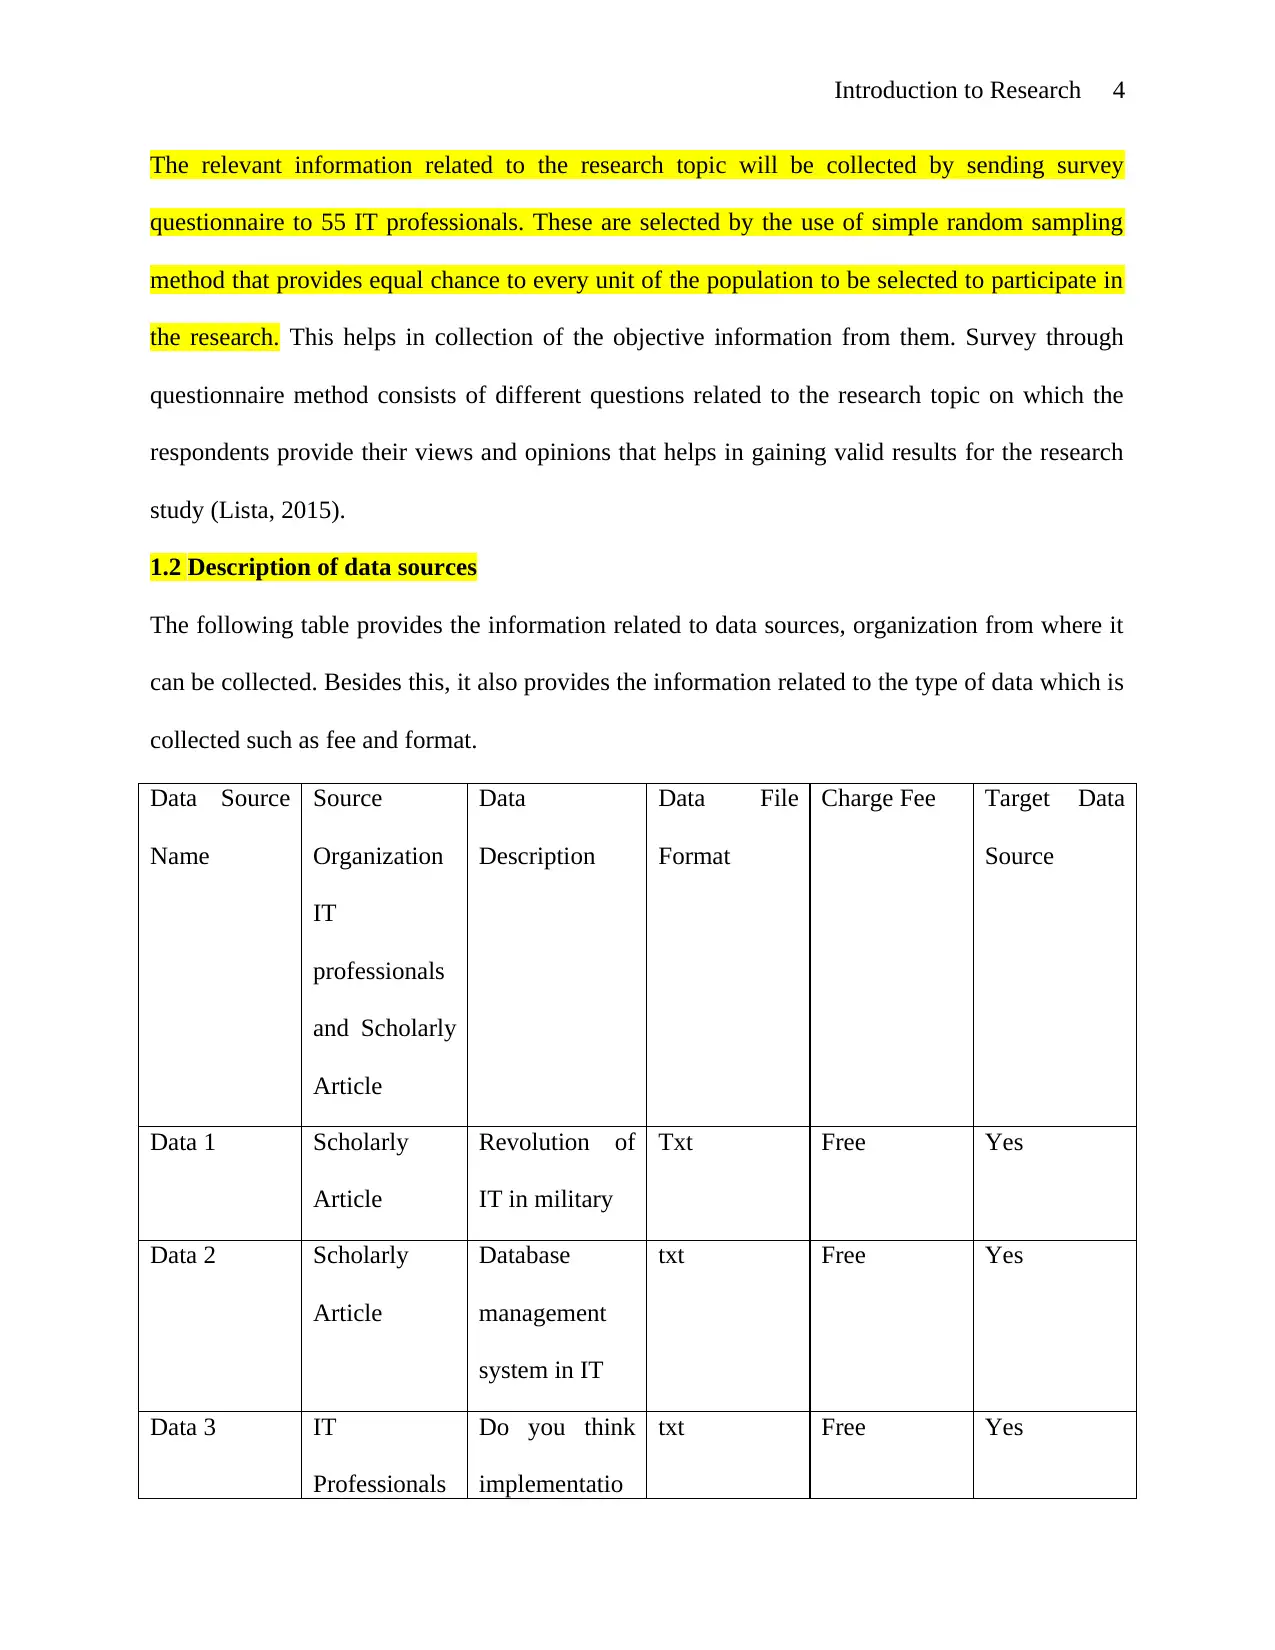
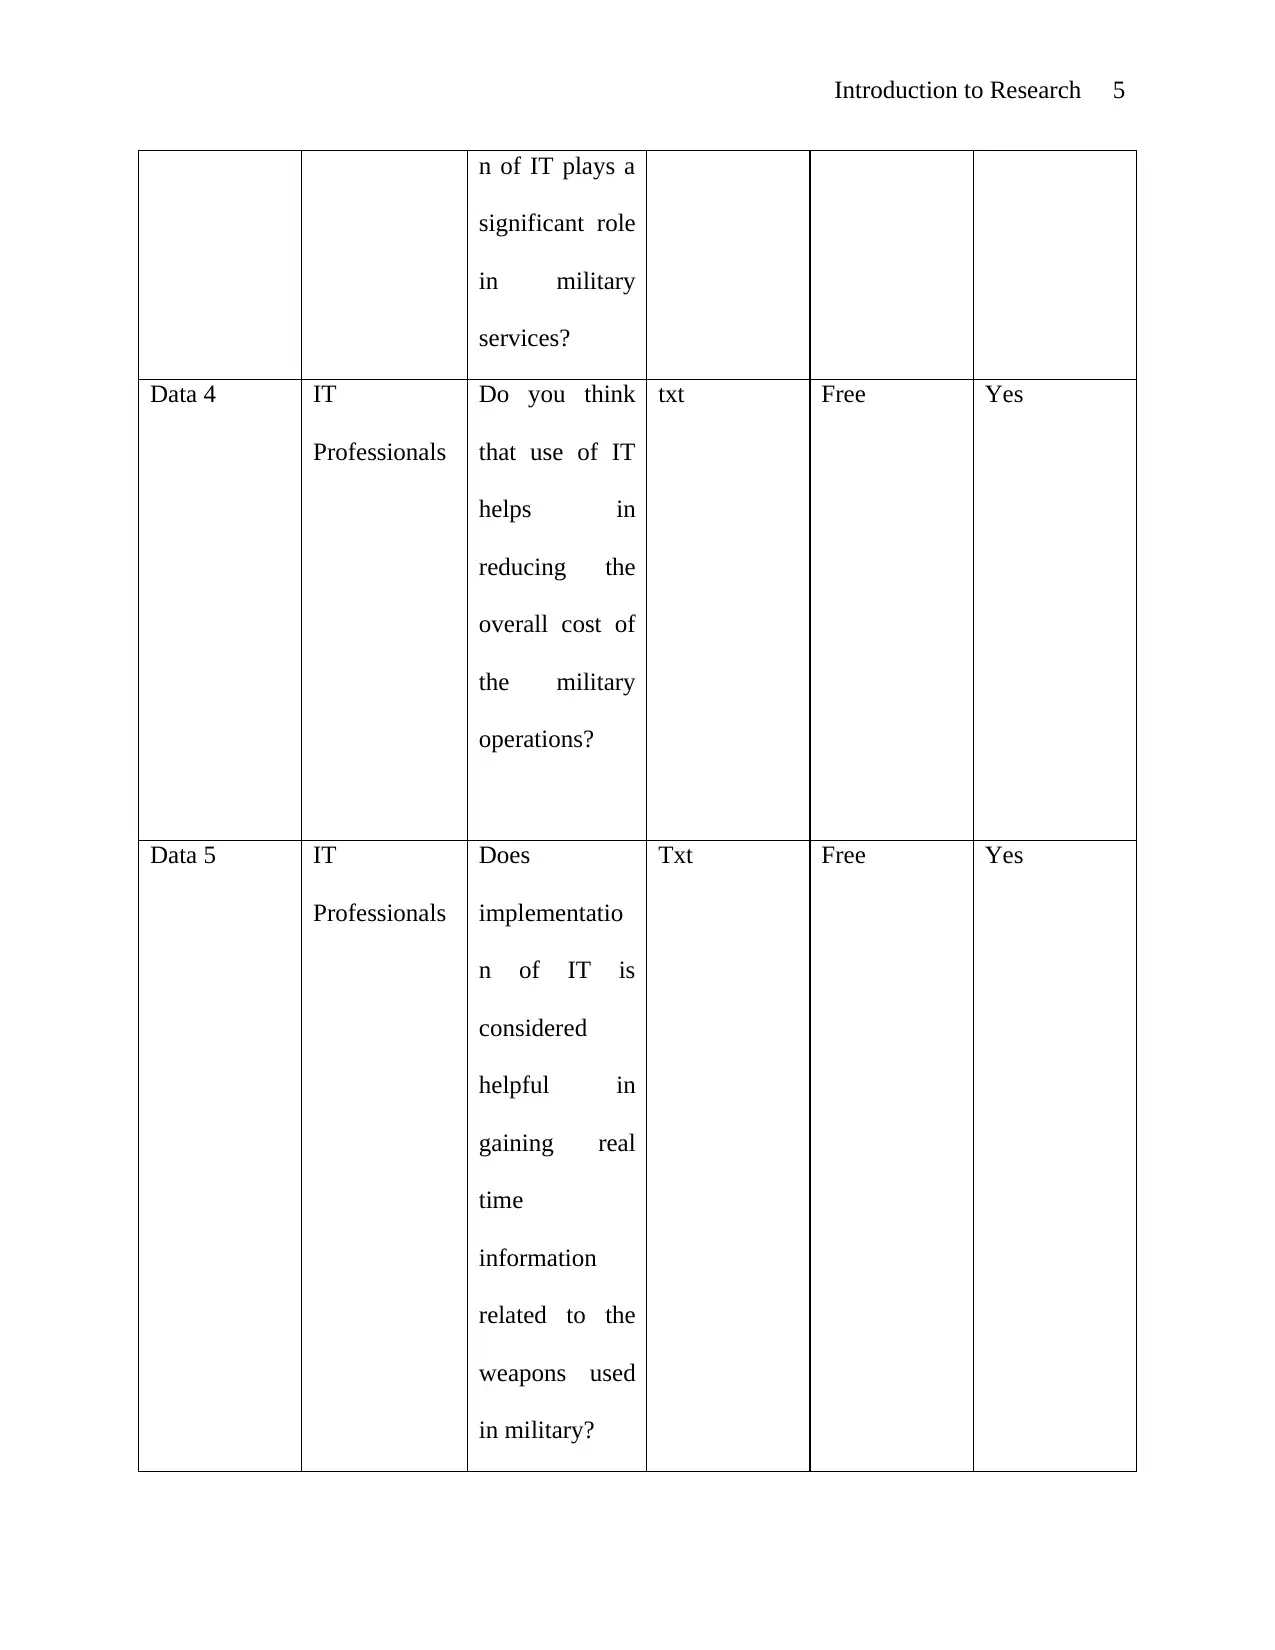
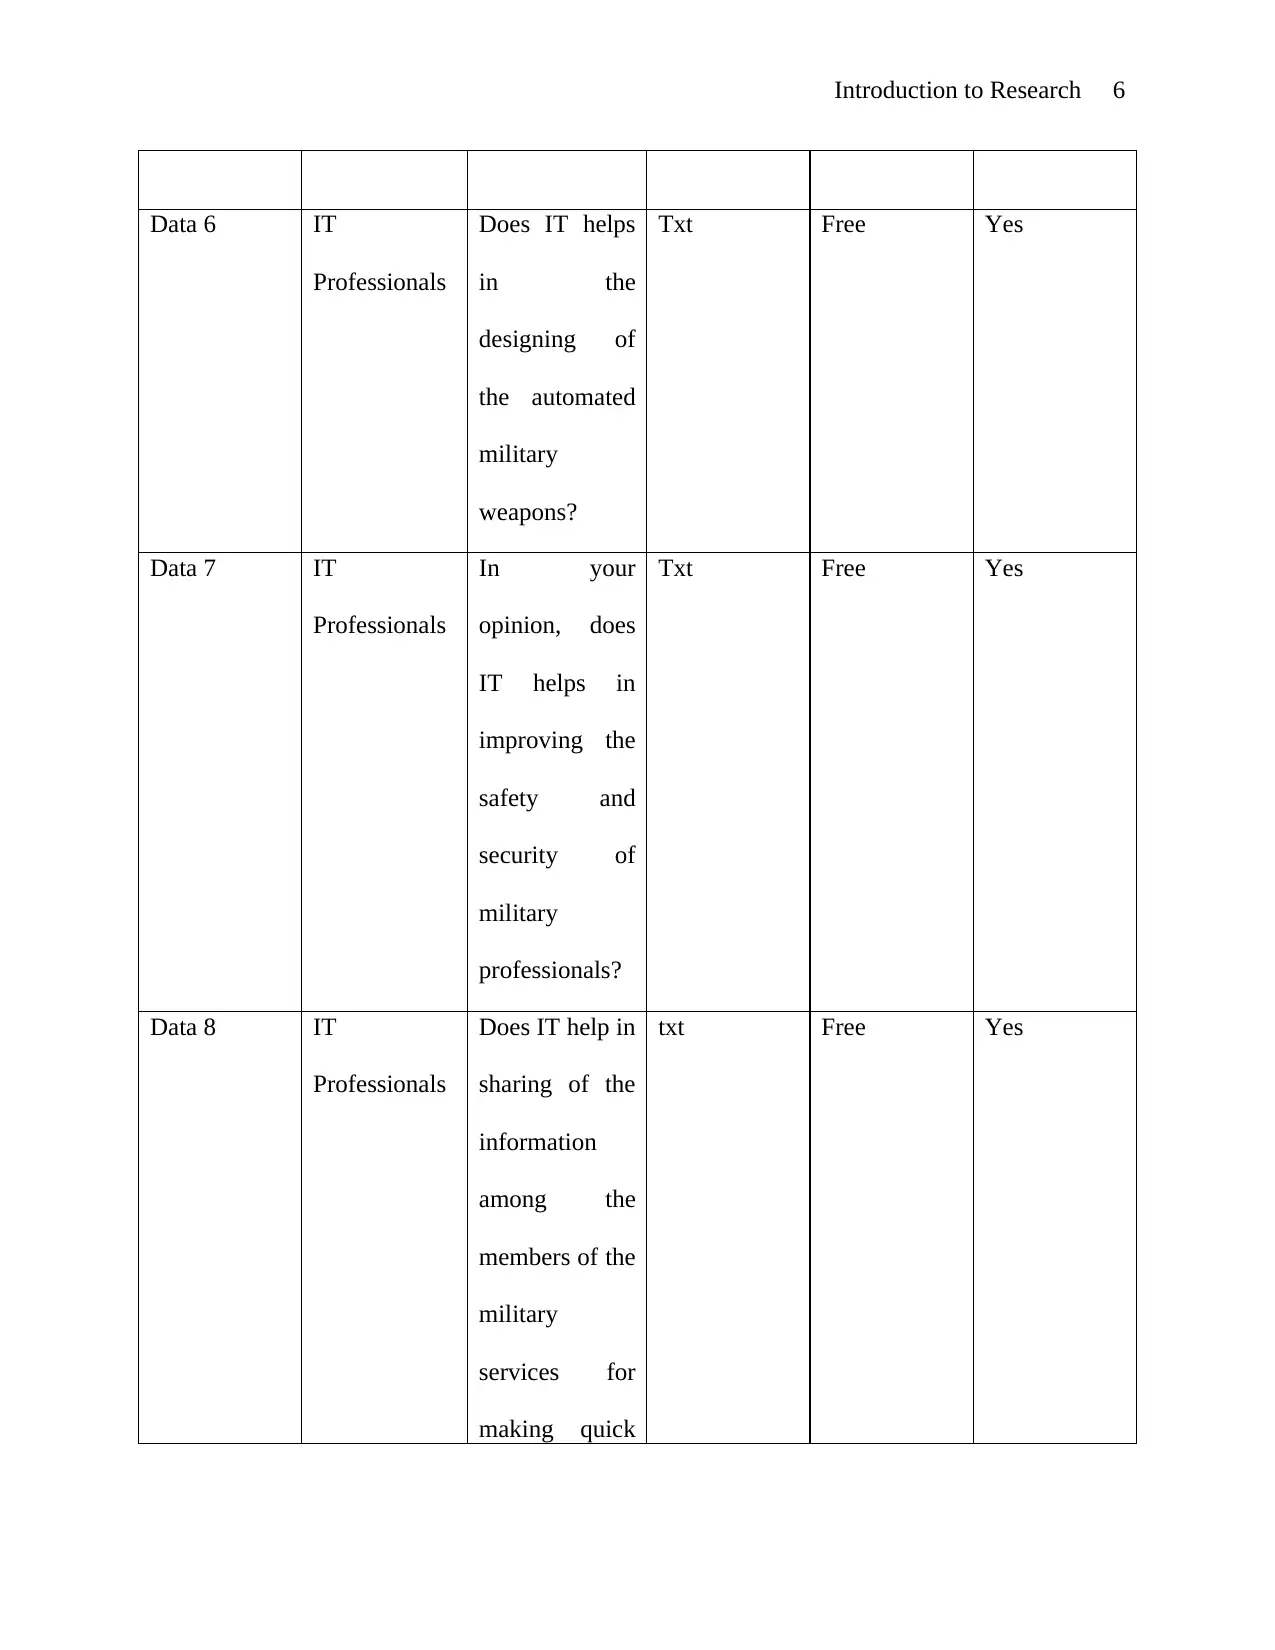
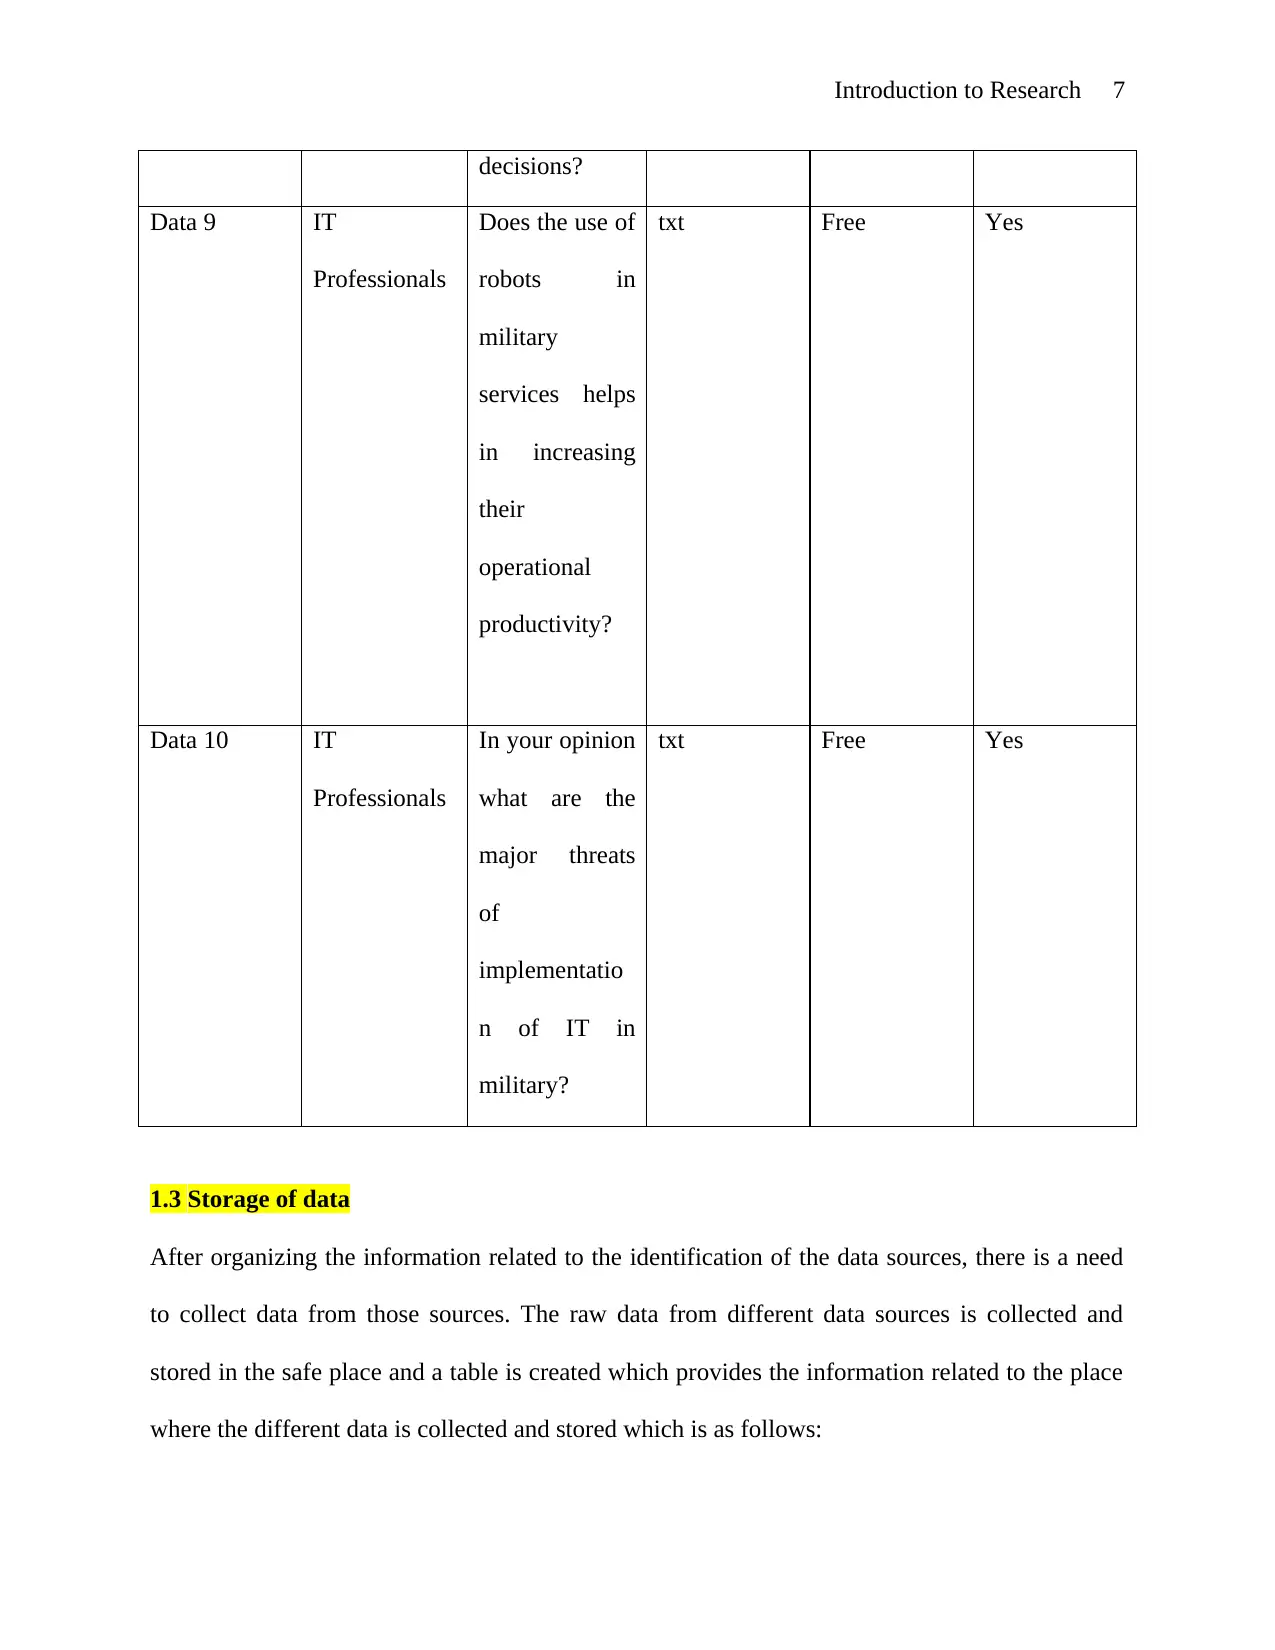
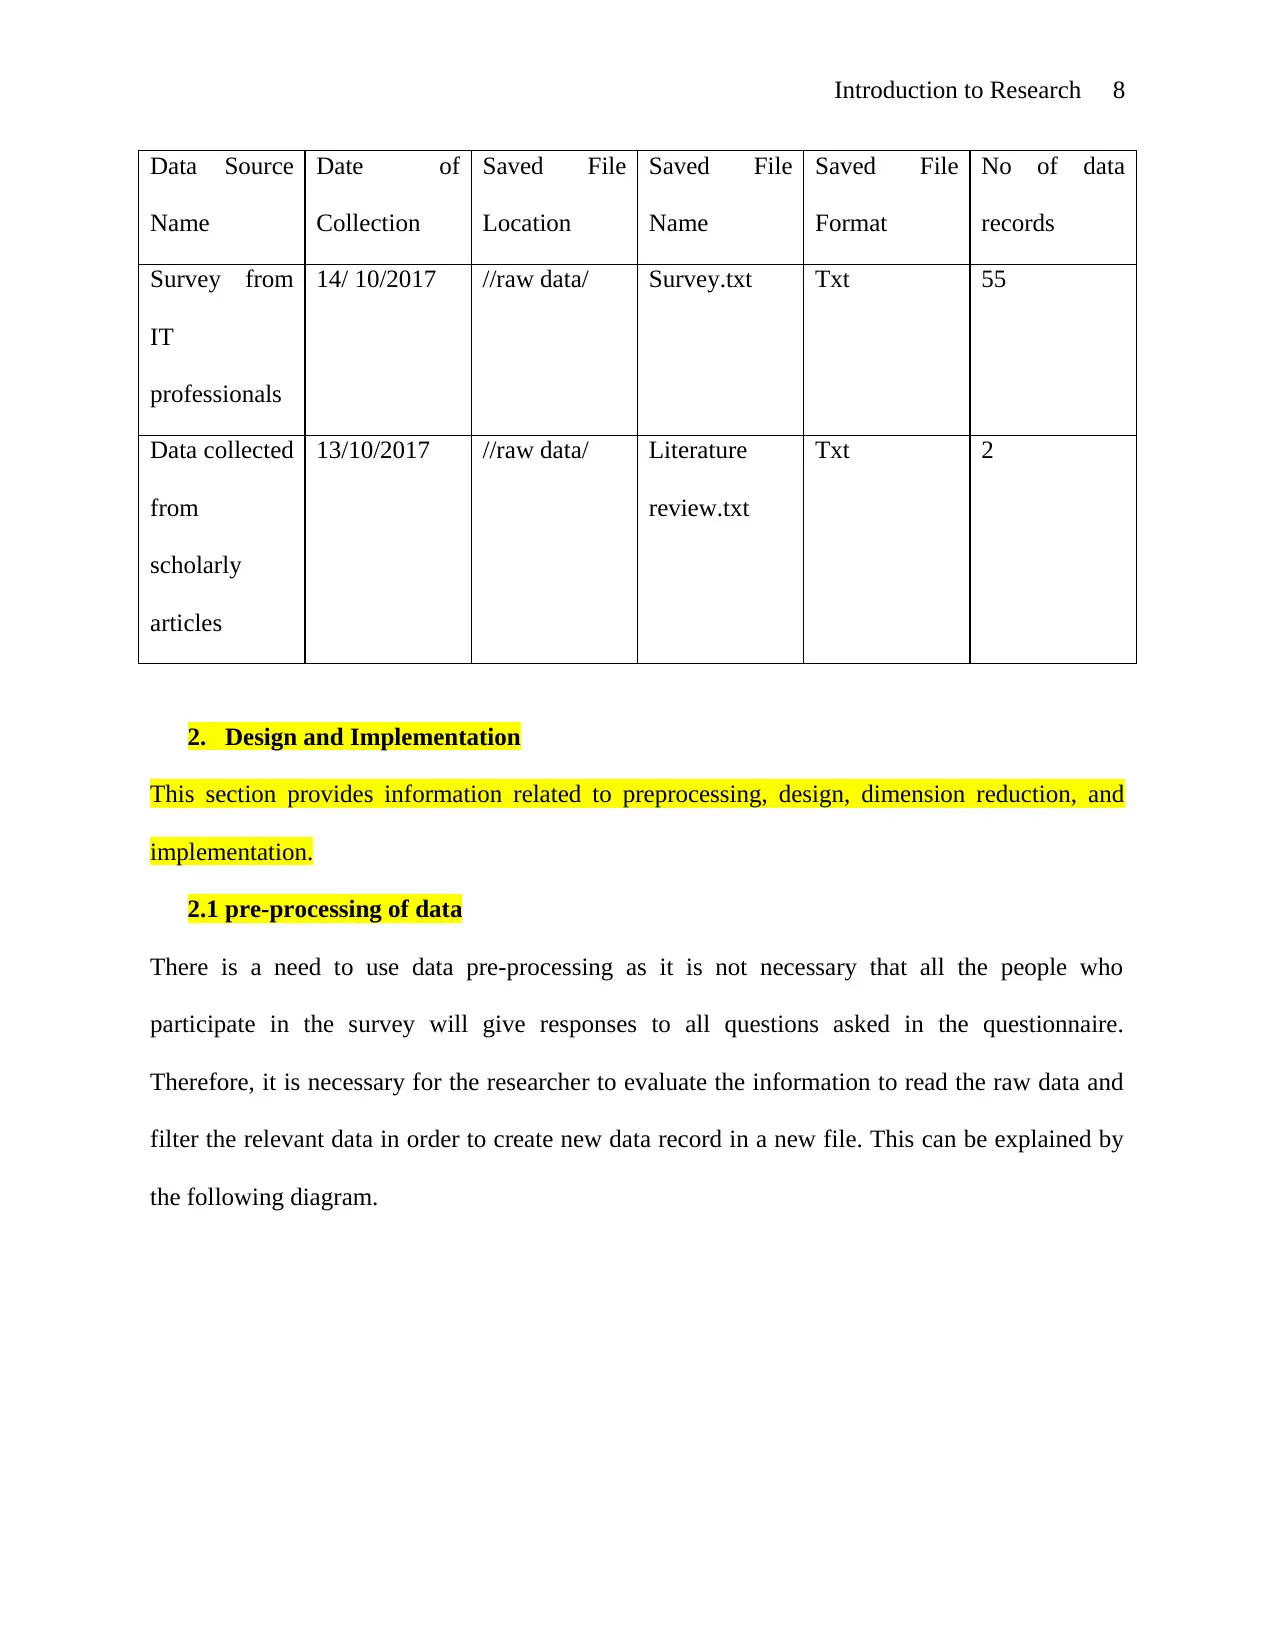
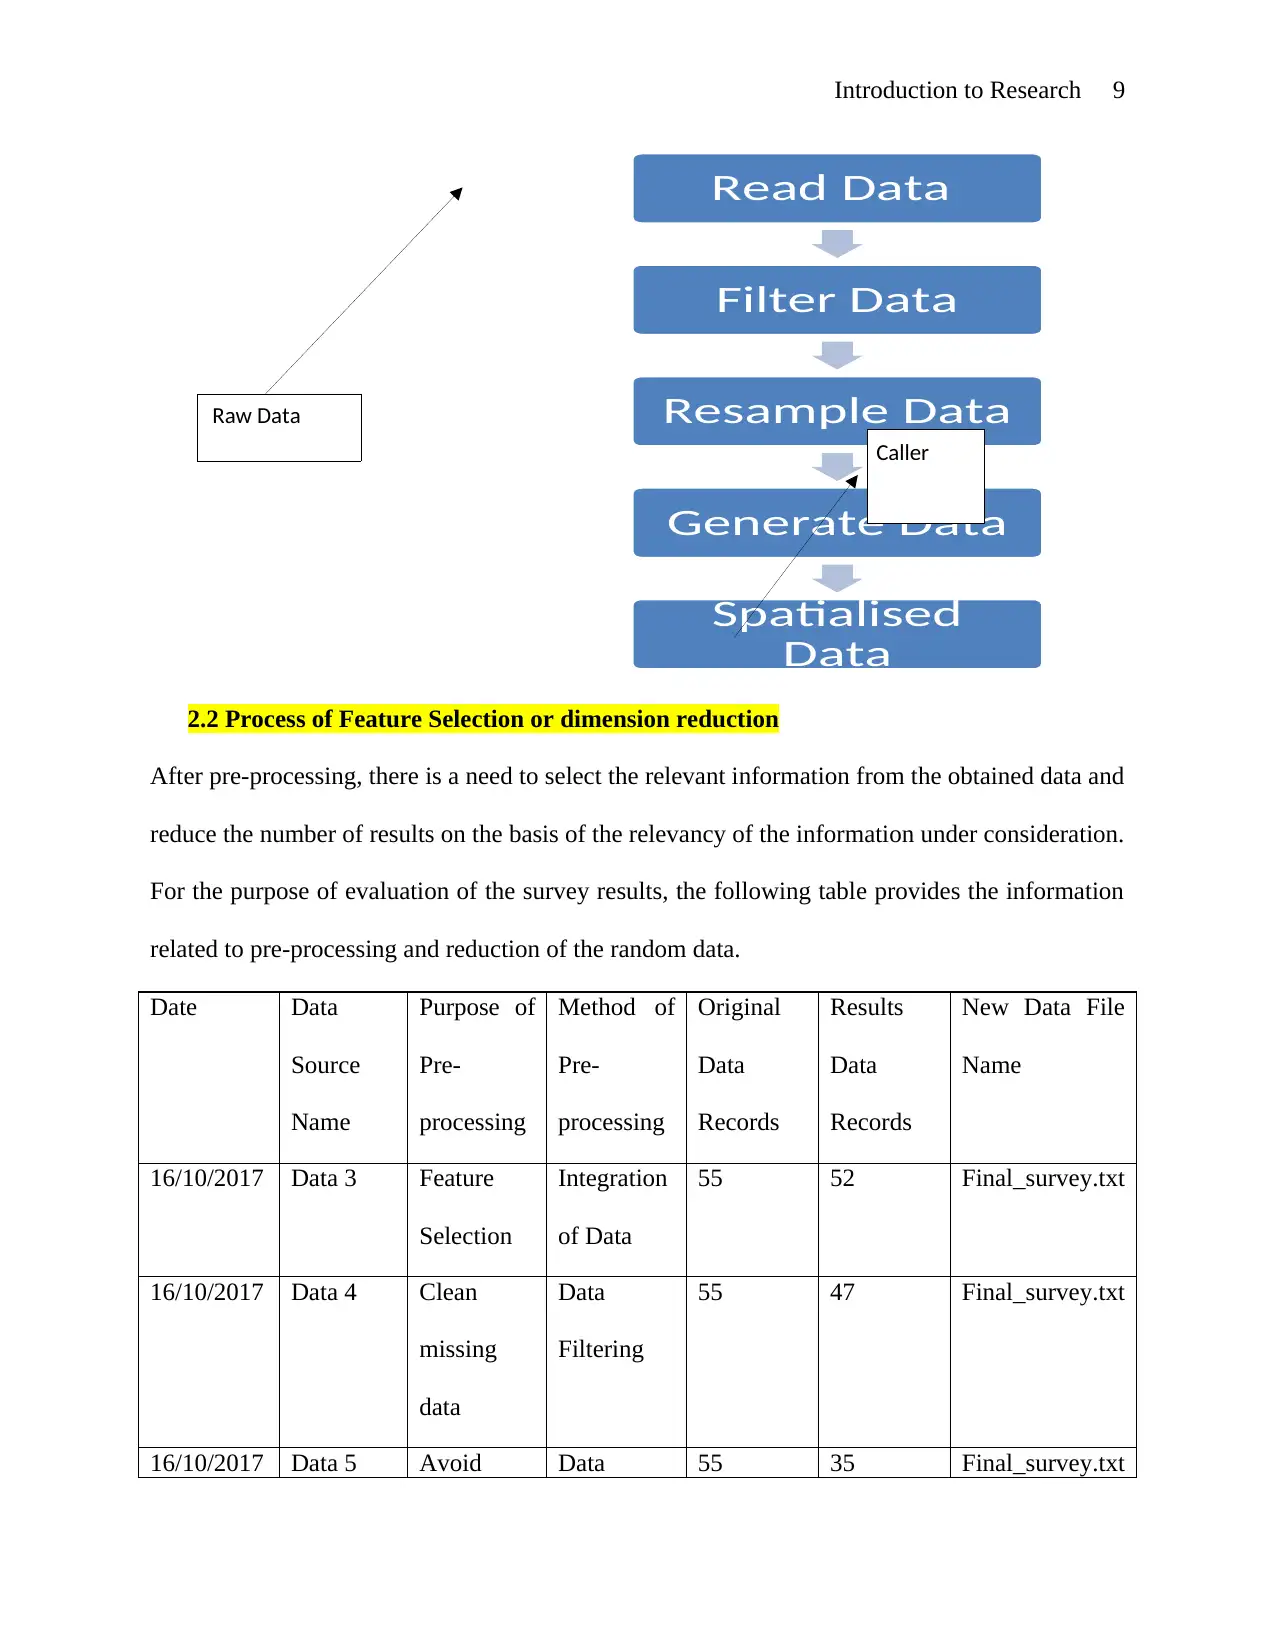
This report presents a comprehensive analysis of IT implementation in military services, encompassing data collection, processing, experiment design, and results. The research employed a mixed-method approach, utilizing both primary and secondary data sources, including survey questionnaires administered to 55 IT professionals and scholarly articles. The data underwent pre-processing, feature selection, and dimension reduction techniques. The experiment focused on assessing IT's role in military operations, cost reduction, real-time information access, automated weapon design, safety and security enhancements, information sharing for quick decisions, and the use of robots to improve operational productivity. The collected data was analyzed using MS Excel, with findings presented in graphs and charts. The results reveal strong support for IT's significant role, with the majority of respondents agreeing that IT contributes to cost reduction, enhanced real-time information, improved safety, and the design of automated weapons. The analysis offers valuable insights into the perceived benefits and potential drawbacks of IT integration within military contexts.
Document Page
Introduction to Research 1
Introduction to Research
tabler-icon-diamond-filled.svg

Paraphrase This Document

Need a fresh take? Get an instant paraphrase of this document with our AI Paraphraser
Document Page
Introduction to Research 2
Table of Contents
1. Collection of Data..............................................................................................................................3
1.1 Different sources of data...........................................................................................................3
1.2 Description of data sources.......................................................................................................4
1.3 Storage of data...........................................................................................................................7
2. Design and Implementation..............................................................................................................8
2.1 pre-processing of data...............................................................................................................8
2.2 Process of Feature Selection or dimension reduction..............................................................9
2.3 Designing of the experiment....................................................................................................10
2.3.1 Detailed procedure of design...........................................................................................10
2.3.2 Results of the experiment................................................................................................11
2.4 Implementation........................................................................................................................11
2.4.1 Software and Tools used..................................................................................................11
2.4.2 Results of the experiment..........................................................................................................11
3. Analysis of the results......................................................................................................................21
3.1 Estimations of the results........................................................................................................21
3.2 Summary of the results............................................................................................................22
4. Experiment and Results Analysis Outline.....................................................................................22
1.1Collection of Data.................................................................................................................................22
References.................................................................................................................................................24
Document Page
Introduction to Research 3
1. Collection of Data
There is a requirement to establish the procedure used to perform the experiment. It is essential
for the researcher to collect the information related to the research topic before the analysis of the
results of the experiment for the purpose of gaining valid and reliable results. It is required to
select the sources from which the data will be collected in order to gain valid and reliable results
(Silverman and Patterson, 2014). Firstly, the data sources will be identified and then, the most
appropriate source will be selected. The information will be presented in the table format.
1.1 Different sources of data
It is required for the researcher to search information regarding different problems and design
experiment before starting the experiment. There is an availability of different sources of data
collection such as secondary and primary sources of data collection. Primary sources of data
collection method help in collecting the information at first hand. There are several sources of
primary data collection methods namely survey through questionnaire, interview, observation
and focus group discussion. In addition to this, the information can also be collected by the use
of secondary sources of data collection such as books, scholarly articles, online articles and
official documents which helps in gaining valid and reliable results for the research study
(Mallinson, Childs and Herk, 2013).
There will be a use of mixed method of data collection is appropriate as it is a combination of the
resources such as primary and secondary sources of data collection for collecting the relevant
information related to the research topic. Survey through questionnaire method and information
from two relevant literary sources i.e. scholarly articles are used for the purpose of collection of
the information related to the research study (Lim and Ting, 2013).
Document Page
Introduction to Research 4
The relevant information related to the research topic will be collected by sending survey
questionnaire to 55 IT professionals. These are selected by the use of simple random sampling
method that provides equal chance to every unit of the population to be selected to participate in
the research. This helps in collection of the objective information from them. Survey through
questionnaire method consists of different questions related to the research topic on which the
respondents provide their views and opinions that helps in gaining valid results for the research
study (Lista, 2015).
1.2 Description of data sources
The following table provides the information related to data sources, organization from where it
can be collected. Besides this, it also provides the information related to the type of data which is
collected such as fee and format.
Data Source
Name
Source
Organization
IT
professionals
and Scholarly
Article
Data
Description
Data File
Format
Charge Fee Target Data
Source
Data 1 Scholarly
Article
Revolution of
IT in military
Txt Free Yes
Data 2 Scholarly
Article
Database
management
system in IT
txt Free Yes
Data 3 IT
Professionals
Do you think
implementatio
txt Free Yes
tabler-icon-diamond-filled.svg

Paraphrase This Document

Need a fresh take? Get an instant paraphrase of this document with our AI Paraphraser
Document Page
Introduction to Research 5
n of IT plays a
significant role
in military
services?
Data 4 IT
Professionals
Do you think
that use of IT
helps in
reducing the
overall cost of
the military
operations?
txt Free Yes
Data 5 IT
Professionals
Does
implementatio
n of IT is
considered
helpful in
gaining real
time
information
related to the
weapons used
in military?
Txt Free Yes
Document Page
Introduction to Research 6
Data 6 IT
Professionals
Does IT helps
in the
designing of
the automated
military
weapons?
Txt Free Yes
Data 7 IT
Professionals
In your
opinion, does
IT helps in
improving the
safety and
security of
military
professionals?
Txt Free Yes
Data 8 IT
Professionals
Does IT help in
sharing of the
information
among the
members of the
military
services for
making quick
txt Free Yes
Document Page
Introduction to Research 7
decisions?
Data 9 IT
Professionals
Does the use of
robots in
military
services helps
in increasing
their
operational
productivity?
txt Free Yes
Data 10 IT
Professionals
In your opinion
what are the
major threats
of
implementatio
n of IT in
military?
txt Free Yes
1.3 Storage of data
After organizing the information related to the identification of the data sources, there is a need
to collect data from those sources. The raw data from different data sources is collected and
stored in the safe place and a table is created which provides the information related to the place
where the different data is collected and stored which is as follows:
tabler-icon-diamond-filled.svg

Paraphrase This Document

Need a fresh take? Get an instant paraphrase of this document with our AI Paraphraser
Document Page
Introduction to Research 8
Data Source
Name
Date of
Collection
Saved File
Location
Saved File
Name
Saved File
Format
No of data
records
Survey from
IT
professionals
14/ 10/2017 //raw data/ Survey.txt Txt 55
Data collected
from
scholarly
articles
13/10/2017 //raw data/ Literature
review.txt
Txt 2
2. Design and Implementation
This section provides information related to preprocessing, design, dimension reduction, and
implementation.
2.1 pre-processing of data
There is a need to use data pre-processing as it is not necessary that all the people who
participate in the survey will give responses to all questions asked in the questionnaire.
Therefore, it is necessary for the researcher to evaluate the information to read the raw data and
filter the relevant data in order to create new data record in a new file. This can be explained by
the following diagram.
Document Page
Introduction to Research 9
2.2 Process of Feature Selection or dimension reduction
After pre-processing, there is a need to select the relevant information from the obtained data and
reduce the number of results on the basis of the relevancy of the information under consideration.
For the purpose of evaluation of the survey results, the following table provides the information
related to pre-processing and reduction of the random data.
Date Data
Source
Name
Purpose of
Pre-
processing
Method of
Pre-
processing
Original
Data
Records
Results
Data
Records
New Data File
Name
16/10/2017 Data 3 Feature
Selection
Integration
of Data
55 52 Final_survey.txt
16/10/2017 Data 4 Clean
missing
data
Data
Filtering
55 47 Final_survey.txt
16/10/2017 Data 5 Avoid Data 55 35 Final_survey.txt
Read Data
Filter Data
Resample Data
Generate Data
Spatialised
Data
Raw Data
Caller
Document Page
Introduction to Research 10
duplicity reduction
16/10/2017 Data 6 Filter the
data
Data
reduction
55 37 Final_survey.txt
16/10/2017 Data 7 Cleaning
the missing
data
Data
filtering
55 42 Final_survey.txt
16/10/2017 Data 8 Filter the
data
Data
reduction
55 39 Final_survey.txt
16/10/2017 Data 9 Feature
Selection
Data
reduction
55 44 Final_survey.txt
16/10/2017 Data 10 Cleaning
of missing
data
Data
filtering
55 32 Final_survey.txt
2.3 Designing of the experiment
2.3.1 Detailed procedure of design
For the purpose of carrying out the research, there is a use of mixed method of data collection in
which firstly the information is collected from the available published sources which helps in
gaining accurate information related to the research topic. For this purpose, the general
information related to experience, age and gender is collected in order to get the idea related to
the opinion of the respondents regarding the research topic (Miles, Huberman and SaldaƱa,
2013).
2.3.2 Results of the experiment
tabler-icon-diamond-filled.svg

Paraphrase This Document

Need a fresh take? Get an instant paraphrase of this document with our AI Paraphraser
Document Page
Introduction to Research 11
2.4 Implementation
2.4.1 Software and Tools used
The information collected by the use of survey through questionnaire method is analyzed by the
use of MS Excel, which has helped in presenting the quantitative information in the form of
graphs and charts. This has helped the users of the information to take effective and quick
decisions (Fox, Gouthro, Morakabati and Brackstone, 2014).
2.4.2 Results of the experiment
Gender
Gender
No of
Respondents
Male 37
Female 18
Methodology Collect Data
Analyse and
evaluate
data
Document Page
Introduction to Research 12
Male
67%
Female
33%
Gender
It is indicated from the above graph that 33% of the respondents are female and 67% are males.
Age
Age
No. of
Respondents
18-25 23
26-35 15
36-45 8
over 45 9
18-25 26-35 36-45 over 45
23
15
8 9
Age
No. of Respondents
chevron_up_icon
1 out of 23
circle_padding
hide_on_mobile
zoom_out_icon
[object Object]