Comprehensive Examination of Stock Return Data and Analysis

Verified

Added on  2023/06/07

|9
|725
|324
Homework Assignment
AI Summary
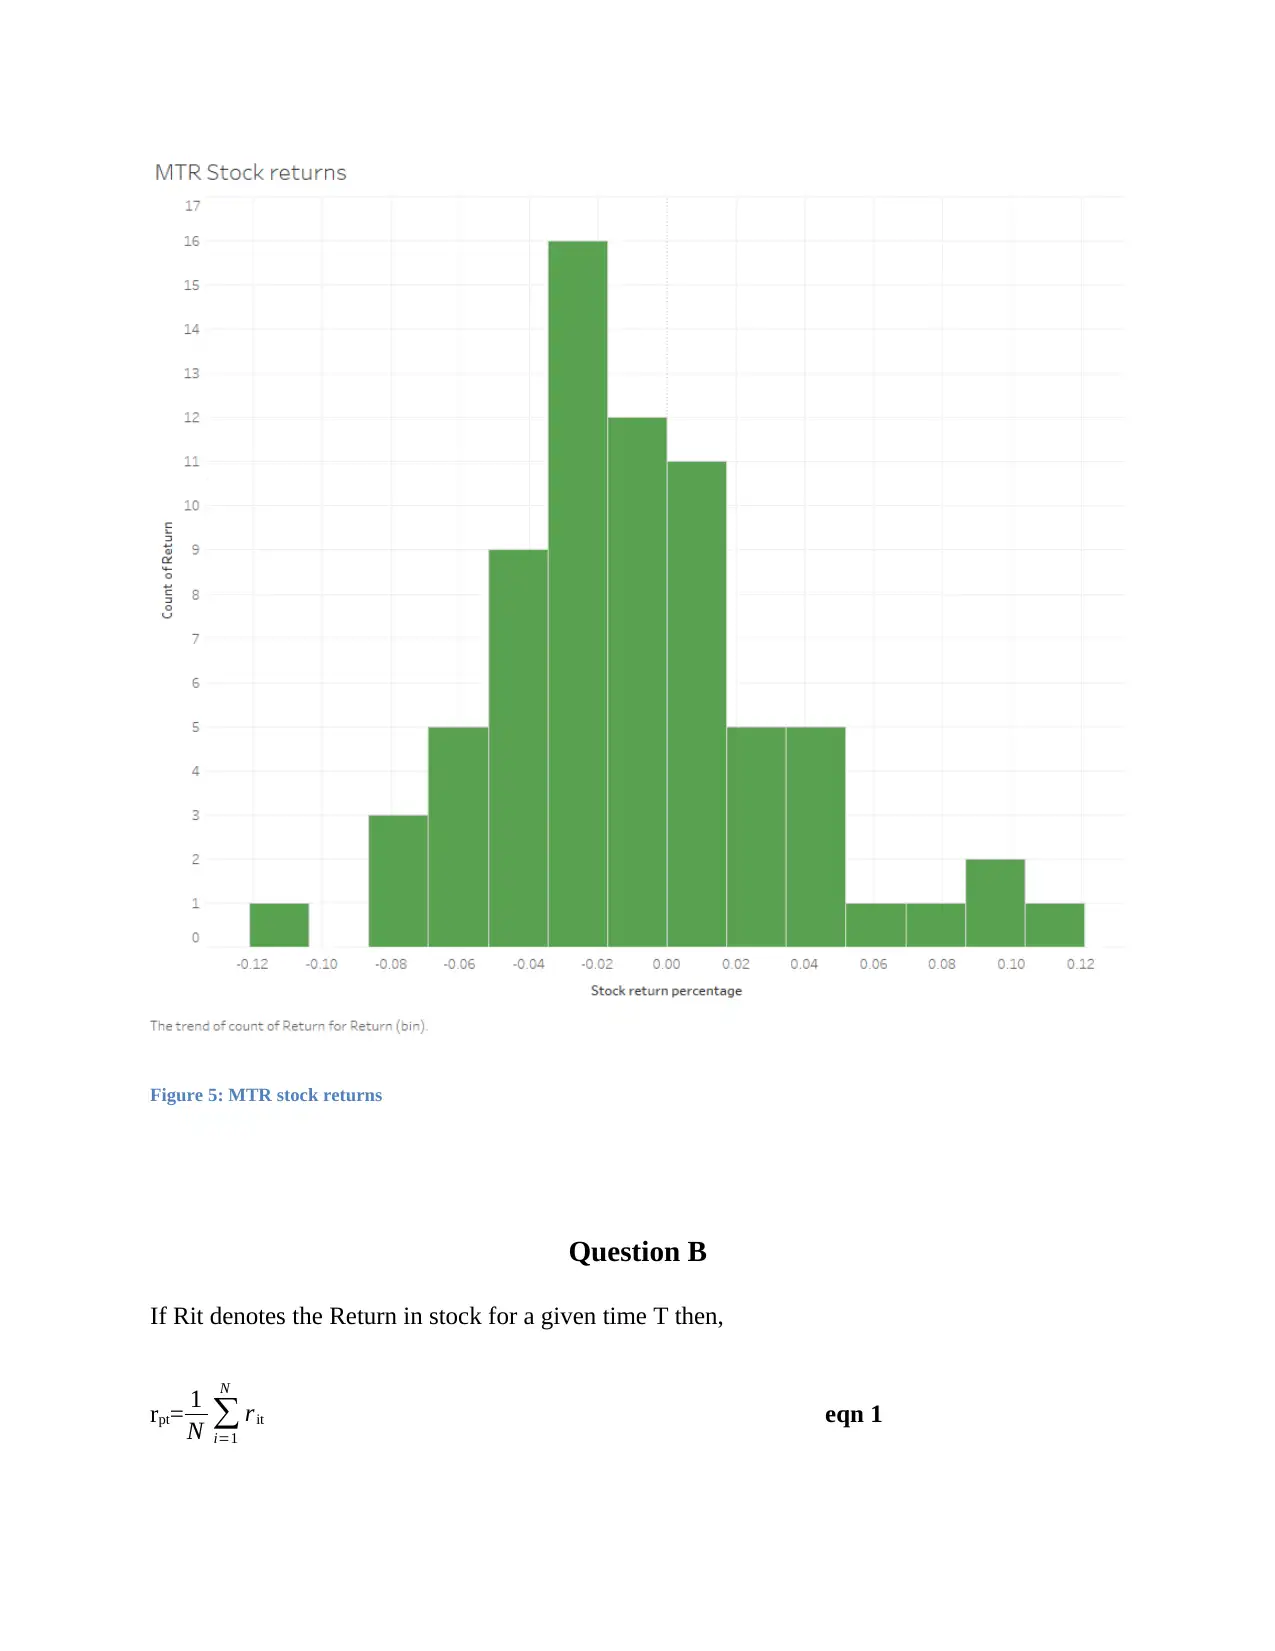
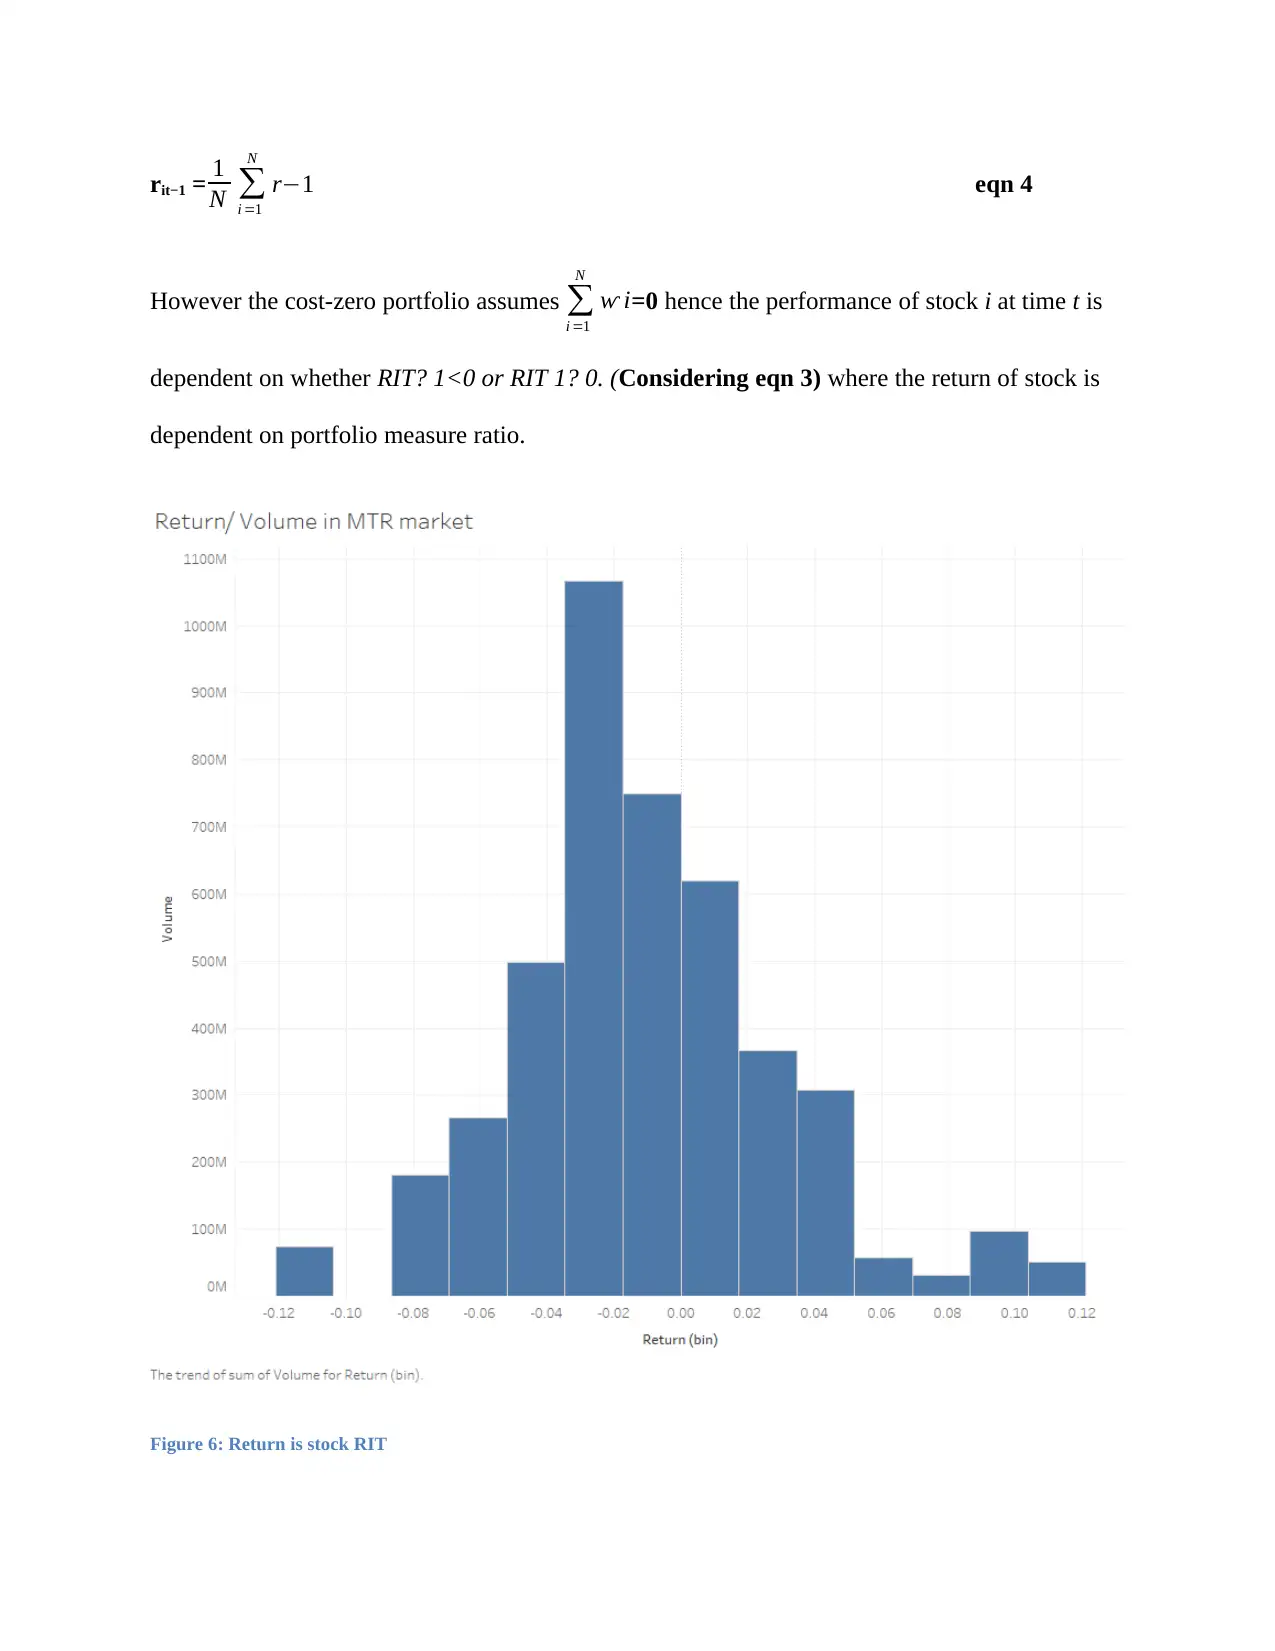
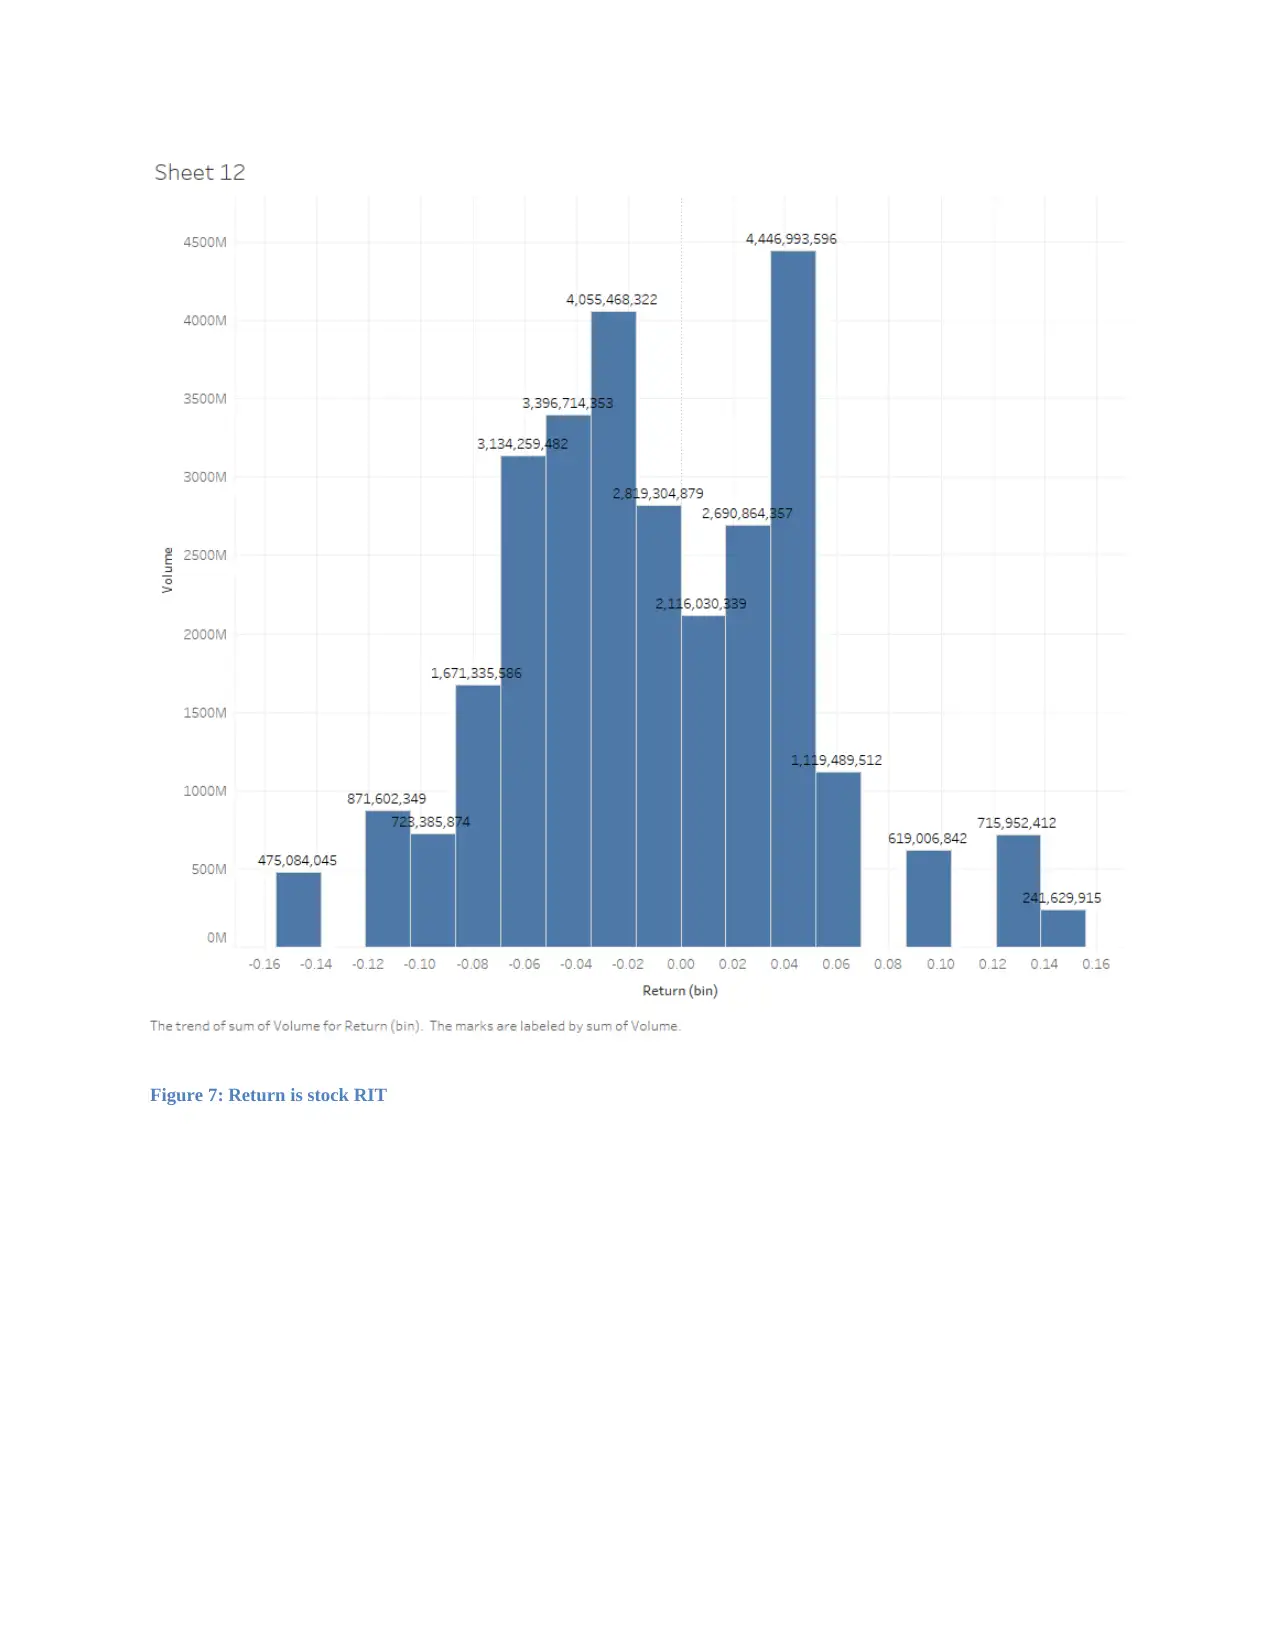
This assignment analyzes stock return data from various companies, including HSI, AIA, Tencent, HSBC, and MTR. It presents a breakdown of stock returns, identifying the highest, lowest, and most frequently recorded returns for each company using figures and charts. The analysis extends to the calculation of portfolio returns using the provided equations (1 and 2) and explores the concept of zero-momentum strategy. The document also delves into how stock performance is determined relative to average performance, considering market volume and the relationship between stock returns and portfolio measure ratios. The assignment references Havon (2016) and Meryvyn et al. (2012) to support its arguments and calculations, providing a comprehensive overview of stock return analysis and financial modeling.
Document Page
Question A
From figure 1 below, the highest stock recorded by HSI is 0.16% which is recorded twice while
the lowest is -0.16 which is recorded once. The most recorded stock return is 0.00% recorded 13
times. The second most recorded stock return is -0.04% having a record of 12 times.
Figure 1: HSI Stock returns
tabler-icon-diamond-filled.svg

Paraphrase This Document

Need a fresh take? Get an instant paraphrase of this document with our AI Paraphraser
Document Page
In figure 2 below, the most recorded stock return is -0.02% a record made 12 times while the
highest stock return for AIA is 0.18% and the lowest is -0.14%
Figure 2: AIA stock returns Area map
From figure 3, Tencent holdings had most stock returns i.e. 12 records of -0.09% while the
highest was 0.14% with the lowest being -0.16%.
Document Page
Figure 3: Tencent holdings stock return line graph
HSBC recorded a high stock return of 0.14% made once and a low of -0.16% which was
recorded twice while the most recorded stock returns is 0.03% which was made 12 times.
Document Page
Figure 4: HSBC stock returns
From figure 5, the most recorded stock returns by MTR is -0.03% made 16 times while the
highest and least stock returns by the same company is 0.12% and -0.12% respectively.
tabler-icon-diamond-filled.svg

Paraphrase This Document

Need a fresh take? Get an instant paraphrase of this document with our AI Paraphraser
Document Page
Figure 5: MTR stock returns
Question B
If Rit denotes the Return in stock for a given time T then,
rpt= 1
N
i=1
N
rit eqn 1
Document Page
Given a periodical re-balancing of the portfolio so as to keep hold of equal weights, a periodical
return regarding zero-momentum strategy is obtained through:
Rtot,m= 1
MN
m =1
M
(¿
i=1
N
rim)w¿ ¿ and
j=1
N
w=0 eqn 2
Such that:
rit= Periodical return for each constituent
rtot,m = Periodical return for the strategy
M = Amount of portfolios held, i.e. m (1,. . . ,M) and N = stock amount in each portfolio, i.e. i
(1,. . . ,N) while L is the Subscripts of the winner and loser portfolio, additionally all Positive
returns are per dollar amount that is invested. According to Havon (2016), “the performance of
stock is determined relative to average performance.
Considering figures 6 and 7 below, assuming the volume in the market to be how well the market
is stocked, and letting RIT, the performance of the stock at time t is seen to be dependent on how
well the stock return is less than zero (Meryvyn et al, 2012), however, there are times when the
stock performs well even with low return (more volume in the market) more than when there are
high stock returns in such periods where the long position is assumed given high returns while
the short position is assumed when the returns are low i.e.
Assuming Z to be length of time between t and t-1, such that it (Z) is the proportion of measure
portfolio given stock j at time t depending on stock performance between time t-1 to t
it = 1
N (rit−1 rit−1) eqn 3
Document Page
rit−1 = 1
N
i =1
N
r1 eqn 4
However the cost-zero portfolio assumes
i =1
N
i=0 hence the performance of stock i at time t is
dependent on whether RIT? 1<0 or RIT 1? 0. (Considering eqn 3) where the return of stock is
dependent on portfolio measure ratio.
Figure 6: Return is stock RIT
tabler-icon-diamond-filled.svg

Paraphrase This Document

Need a fresh take? Get an instant paraphrase of this document with our AI Paraphraser
Document Page
Figure 7: Return is stock RIT
Document Page
Reference
Meryvn, K., Sentana, E. & Wadhawani, S. (2012). Volatility and Links between National stock
makets. Econometrica, 62(4), pp 901-933. DOI: 10.2307/2951737
Hakon, S.R. (2016). On Algorithmic Portfolio Optimization for a Momentum Investor: a
Stochastic programming approach with Moment-Matching Scenario Generation.
Industrial Economics and Technology Management, 14(6), pp 21-39
chevron_up_icon
1 out of 9
circle_padding
hide_on_mobile
zoom_out_icon
[object Object]