CP30683E: Statistical Analysis and Memory Utilisation in Computing

Verified

Added on  2023/06/12

|7
|1013
|331
Homework Assignment
AI Summary
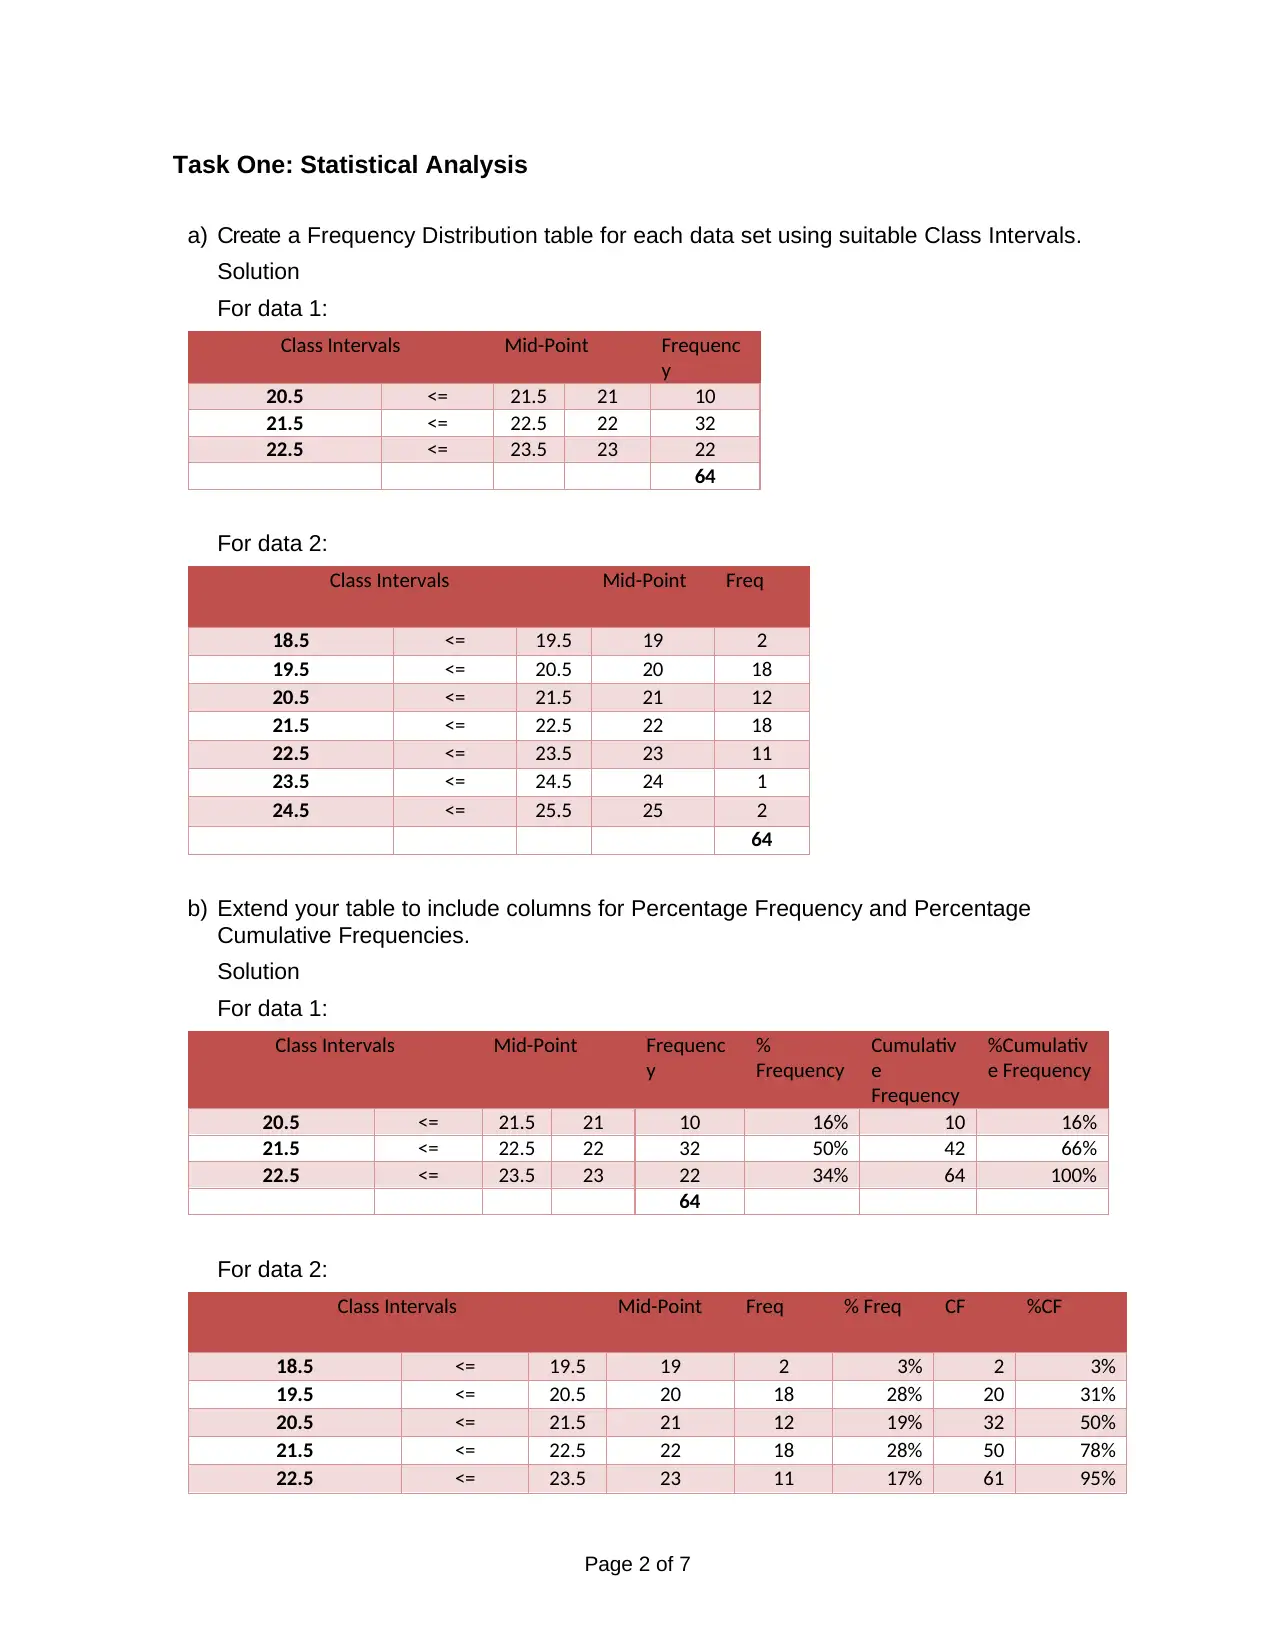
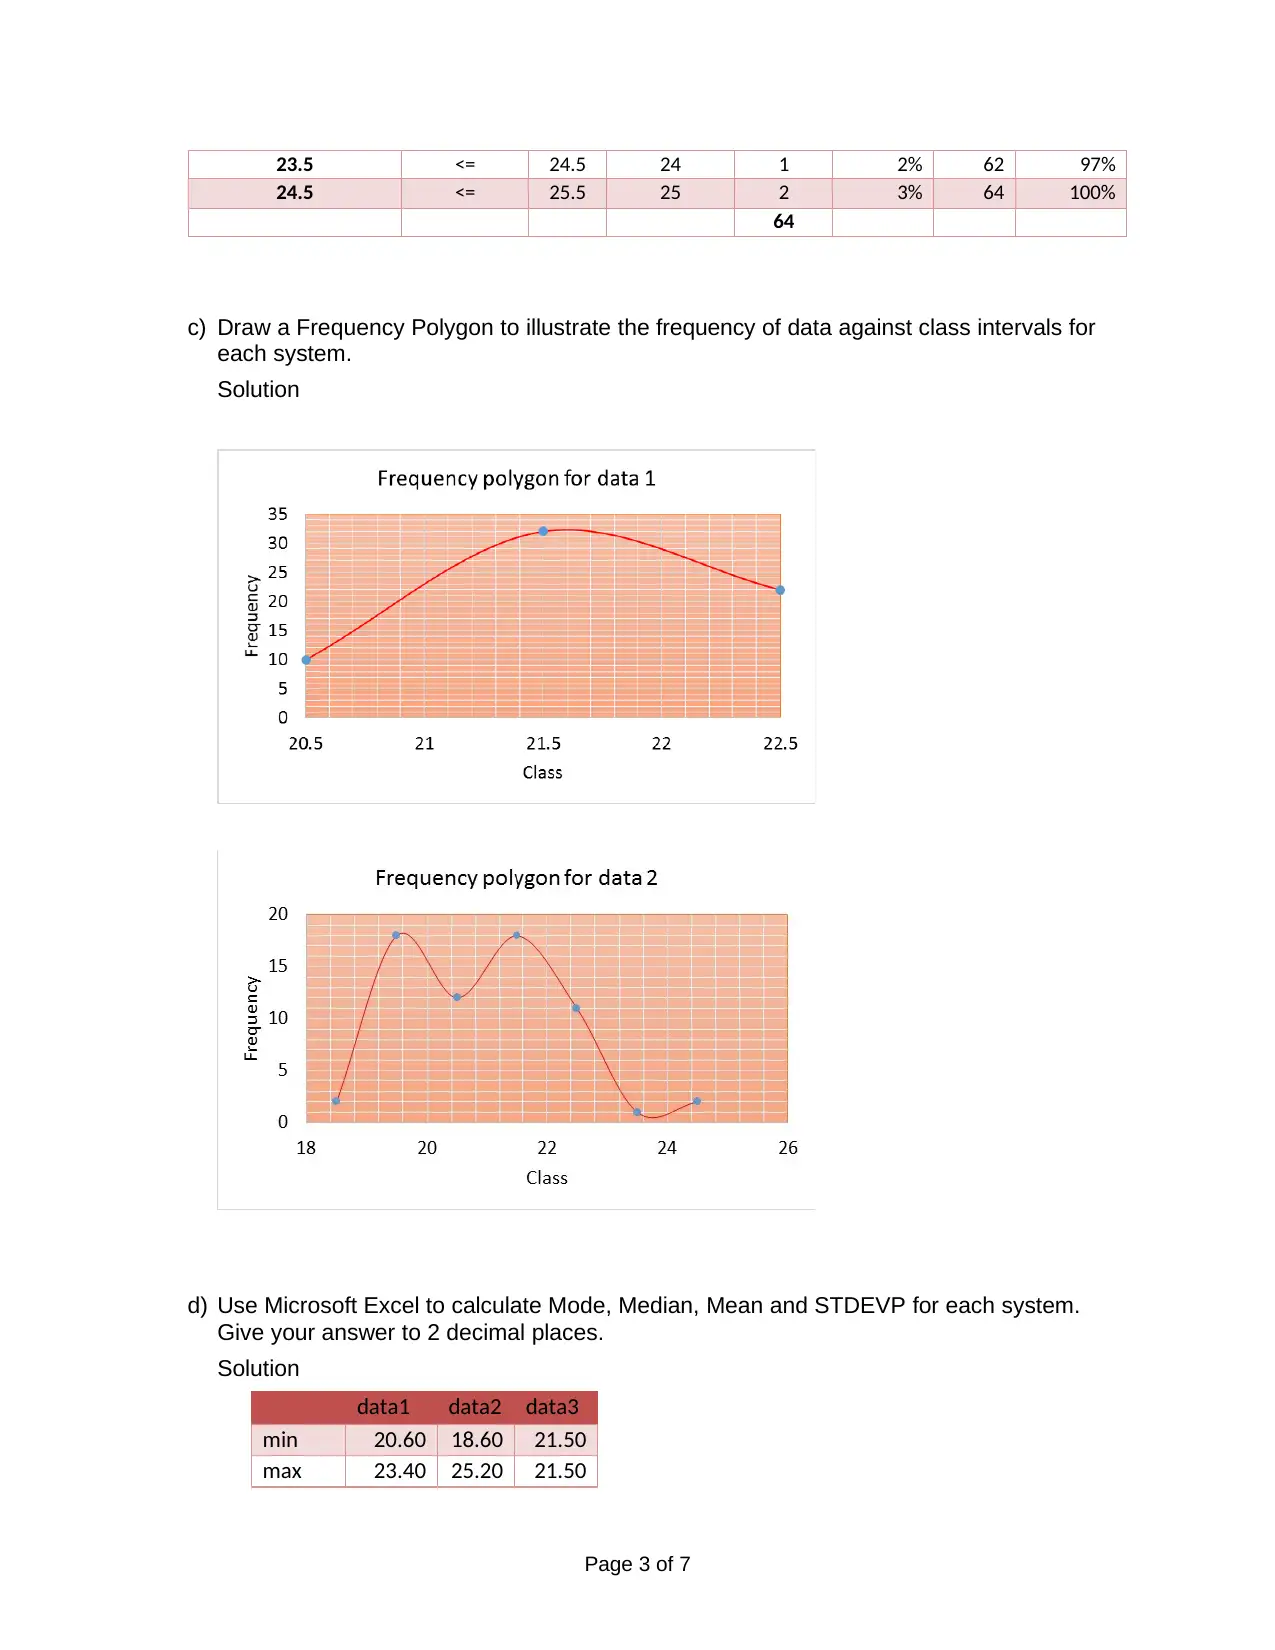
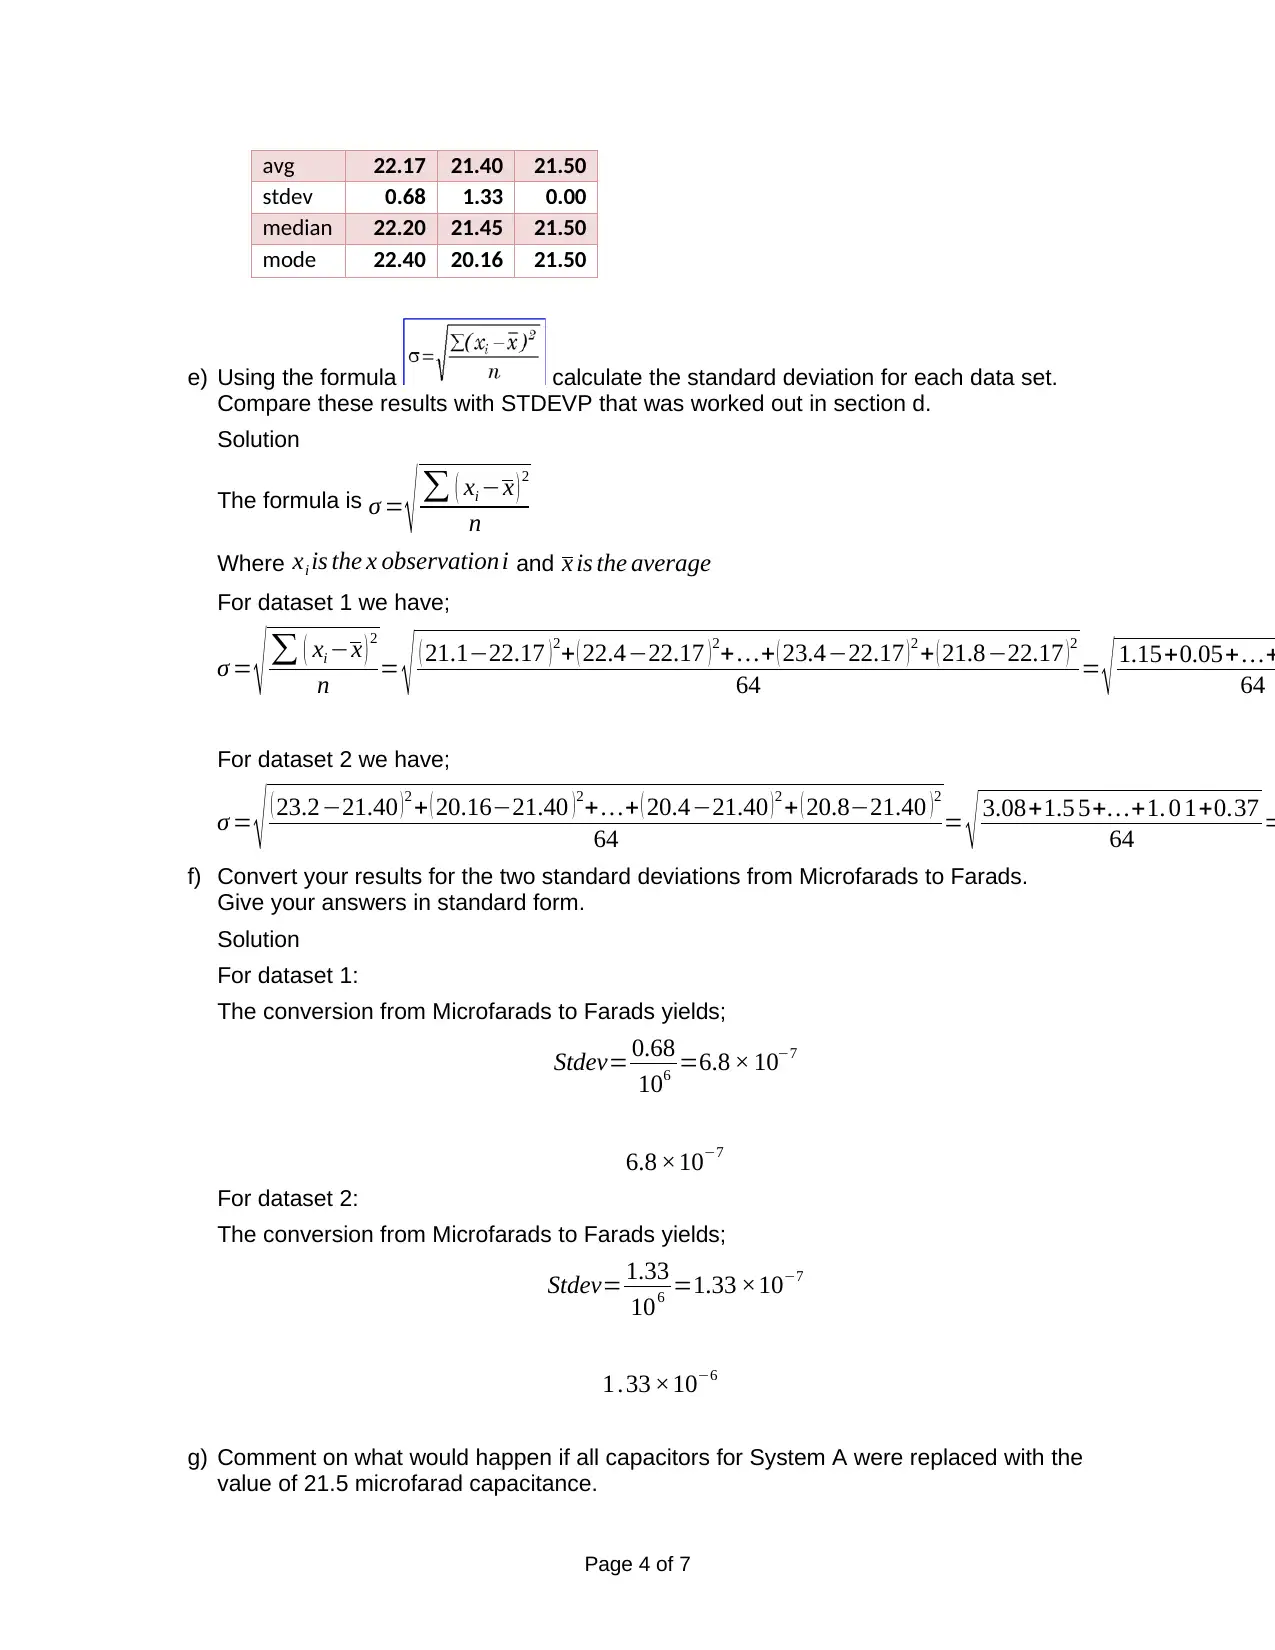
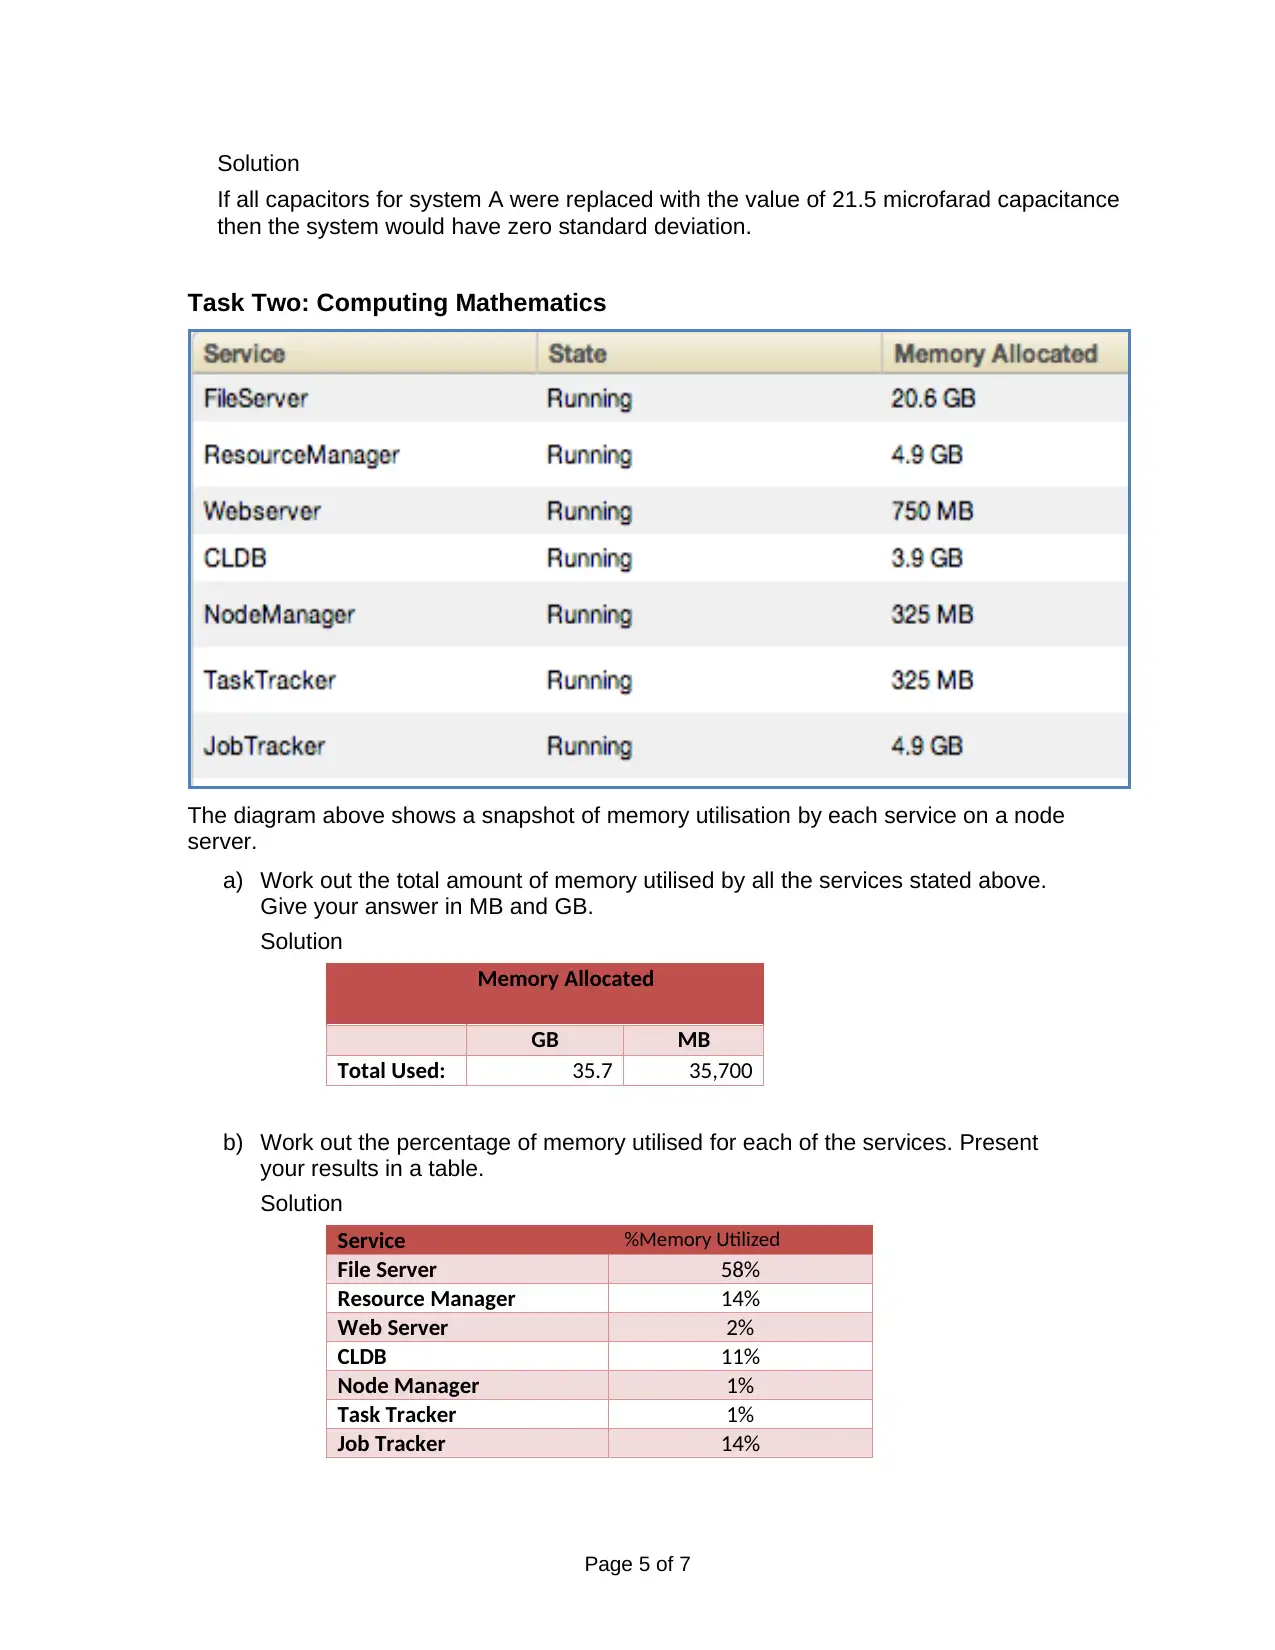
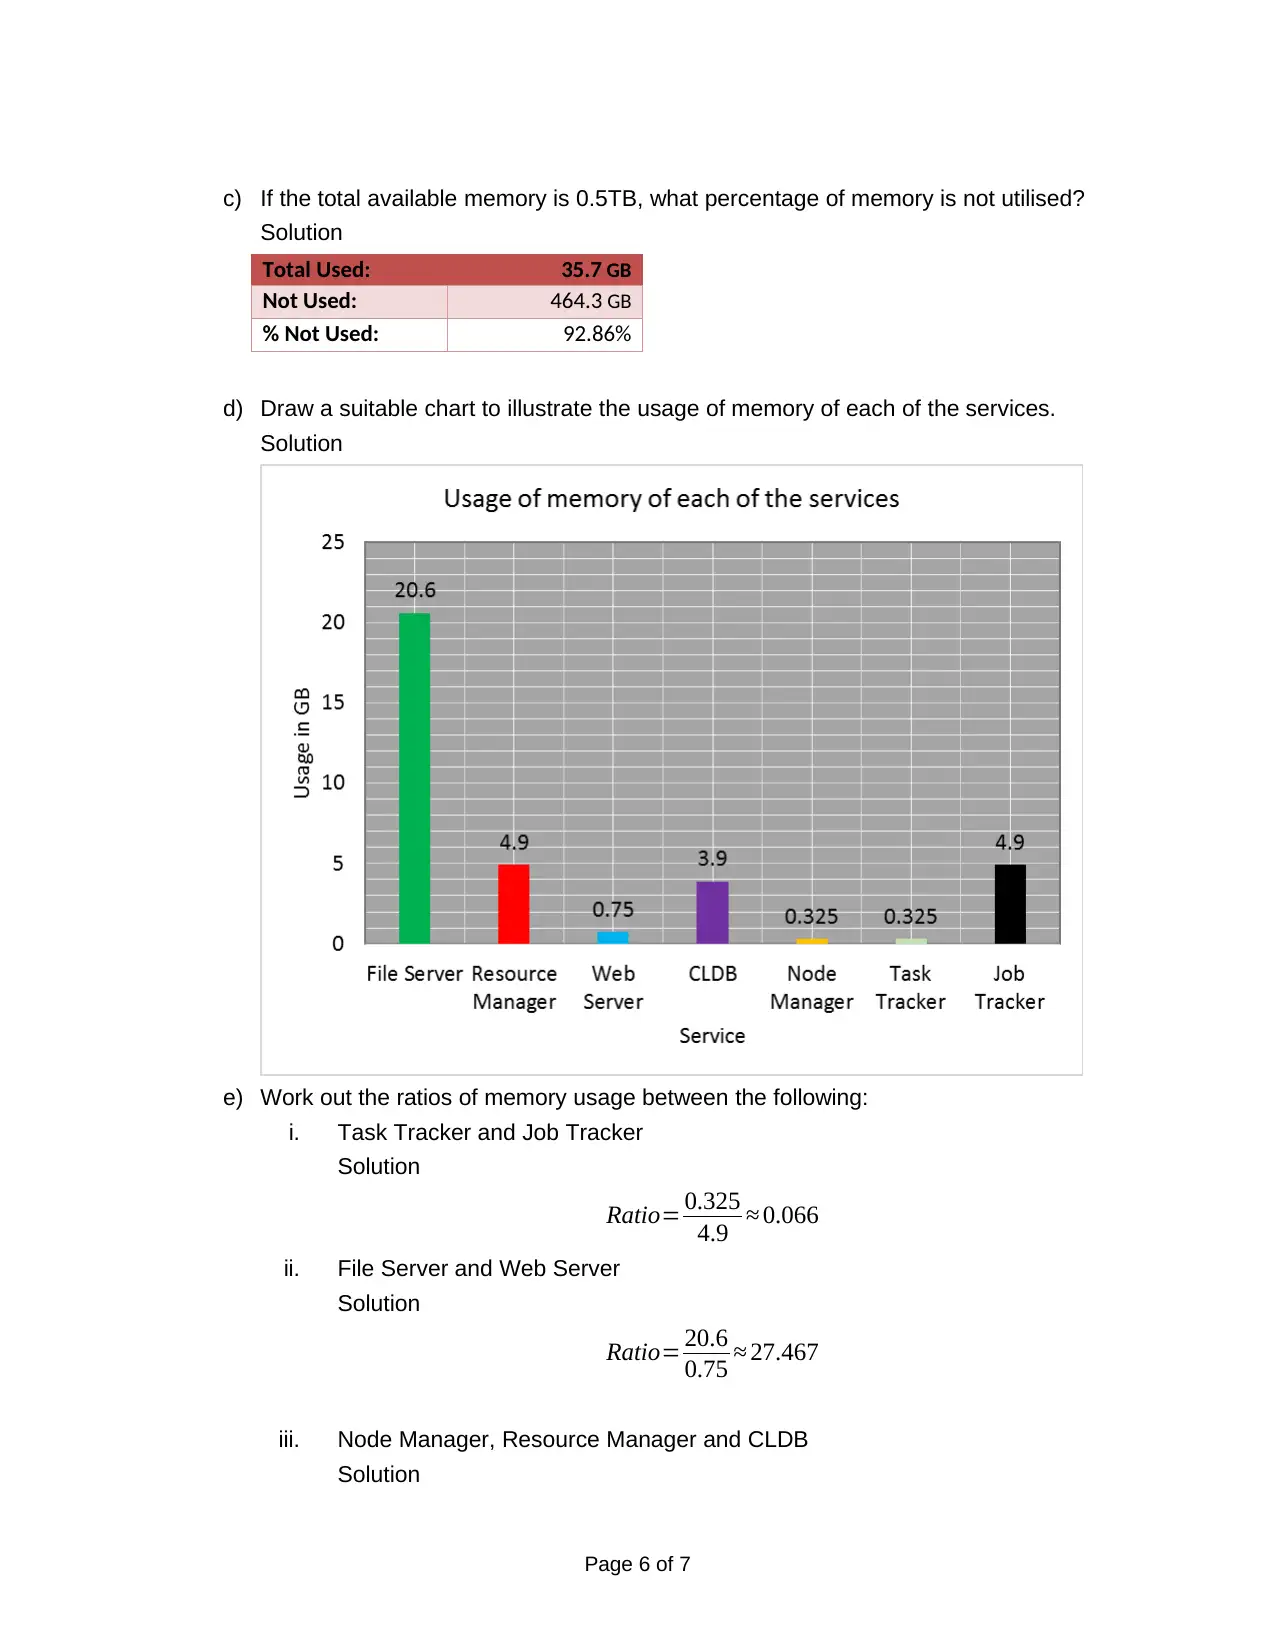
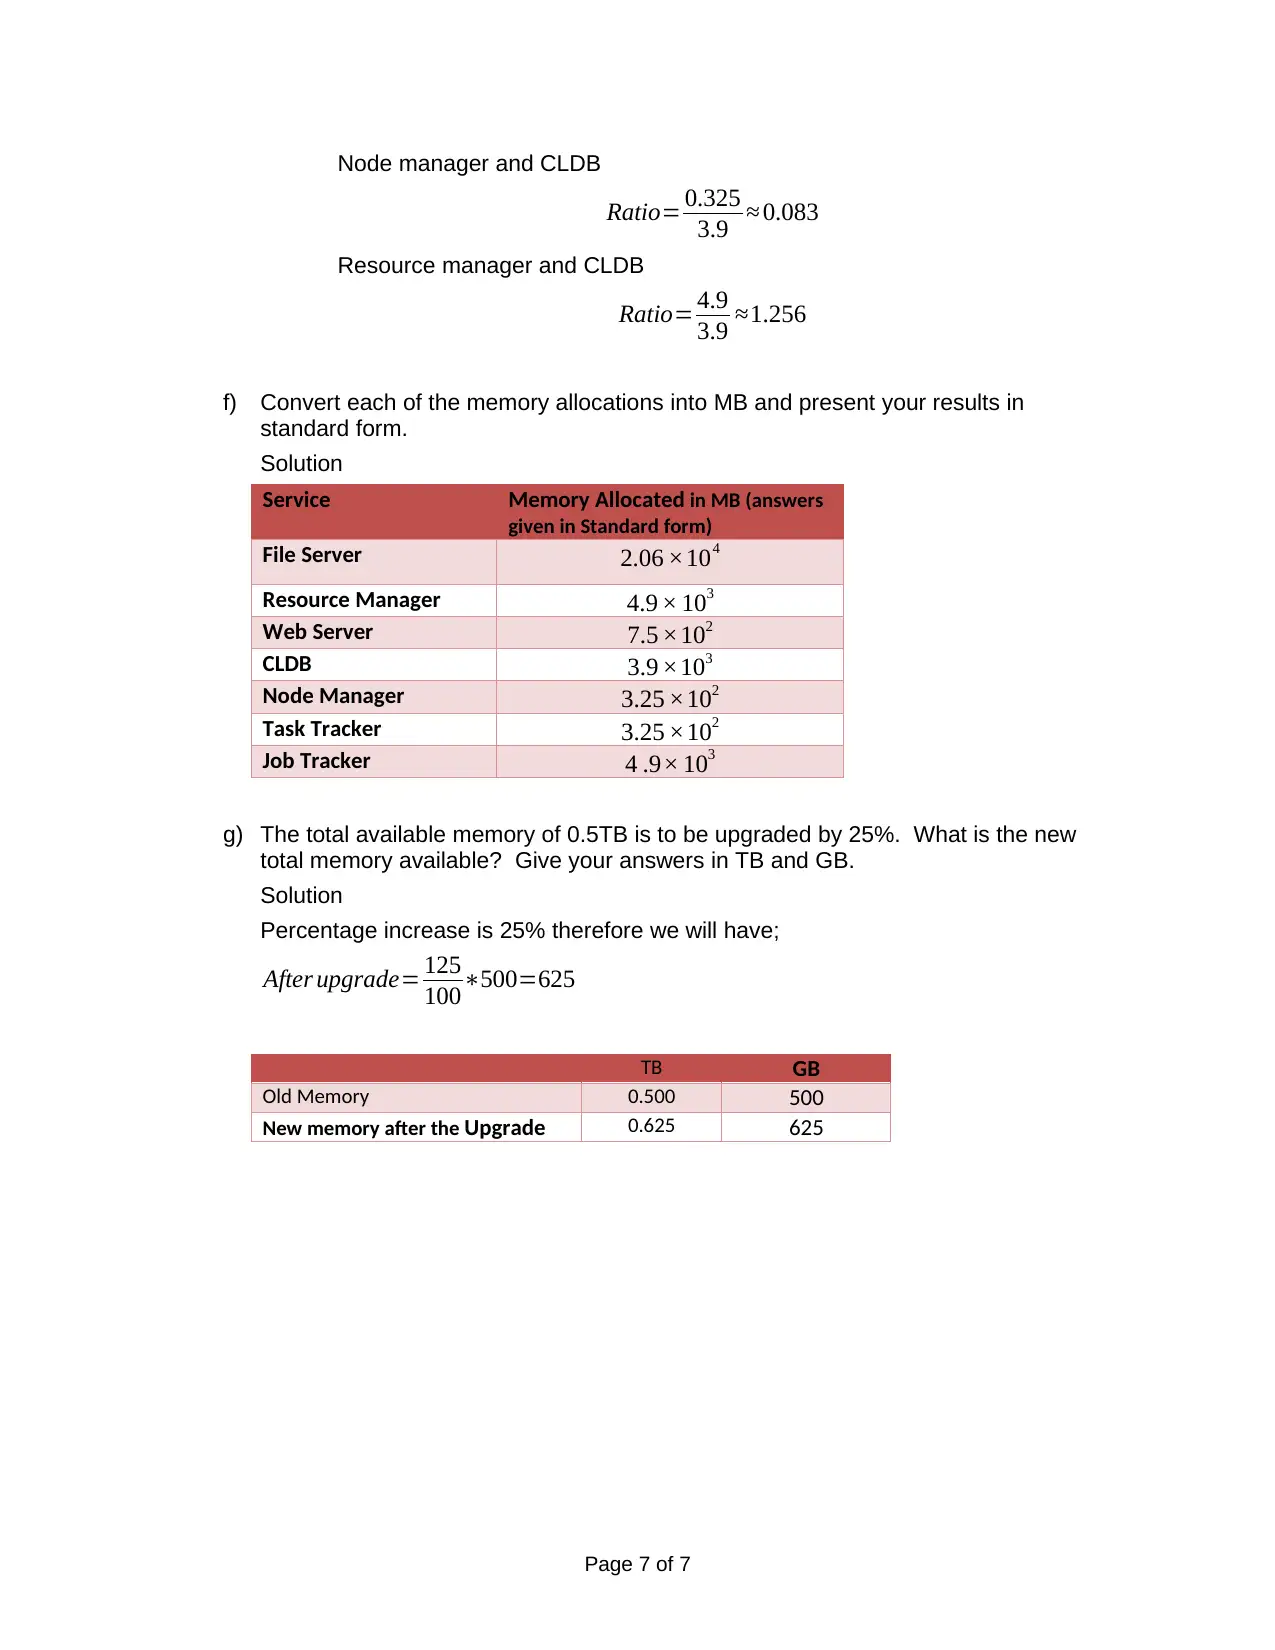
This assignment focuses on statistical analysis and memory utilization within a computing context. Task one involves creating frequency distribution tables, calculating percentage and cumulative frequencies, drawing frequency polygons, and using Microsoft Excel to determine mode, median, mean, and standard deviation for two datasets. The standard deviation is also calculated manually using a formula and then converted from Microfarads to Farads. The task concludes with a commentary on the effects of replacing capacitors in a system with a uniform capacitance value. Task two centers on memory utilization by various services on a node server, including calculating total memory used in MB and GB, determining the percentage of memory utilized by each service, calculating the percentage of unused memory, creating a chart to illustrate memory usage, working out memory usage ratios between different services, converting memory allocations to MB in standard form, and calculating the new total memory available after a 25% upgrade.
tabler-icon-diamond-filled.svg

Contribute Materials

Your contribution can guide someone’s learning journey. Share your documents today.
Document Page
School of Computing and
Engineering
Title Assignment – Course work
Module Introduction to Computing Mathematics (Level 3) (Full time)
Module Code CP30683E
Module Leader: Fehmida Mohamedali
Set by: Fehmida Mohamedali
Moderated by: Nasser Matoorian
Page 1 of 7
tabler-icon-diamond-filled.svg

Secure Best Marks with AI Grader

Need help grading? Try our AI Grader for instant feedback on your assignments.
Document Page
Task One: Statistical Analysis
a) Create a Frequency Distribution table for each data set using suitable Class Intervals.
Solution
For data 1:
Class Intervals Mid-Point Frequenc
y
20.5 <= 21.5 21 10
21.5 <= 22.5 22 32
22.5 <= 23.5 23 22
64
For data 2:
Class Intervals Mid-Point Freq
18.5 <= 19.5 19 2
19.5 <= 20.5 20 18
20.5 <= 21.5 21 12
21.5 <= 22.5 22 18
22.5 <= 23.5 23 11
23.5 <= 24.5 24 1
24.5 <= 25.5 25 2
64
b) Extend your table to include columns for Percentage Frequency and Percentage
Cumulative Frequencies.
Solution
For data 1:
Class Intervals Mid-Point Frequenc
y
%
Frequency
Cumulativ
e
Frequency
%Cumulativ
e Frequency
20.5 <= 21.5 21 10 16% 10 16%
21.5 <= 22.5 22 32 50% 42 66%
22.5 <= 23.5 23 22 34% 64 100%
64
For data 2:
Class Intervals Mid-Point Freq % Freq CF %CF
18.5 <= 19.5 19 2 3% 2 3%
19.5 <= 20.5 20 18 28% 20 31%
20.5 <= 21.5 21 12 19% 32 50%
21.5 <= 22.5 22 18 28% 50 78%
22.5 <= 23.5 23 11 17% 61 95%
Page 2 of 7
Document Page
23.5 <= 24.5 24 1 2% 62 97%
24.5 <= 25.5 25 2 3% 64 100%
64
c) Draw a Frequency Polygon to illustrate the frequency of data against class intervals for
each system.
Solution
d) Use Microsoft Excel to calculate Mode, Median, Mean and STDEVP for each system.
Give your answer to 2 decimal places.
Solution
data1 data2 data3
min 20.60 18.60 21.50
max 23.40 25.20 21.50
Page 3 of 7
Document Page
avg 22.17 21.40 21.50
stdev 0.68 1.33 0.00
median 22.20 21.45 21.50
mode 22.40 20.16 21.50
e) Using the formula calculate the standard deviation for each data set.
Compare these results with STDEVP that was worked out in section d.
Solution
The formula is σ = ( xi x ) 2
n
Where xi is the x observation i and x is the average
For dataset 1 we have;
σ = ( xi x ) 2
n = ( 21.122.17 )2+ ( 22.422.17 )2+ + ( 23.422.17 )2 + ( 21.822.17 )2
64 = 1.15+0.05+ +
64
For dataset 2 we have;
σ = ( 23.221.40 )2 + ( 20.1621.40 )2+ + ( 20.421.40 )2 + ( 20.821.40 )2
64 = 3.08+1.5 5++1. 0 1+0.37
64 =
f) Convert your results for the two standard deviations from Microfarads to Farads.
Give your answers in standard form.
Solution
For dataset 1:
The conversion from Microfarads to Farads yields;
Stdev= 0.68
106 =6.8 × 10⁷
6.8 ×10⁷
For dataset 2:
The conversion from Microfarads to Farads yields;
Stdev= 1.33
106 =1.33 ×10⁷
1 .33 ×106
g) Comment on what would happen if all capacitors for System A were replaced with the
value of 21.5 microfarad capacitance.
Page 4 of 7
tabler-icon-diamond-filled.svg

Secure Best Marks with AI Grader

Need help grading? Try our AI Grader for instant feedback on your assignments.
Document Page
Solution
If all capacitors for system A were replaced with the value of 21.5 microfarad capacitance
then the system would have zero standard deviation.
Task Two: Computing Mathematics
The diagram above shows a snapshot of memory utilisation by each service on a node
server.
a) Work out the total amount of memory utilised by all the services stated above.
Give your answer in MB and GB.
Solution
Memory Allocated
GB MB
Total Used: 35.7 35,700
b) Work out the percentage of memory utilised for each of the services. Present
your results in a table.
Solution
Service %Memory Utilized
File Server 58%
Resource Manager 14%
Web Server 2%
CLDB 11%
Node Manager 1%
Task Tracker 1%
Job Tracker 14%
Page 5 of 7
Document Page
c) If the total available memory is 0.5TB, what percentage of memory is not utilised?
Solution
Total Used: 35.7 GB
Not Used: 464.3 GB
% Not Used: 92.86%
d) Draw a suitable chart to illustrate the usage of memory of each of the services.
Solution
e) Work out the ratios of memory usage between the following:
i. Task Tracker and Job Tracker
Solution
Ratio= 0.325
4.9 0.066
ii. File Server and Web Server
Solution
Ratio= 20.6
0.75 27.467
iii. Node Manager, Resource Manager and CLDB
Solution
Page 6 of 7
Document Page
Node manager and CLDB
Ratio= 0.325
3.9 0.083
Resource manager and CLDB
Ratio= 4.9
3.9 1.256
f) Convert each of the memory allocations into MB and present your results in
standard form.
Solution
Service Memory Allocated in MB (answers
given in Standard form)
File Server 2.06 ×10⁴
Resource Manager 4.9 × 10³
Web Server 7.5 ×10²
CLDB 3.9 ×10³
Node Manager 3.25 ×10²
Task Tracker 3.25 ×10²
Job Tracker 4 .9× 103
g) The total available memory of 0.5TB is to be upgraded by 25%. What is the new
total memory available? Give your answers in TB and GB.
Solution
Percentage increase is 25% therefore we will have;
After upgrade= 125
100500=625
TB GB
Old Memory 0.500 500
New memory after the Upgrade 0.625 625
Page 7 of 7
chevron_up_icon
1 out of 7
circle_padding
hide_on_mobile
zoom_out_icon
logo.png

Your All-in-One AI-Powered Toolkit for Academic Success.

Available 24*7 on WhatsApp / Email

[object Object]