Master's Report: Analysis of Concrete Properties (SEEM511)
VerifiedAdded on 2022/09/02
|27
|2781
|9
Report
AI Summary
This report presents an analysis of the properties of 380 concrete samples, focusing on factors such as curing type (dry vs. wet), plasticizer use, fine and coarse aggregate types, water/binder ratio, and curing age (7, 14, and 28 days). The study investigates the impact of these parameters on key concrete properties including bulk density, compressive strength, initial modulus of elasticity, and water absorption. Statistical methods, including descriptive statistics, t-tests, chi-square tests, ANOVA, and regression analysis, are employed to identify significant relationships between the variables. The results indicate that wet curing did not significantly impact compressive strength compared to dry curing, while a significant difference was observed in water absorption across different curing ages. The report also explores the influence of sand and coarse aggregate types on bulk density and modulus of elasticity, respectively. The findings are discussed in relation to existing literature, with conclusions drawn on the optimal concrete mix design and curing strategies to achieve desired material properties.
<Last Name> 1
<Student’s Name>
<Instructor’s Name>
<Course Name>
31 August 2024
Computation mated
Table of Contents
Introduction..........................................................................................................................2
Literature Review................................................................................................................2
Results..................................................................................................................................3
Descriptive statistics............................................................................................................3
Inferential statistics..............................................................................................................8
Regression analysis............................................................................................................24
Discussion..........................................................................................................................24
Conclusion.........................................................................................................................25
Paraphrase This Document
Need a fresh take? Get an instant paraphrase of this document with our AI Paraphraser
<Last Name> 2
Introduction
There has been a rise in the consumption of concretes over the past years, [7]. The
number of people using generated energy has been approximated to be more than 2.5
billion with the use of virgin materials being considered to have negative effect on the
environment [17]. The properties of a good concrete are determined by factors such as
compressive strength, bulk density, water absorption and initial modulus of elasticity [1].
Optimizing the above-mentioned properties is expected to result in high quality of
concrete that are durable and of great strength, [8].
A total of 380 concrete samples were tested for properties including bulk density,
compressive strength, initial modulus of elasticity, and water absorption. Following
parameters were used for the study:
Curing Type: The samples were either dry-cured in the open air or wet-cured by
placing them in a tank of water.
Plasticizer: Plasticizer was used in the concrete mix for preparing some of the
samples, [12].
Fine Aggregate Type: There were a total of 5 types of fine aggregate. These
types have been named A, B, C, D, and E.
Coarse Aggregate Type: There were a total of 3 types of coarse aggregates.
These types have been named A, B, and C.
Water/binder Ratio: The water/binder ratio ranged between 0.3 and 0.75.
Curing Age: Curing age refers to the number of days after casting when the tests
were performed. The samples were tested 7, 14, or 28 days after casting.
The following research hypothesis was developed and tested;
1. There is no statistically significant difference between curing type and the
comprehensive strength
2. There is no statistically significant difference between Uses Plasticizer and the
Water/binder Ratio
3. There is no statistically significant difference between curing age and water
absorption
4. There is no mean difference of the bulk density for the sand types
5. There is no mean difference of the Modulus of Elasticity for the Coarse
Aggregate Types
6. There is no statistically significant difference between curing type and the sand
type
7. There is no statistically significant difference between curing age and the Coarse
Aggregate Type
Literature Review
Generally, in order to enhance the comprehensive strength of any building, wet curing
strategies must be adopted. The authors [11] stated that there is a relationship between
comprehensive strength and wet curing strategies. In addition, several studies have
established that there is no significant difference between using Plasticizer and the
Water/binder Ratios [16].
<Last Name> 3
Furthermore, some studies investigating the relationship between curing age and water
absorption have shown that the more time is taken for the curing process, the more likely
water absorption is required. For example, in a study by [9], the authors established that
for curing processes that go for several weeks like 1 month requires more water for
absorption.
In addition, some authors have established that there is no mean difference in the bulk
density for the sand types. For example, in a study by [18] show that different sand types
do not influence the soil bulkiness. In fact, the authors found out that despite different
types of sand that may be used, in one way or the other they do not influence the bulk
densities.
Finally, literature shows that there is a mean difference in the Modulus of Elasticity for
the Coarse Aggregate Types. For example, [2], in their studies established that the
Modulus of Elasticity has a mean difference for the Coarse Aggregate Types.
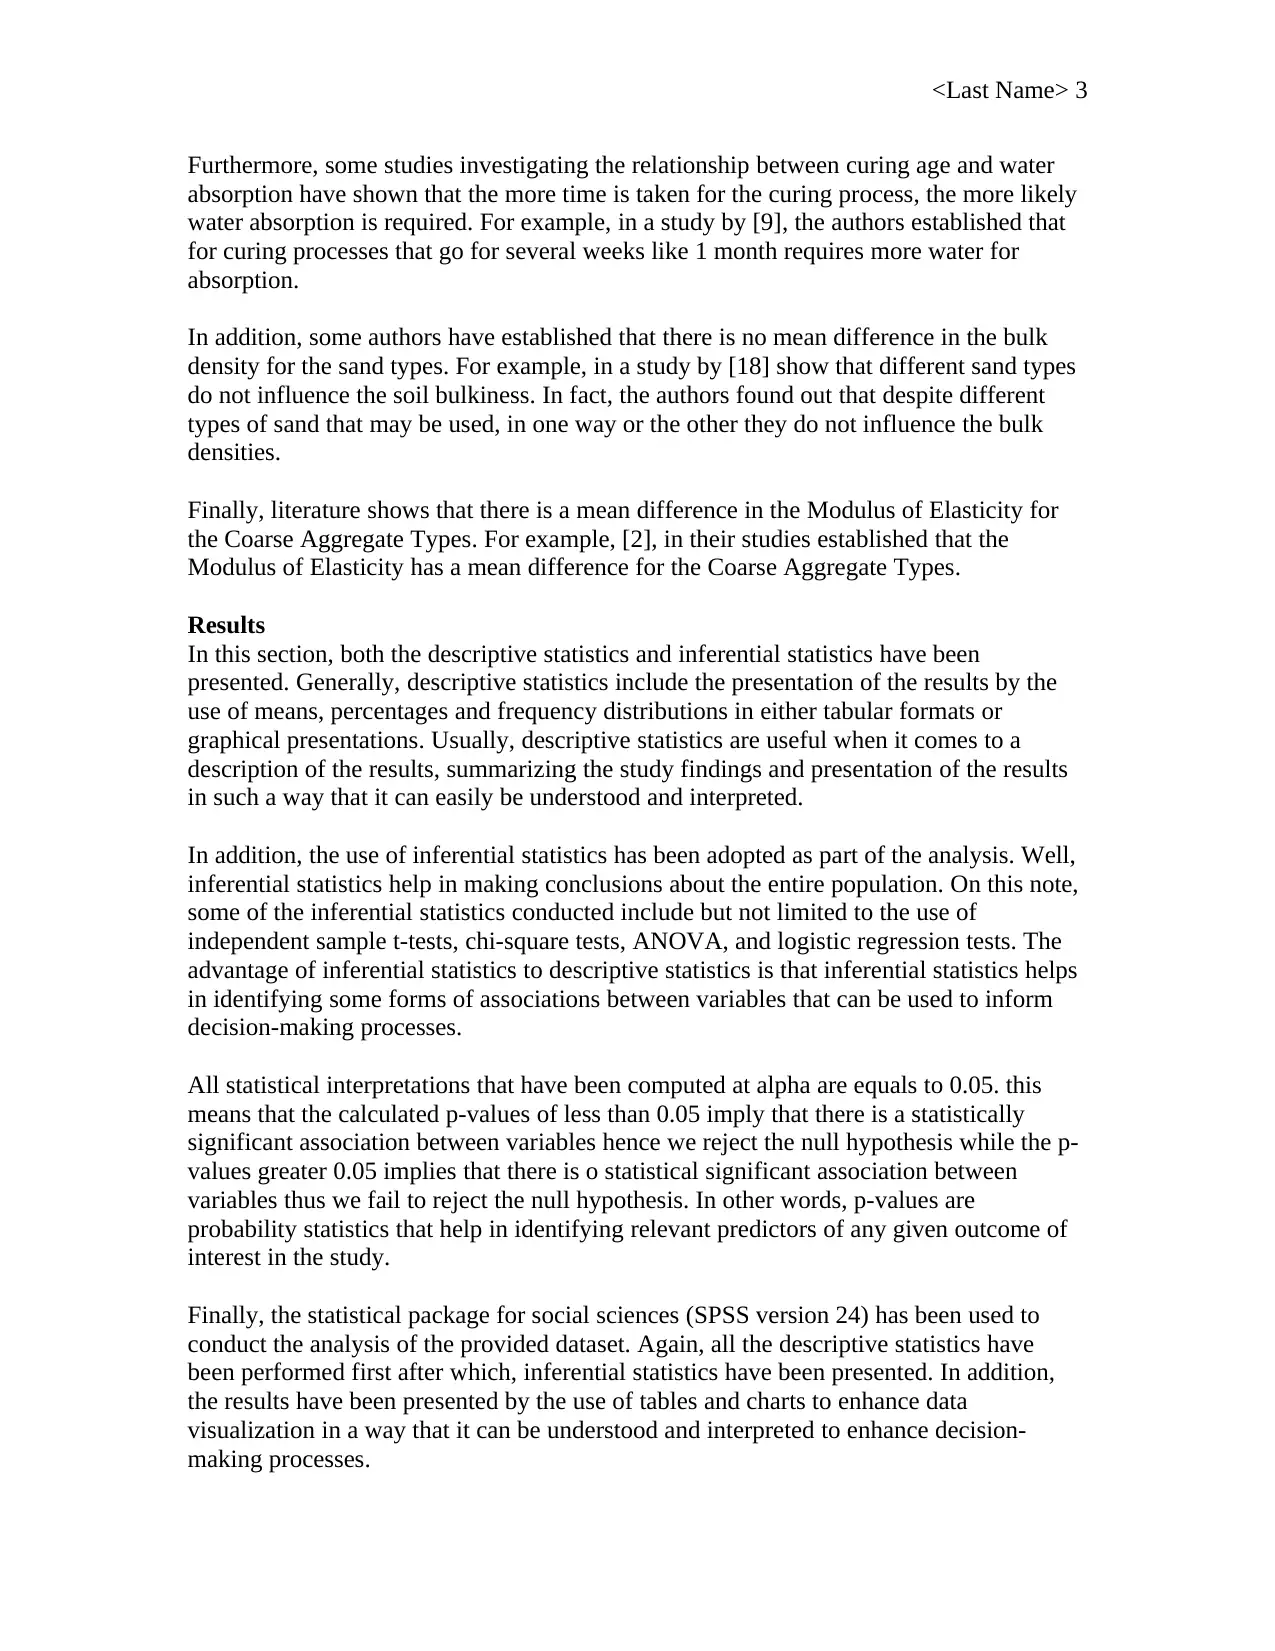
Results
In this section, both the descriptive statistics and inferential statistics have been
presented. Generally, descriptive statistics include the presentation of the results by the
use of means, percentages and frequency distributions in either tabular formats or
graphical presentations. Usually, descriptive statistics are useful when it comes to a
description of the results, summarizing the study findings and presentation of the results
in such a way that it can easily be understood and interpreted.
In addition, the use of inferential statistics has been adopted as part of the analysis. Well,
inferential statistics help in making conclusions about the entire population. On this note,
some of the inferential statistics conducted include but not limited to the use of
independent sample t-tests, chi-square tests, ANOVA, and logistic regression tests. The
advantage of inferential statistics to descriptive statistics is that inferential statistics helps
in identifying some forms of associations between variables that can be used to inform
decision-making processes.
All statistical interpretations that have been computed at alpha are equals to 0.05. this
means that the calculated p-values of less than 0.05 imply that there is a statistically
significant association between variables hence we reject the null hypothesis while the p-
values greater 0.05 implies that there is o statistical significant association between
variables thus we fail to reject the null hypothesis. In other words, p-values are
probability statistics that help in identifying relevant predictors of any given outcome of
interest in the study.
Finally, the statistical package for social sciences (SPSS version 24) has been used to
conduct the analysis of the provided dataset. Again, all the descriptive statistics have
been performed first after which, inferential statistics have been presented. In addition,
the results have been presented by the use of tables and charts to enhance data
visualization in a way that it can be understood and interpreted to enhance decision-
making processes.
Furthermore, some studies investigating the relationship between curing age and water
absorption have shown that the more time is taken for the curing process, the more likely
water absorption is required. For example, in a study by [9], the authors established that
for curing processes that go for several weeks like 1 month requires more water for
absorption.
In addition, some authors have established that there is no mean difference in the bulk
density for the sand types. For example, in a study by [18] show that different sand types
do not influence the soil bulkiness. In fact, the authors found out that despite different
types of sand that may be used, in one way or the other they do not influence the bulk
densities.
Finally, literature shows that there is a mean difference in the Modulus of Elasticity for
the Coarse Aggregate Types. For example, [2], in their studies established that the
Modulus of Elasticity has a mean difference for the Coarse Aggregate Types.
Results
In this section, both the descriptive statistics and inferential statistics have been
presented. Generally, descriptive statistics include the presentation of the results by the
use of means, percentages and frequency distributions in either tabular formats or
graphical presentations. Usually, descriptive statistics are useful when it comes to a
description of the results, summarizing the study findings and presentation of the results
in such a way that it can easily be understood and interpreted.
In addition, the use of inferential statistics has been adopted as part of the analysis. Well,
inferential statistics help in making conclusions about the entire population. On this note,
some of the inferential statistics conducted include but not limited to the use of
independent sample t-tests, chi-square tests, ANOVA, and logistic regression tests. The
advantage of inferential statistics to descriptive statistics is that inferential statistics helps
in identifying some forms of associations between variables that can be used to inform
decision-making processes.
All statistical interpretations that have been computed at alpha are equals to 0.05. this
means that the calculated p-values of less than 0.05 imply that there is a statistically
significant association between variables hence we reject the null hypothesis while the p-
values greater 0.05 implies that there is o statistical significant association between
variables thus we fail to reject the null hypothesis. In other words, p-values are
probability statistics that help in identifying relevant predictors of any given outcome of
interest in the study.
Finally, the statistical package for social sciences (SPSS version 24) has been used to
conduct the analysis of the provided dataset. Again, all the descriptive statistics have
been performed first after which, inferential statistics have been presented. In addition,
the results have been presented by the use of tables and charts to enhance data
visualization in a way that it can be understood and interpreted to enhance decision-
making processes.
⊘ This is a preview!⊘
Do you want full access?
Subscribe today to unlock all pages.
Trusted by 1+ million students worldwide
<Last Name> 4
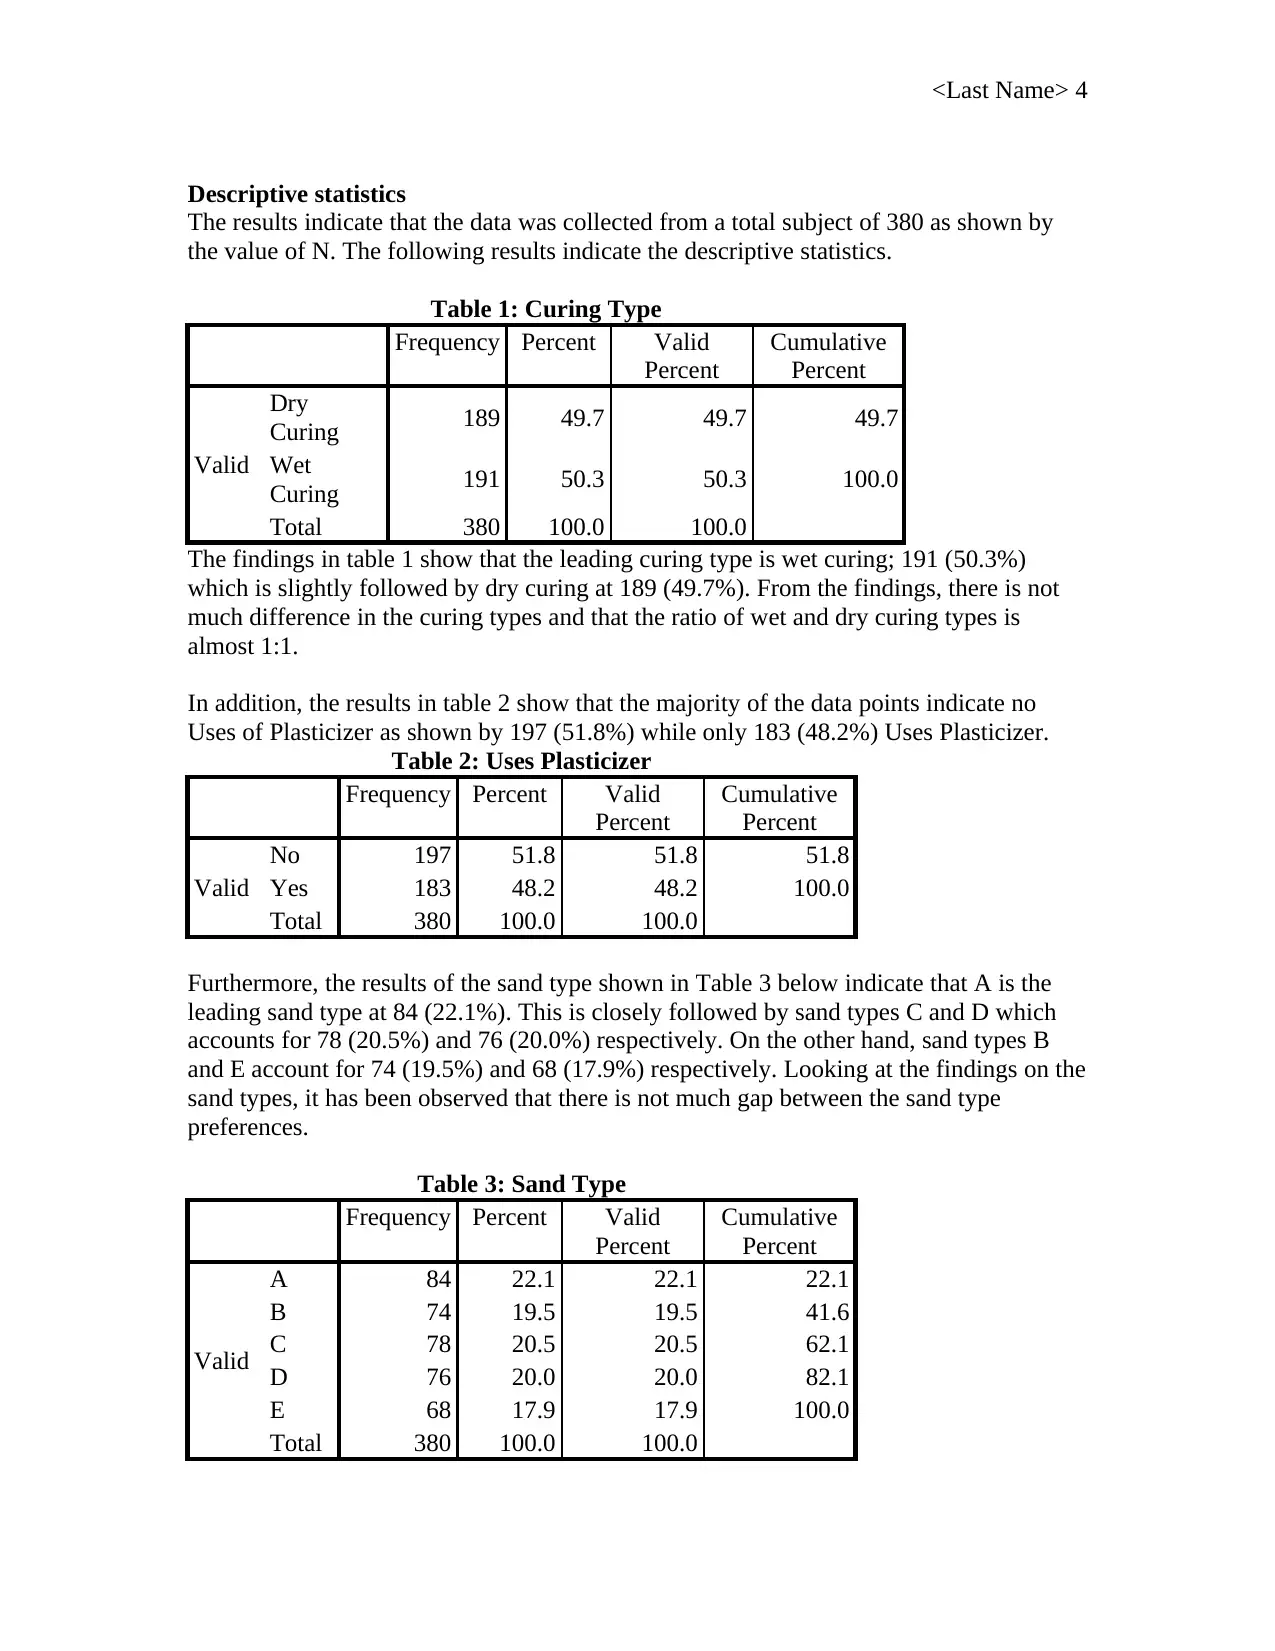
Descriptive statistics
The results indicate that the data was collected from a total subject of 380 as shown by
the value of N. The following results indicate the descriptive statistics.
Table 1: Curing Type
Frequency Percent Valid
Percent
Cumulative
Percent
Valid
Dry
Curing 189 49.7 49.7 49.7
Wet
Curing 191 50.3 50.3 100.0
Total 380 100.0 100.0
The findings in table 1 show that the leading curing type is wet curing; 191 (50.3%)
which is slightly followed by dry curing at 189 (49.7%). From the findings, there is not
much difference in the curing types and that the ratio of wet and dry curing types is
almost 1:1.
In addition, the results in table 2 show that the majority of the data points indicate no
Uses of Plasticizer as shown by 197 (51.8%) while only 183 (48.2%) Uses Plasticizer.
Table 2: Uses Plasticizer
Frequency Percent Valid
Percent
Cumulative
Percent
Valid
No 197 51.8 51.8 51.8
Yes 183 48.2 48.2 100.0
Total 380 100.0 100.0
Furthermore, the results of the sand type shown in Table 3 below indicate that A is the
leading sand type at 84 (22.1%). This is closely followed by sand types C and D which
accounts for 78 (20.5%) and 76 (20.0%) respectively. On the other hand, sand types B
and E account for 74 (19.5%) and 68 (17.9%) respectively. Looking at the findings on the
sand types, it has been observed that there is not much gap between the sand type
preferences.
Table 3: Sand Type
Frequency Percent Valid
Percent
Cumulative
Percent
Valid
A 84 22.1 22.1 22.1
B 74 19.5 19.5 41.6
C 78 20.5 20.5 62.1
D 76 20.0 20.0 82.1
E 68 17.9 17.9 100.0
Total 380 100.0 100.0
Paraphrase This Document
Need a fresh take? Get an instant paraphrase of this document with our AI Paraphraser
<Last Name> 5
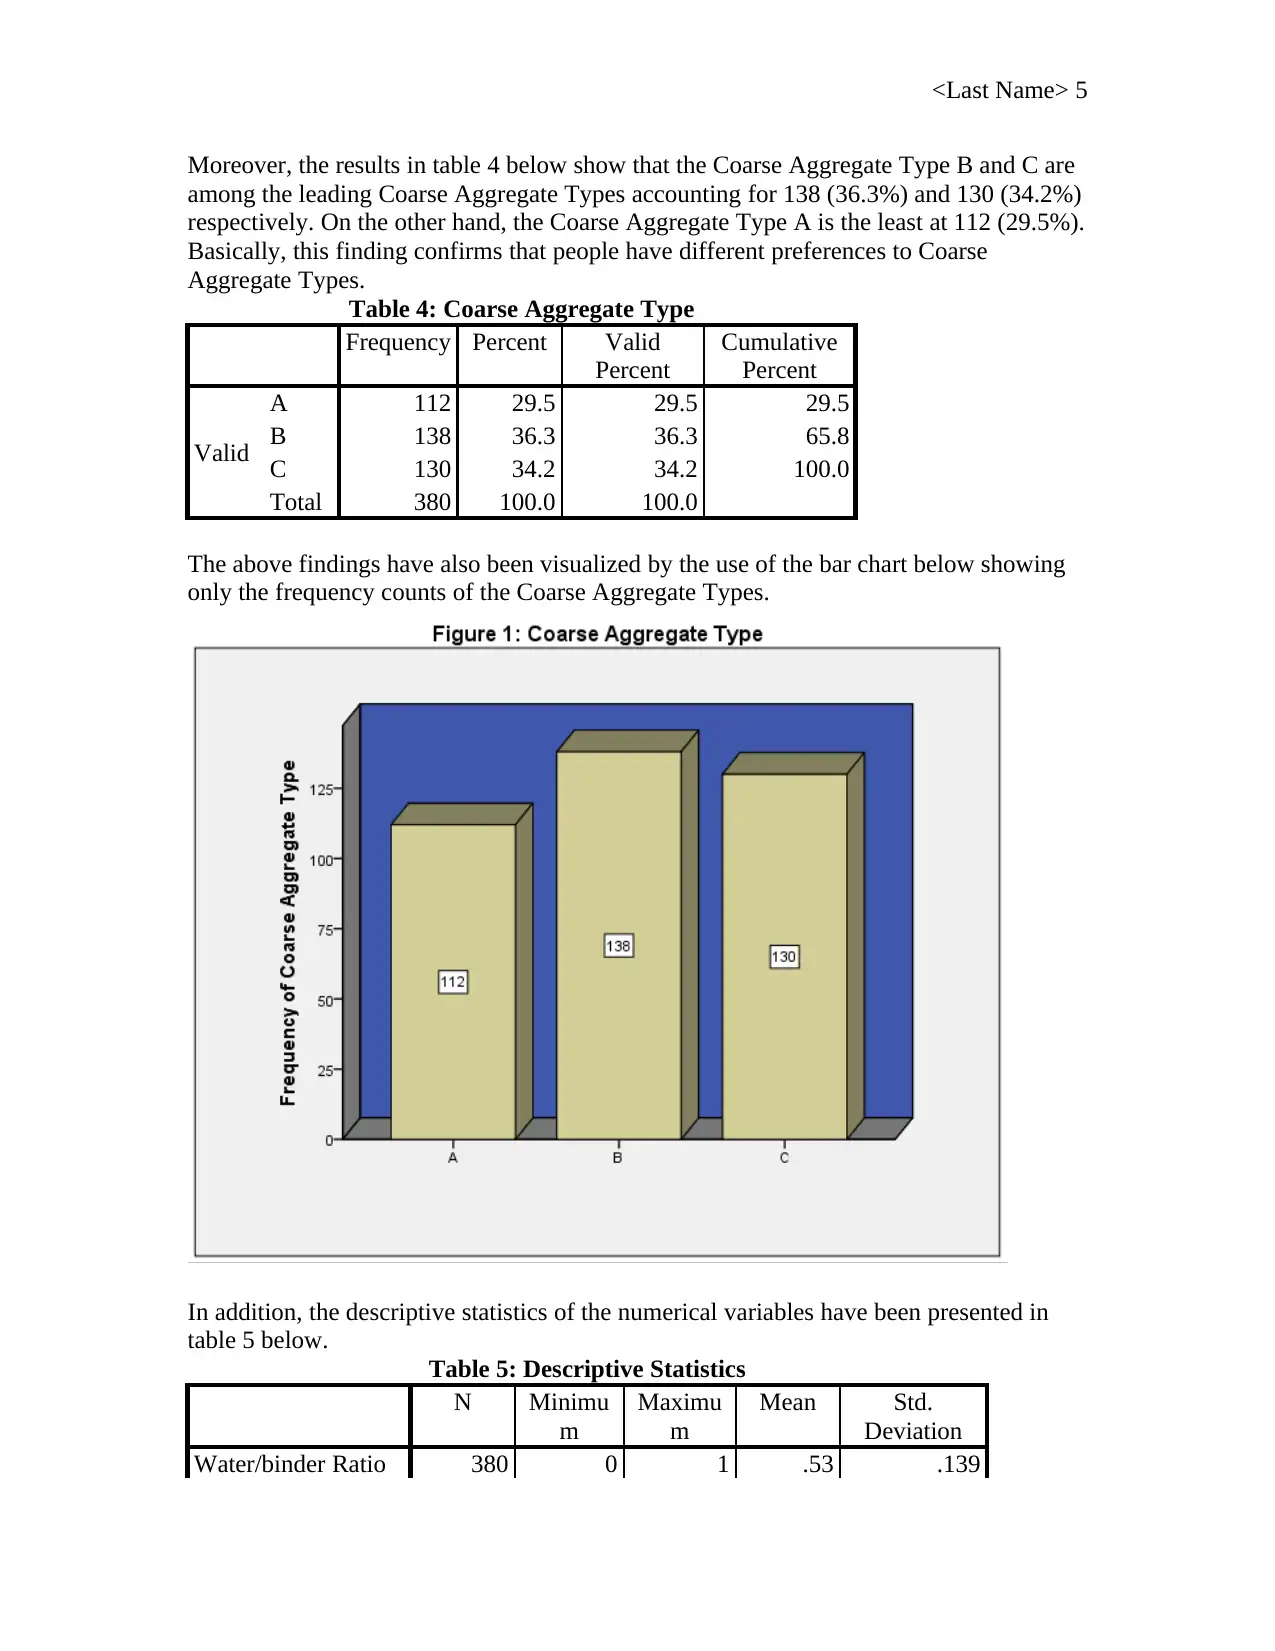
Moreover, the results in table 4 below show that the Coarse Aggregate Type B and C are
among the leading Coarse Aggregate Types accounting for 138 (36.3%) and 130 (34.2%)
respectively. On the other hand, the Coarse Aggregate Type A is the least at 112 (29.5%).
Basically, this finding confirms that people have different preferences to Coarse
Aggregate Types.
Table 4: Coarse Aggregate Type
Frequency Percent Valid
Percent
Cumulative
Percent
Valid
A 112 29.5 29.5 29.5
B 138 36.3 36.3 65.8
C 130 34.2 34.2 100.0
Total 380 100.0 100.0
The above findings have also been visualized by the use of the bar chart below showing
only the frequency counts of the Coarse Aggregate Types.
In addition, the descriptive statistics of the numerical variables have been presented in
table 5 below.
Table 5: Descriptive Statistics
N Minimu
m
Maximu
m
Mean Std.
Deviation
Water/binder Ratio 380 0 1 .53 .139
<Last Name> 6
Bulk Density 380 1775 2725 2202.65 216.549
Compressive
Strength 380 18 72 43.33 11.649
Modulus of
Elasticity 380 19 39 28.53 5.291
Water Absorption 380 1 12 6.43 2.207
Valid N (listwise) 380
From the findings in table 5, the mean of the Water/binder Ratio is calculated to be 0.53
with a standard deviation of 0.139. in addition, the Water/binder Ratio has a minimum
and a maximum value of 0 to 1 respectively. For the Bulk Density, it has a mean of
2202.65 and a standard deviation of 216.549 while its minimum and maximum values are
calculated to be 1775 and 2725 respectively. Moreover, the results indicate that the mean
Compressive Strength is 43.33 while its standard deviation is calculated to be 11.649. the
minimum and maximum values of the Compressive Strength are 18 and 72 respectively.
Additionally, the mean and standard deviation of the Modulus of Elasticity are 28.53 and
5.291 respectively while the minimum and maximum values of the Modulus of Elasticity
are given as 19 and 39 respectively. Finally, Water Absorption has a mean of 6.43 with a
standard deviation of 2.207. the minimum and maximum values of the Water Absorption
are given as 1 and 12 respectively.
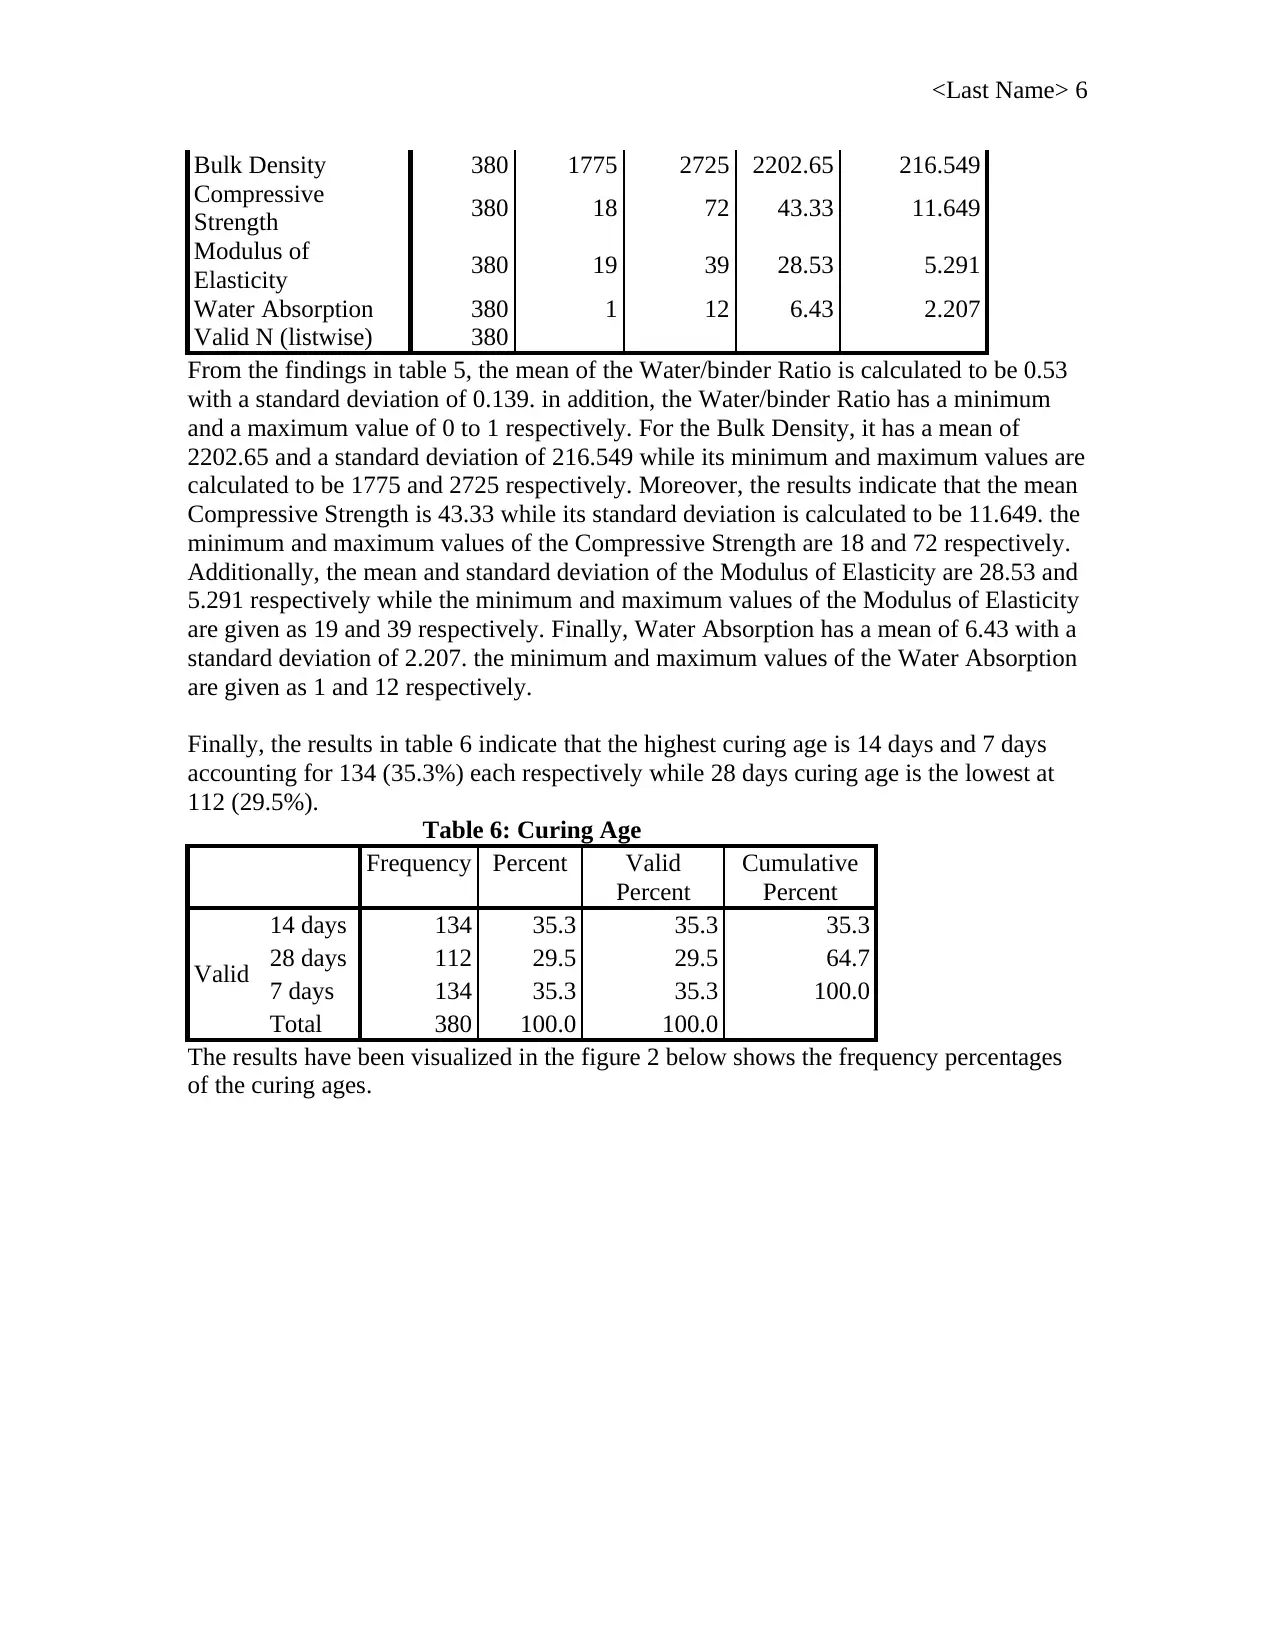
Finally, the results in table 6 indicate that the highest curing age is 14 days and 7 days
accounting for 134 (35.3%) each respectively while 28 days curing age is the lowest at
112 (29.5%).
Table 6: Curing Age
Frequency Percent Valid
Percent
Cumulative
Percent
Valid
14 days 134 35.3 35.3 35.3
28 days 112 29.5 29.5 64.7
7 days 134 35.3 35.3 100.0
Total 380 100.0 100.0
The results have been visualized in the figure 2 below shows the frequency percentages
of the curing ages.
Bulk Density 380 1775 2725 2202.65 216.549
Compressive
Strength 380 18 72 43.33 11.649
Modulus of
Elasticity 380 19 39 28.53 5.291
Water Absorption 380 1 12 6.43 2.207
Valid N (listwise) 380
From the findings in table 5, the mean of the Water/binder Ratio is calculated to be 0.53
with a standard deviation of 0.139. in addition, the Water/binder Ratio has a minimum
and a maximum value of 0 to 1 respectively. For the Bulk Density, it has a mean of
2202.65 and a standard deviation of 216.549 while its minimum and maximum values are
calculated to be 1775 and 2725 respectively. Moreover, the results indicate that the mean
Compressive Strength is 43.33 while its standard deviation is calculated to be 11.649. the
minimum and maximum values of the Compressive Strength are 18 and 72 respectively.
Additionally, the mean and standard deviation of the Modulus of Elasticity are 28.53 and
5.291 respectively while the minimum and maximum values of the Modulus of Elasticity
are given as 19 and 39 respectively. Finally, Water Absorption has a mean of 6.43 with a
standard deviation of 2.207. the minimum and maximum values of the Water Absorption
are given as 1 and 12 respectively.
Finally, the results in table 6 indicate that the highest curing age is 14 days and 7 days
accounting for 134 (35.3%) each respectively while 28 days curing age is the lowest at
112 (29.5%).
Table 6: Curing Age
Frequency Percent Valid
Percent
Cumulative
Percent
Valid
14 days 134 35.3 35.3 35.3
28 days 112 29.5 29.5 64.7
7 days 134 35.3 35.3 100.0
Total 380 100.0 100.0
The results have been visualized in the figure 2 below shows the frequency percentages
of the curing ages.
⊘ This is a preview!⊘
Do you want full access?
Subscribe today to unlock all pages.
Trusted by 1+ million students worldwide
<Last Name> 7
Paraphrase This Document
Need a fresh take? Get an instant paraphrase of this document with our AI Paraphraser
<Last Name> 8
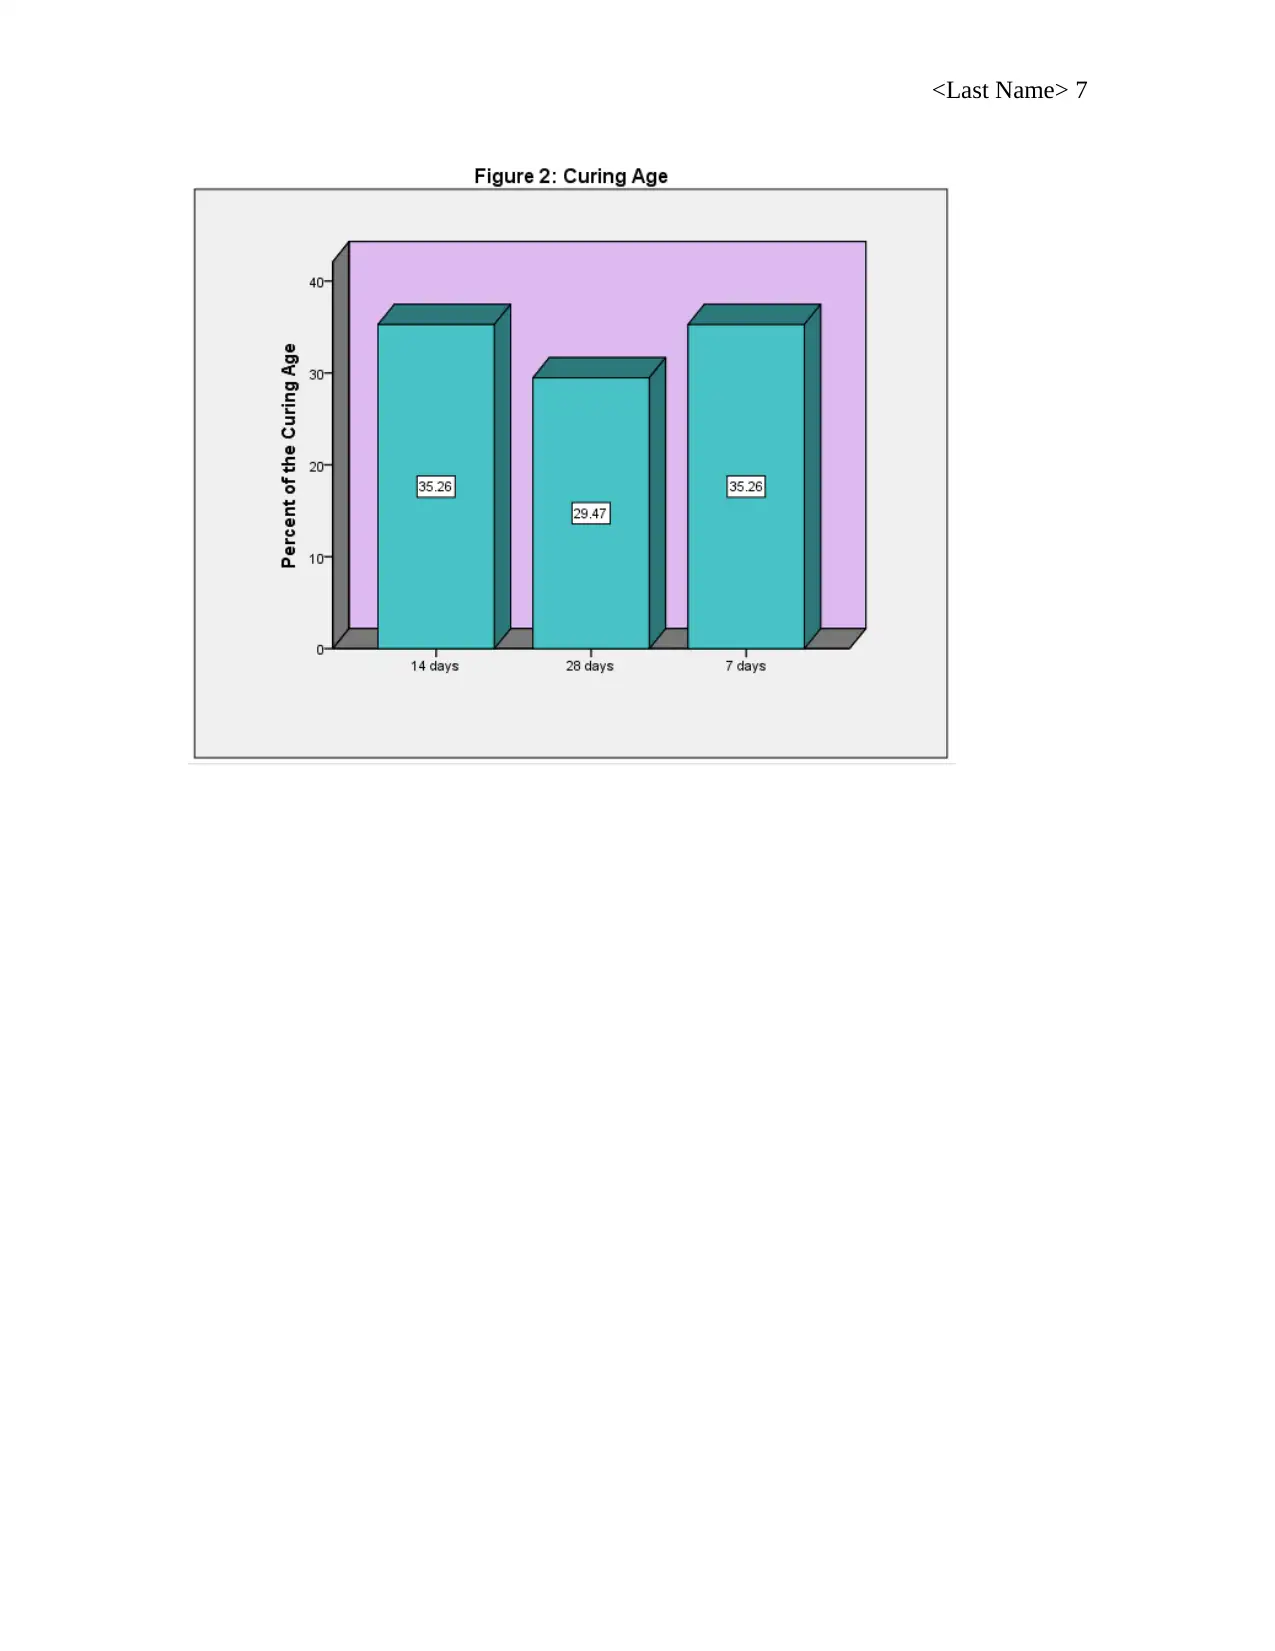
Inferential statistics
For the purposes of conducting the inferential statistics, the data was checked in general
and see if there are any outliers depending on the study hypothesis as indicated above.
This was made possible by drawing skewness graphs as well as boxplots as a means of
performing the relevant tests to check the data validity, skewness, bias, etc.
Looking at the boxplot below, there are no outliers for the data showing the relationship
between curing type and the comprehensive strength hence independent sample t-test is
conducted with the data the way it is.
Similarly, the boxplot below indicates that there are no outliers for the data showing the
relationship between Uses Plasticizer and the Water/binder Ratio thus the independent
sample t-test is conducted with the data the way it is.
Inferential statistics
For the purposes of conducting the inferential statistics, the data was checked in general
and see if there are any outliers depending on the study hypothesis as indicated above.
This was made possible by drawing skewness graphs as well as boxplots as a means of
performing the relevant tests to check the data validity, skewness, bias, etc.
Looking at the boxplot below, there are no outliers for the data showing the relationship
between curing type and the comprehensive strength hence independent sample t-test is
conducted with the data the way it is.
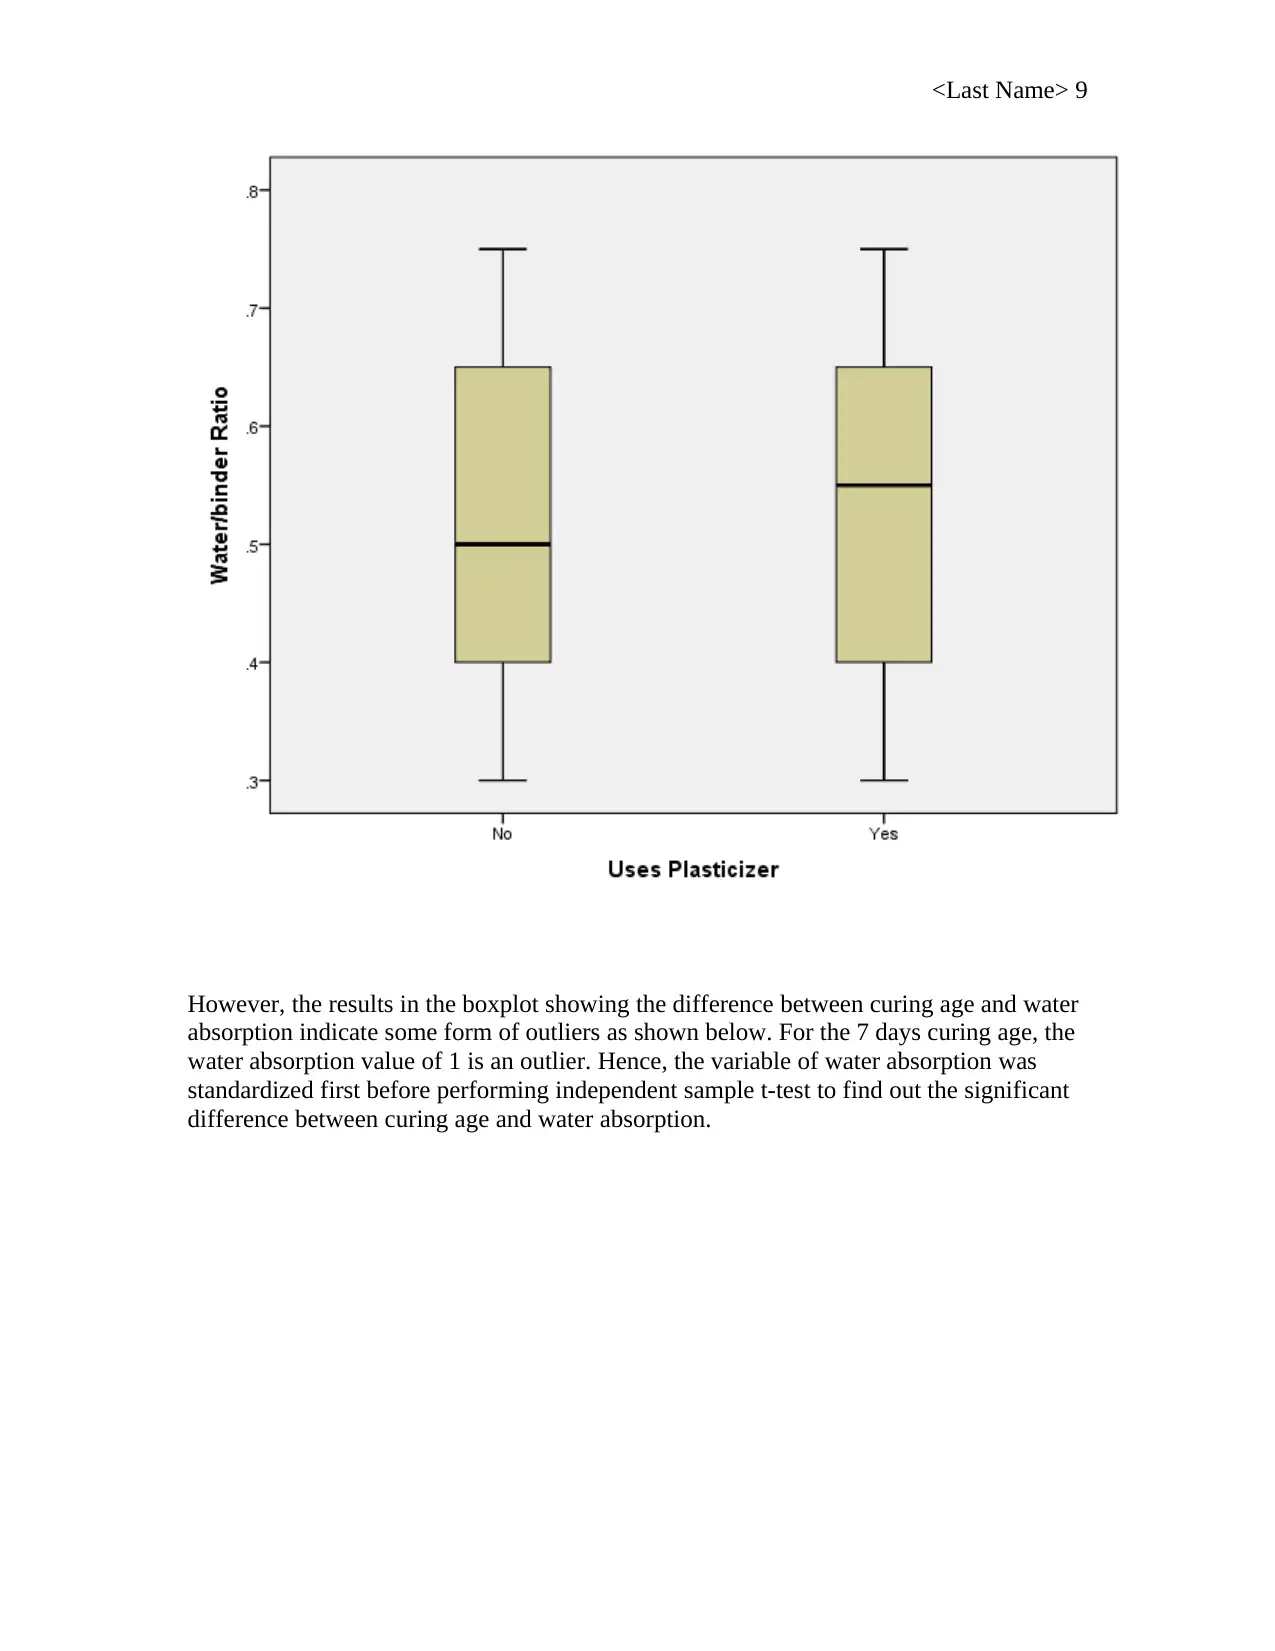
Similarly, the boxplot below indicates that there are no outliers for the data showing the
relationship between Uses Plasticizer and the Water/binder Ratio thus the independent
sample t-test is conducted with the data the way it is.
<Last Name> 9
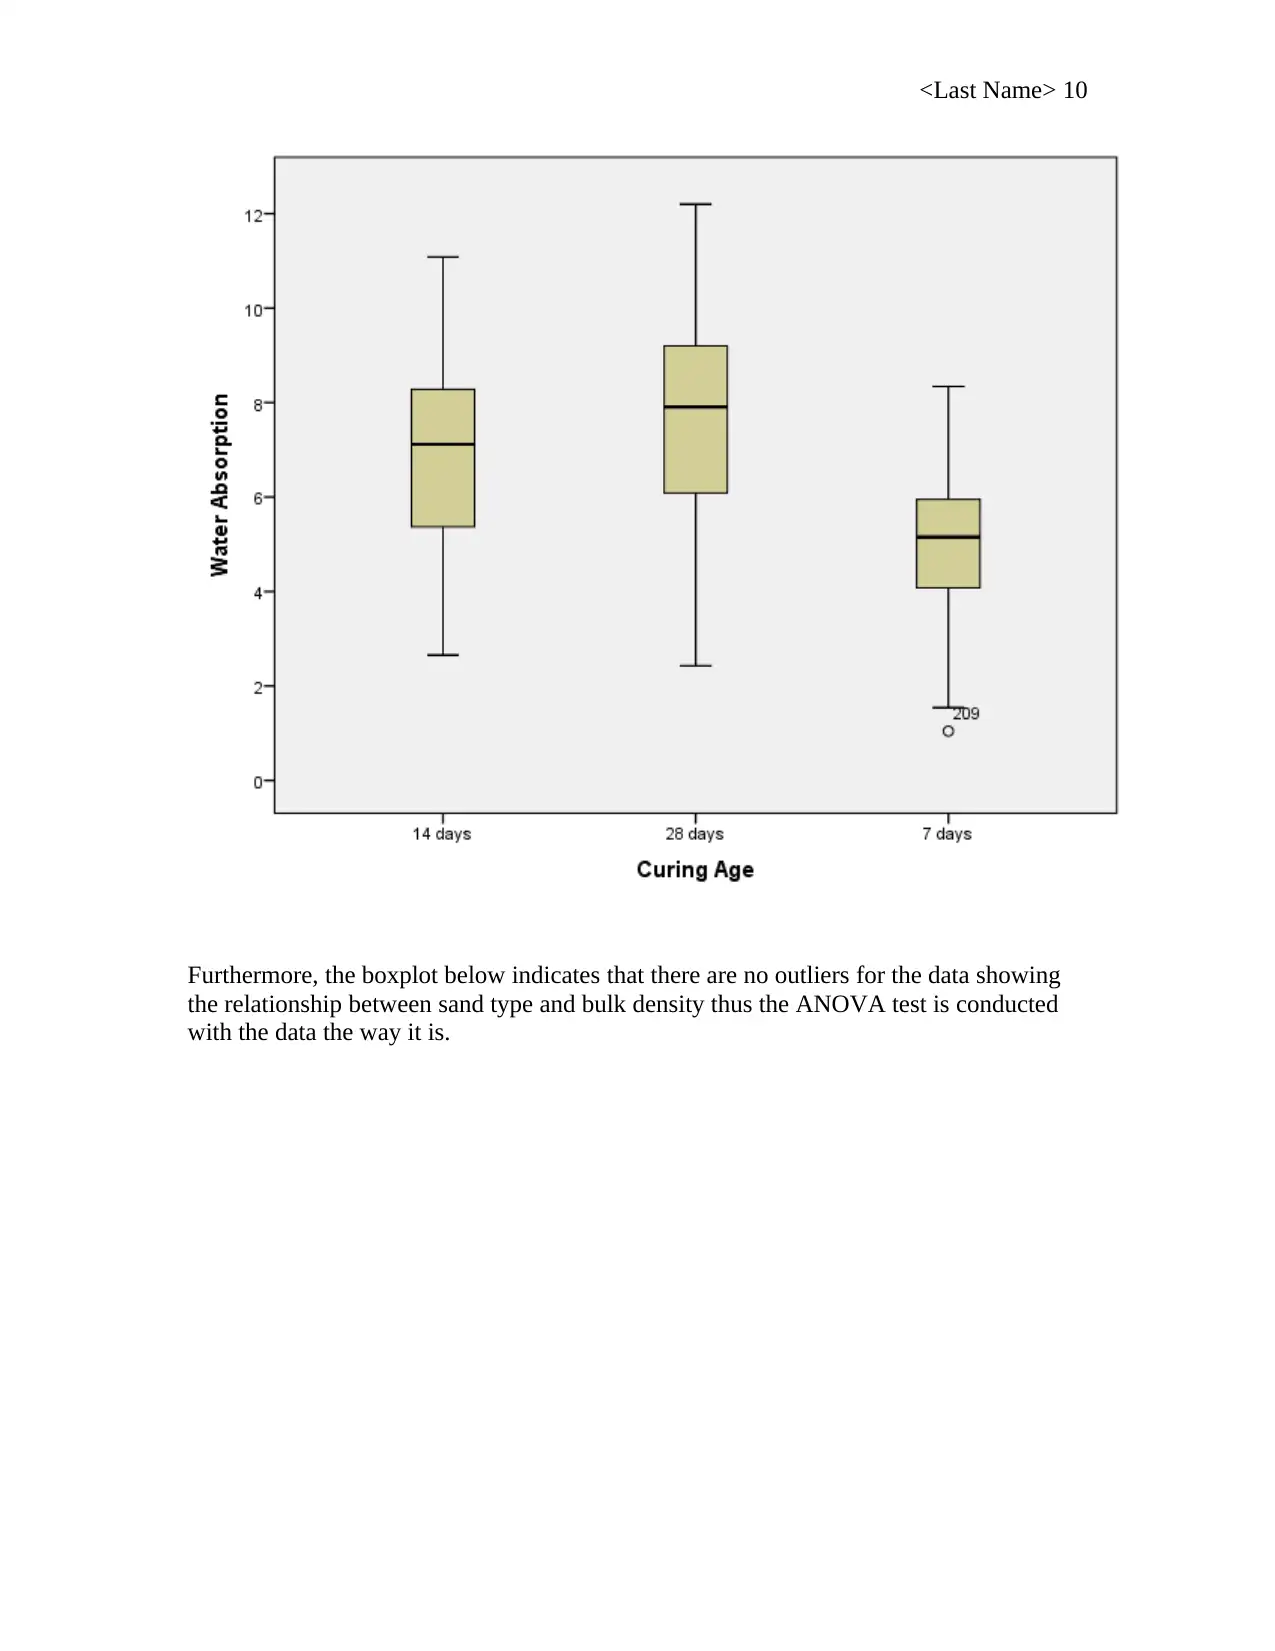
However, the results in the boxplot showing the difference between curing age and water
absorption indicate some form of outliers as shown below. For the 7 days curing age, the
water absorption value of 1 is an outlier. Hence, the variable of water absorption was
standardized first before performing independent sample t-test to find out the significant
difference between curing age and water absorption.
⊘ This is a preview!⊘
Do you want full access?
Subscribe today to unlock all pages.
Trusted by 1+ million students worldwide
<Last Name> 10
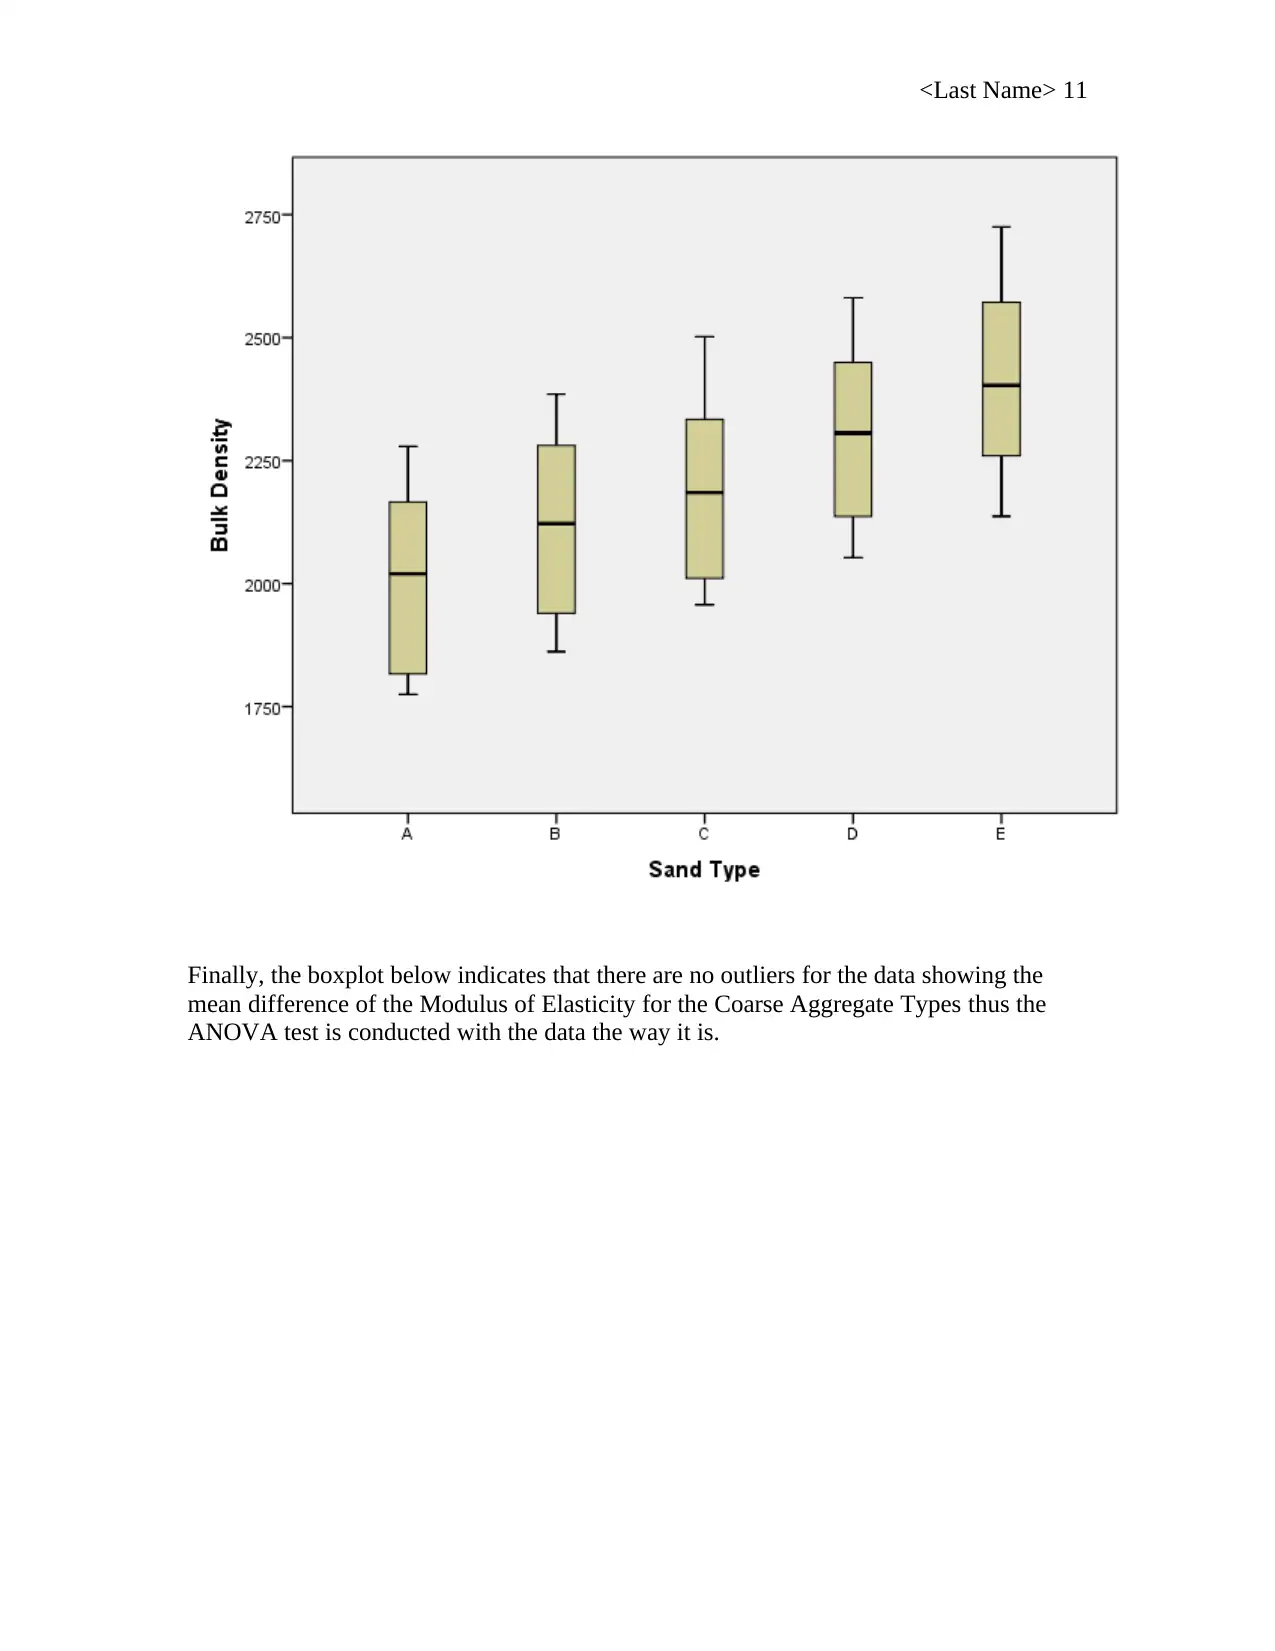
Furthermore, the boxplot below indicates that there are no outliers for the data showing
the relationship between sand type and bulk density thus the ANOVA test is conducted
with the data the way it is.
Furthermore, the boxplot below indicates that there are no outliers for the data showing
the relationship between sand type and bulk density thus the ANOVA test is conducted
with the data the way it is.
Paraphrase This Document
Need a fresh take? Get an instant paraphrase of this document with our AI Paraphraser
<Last Name> 11
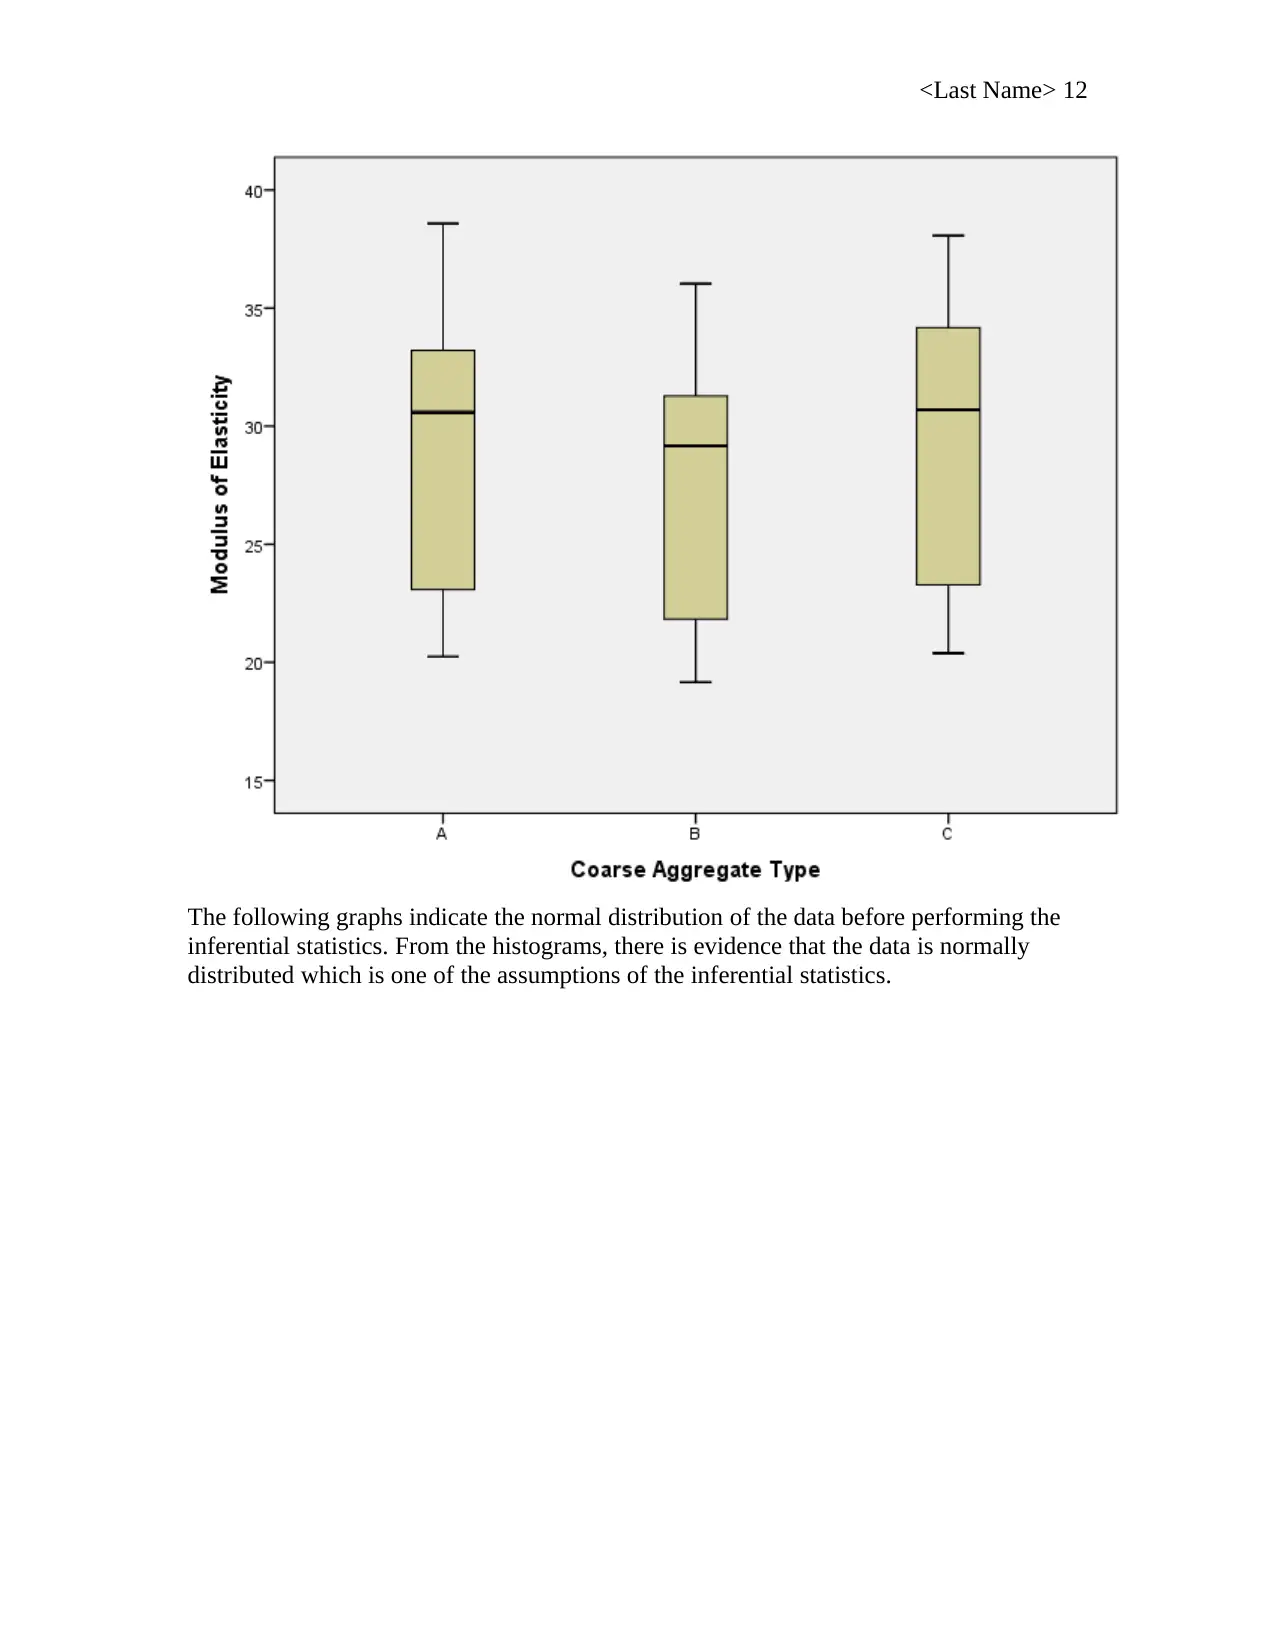
Finally, the boxplot below indicates that there are no outliers for the data showing the
mean difference of the Modulus of Elasticity for the Coarse Aggregate Types thus the
ANOVA test is conducted with the data the way it is.
Finally, the boxplot below indicates that there are no outliers for the data showing the
mean difference of the Modulus of Elasticity for the Coarse Aggregate Types thus the
ANOVA test is conducted with the data the way it is.
<Last Name> 12
The following graphs indicate the normal distribution of the data before performing the
inferential statistics. From the histograms, there is evidence that the data is normally
distributed which is one of the assumptions of the inferential statistics.
The following graphs indicate the normal distribution of the data before performing the
inferential statistics. From the histograms, there is evidence that the data is normally
distributed which is one of the assumptions of the inferential statistics.
⊘ This is a preview!⊘
Do you want full access?
Subscribe today to unlock all pages.
Trusted by 1+ million students worldwide
1 out of 27
Related Documents


Your All-in-One AI-Powered Toolkit for Academic Success.
+13062052269
info@desklib.com
Available 24*7 on WhatsApp / Email
![[object Object]](/_next/static/media/star-bottom.7253800d.svg)
Unlock your academic potential
Copyright © 2020–2026 A2Z Services. All Rights Reserved. Developed and managed by ZUCOL.