Concrete Sample Analysis Report: SEEM511, Term 1, 2019/2020
VerifiedAdded on 2022/09/01
|21
|5197
|31
Report
AI Summary
This report presents a statistical analysis of 380 concrete samples, focusing on the relationship between various parameters and concrete properties. The study investigates the influence of factors such as curing type, plasticizer use, fine and coarse aggregate types, water/binder ratio, and curing age on concrete properties including compressive strength, bulk density, initial modulus of elasticity, and water absorption. The analysis utilizes the Statistical Package for Social Sciences (SPSS) to perform descriptive and inferential statistics, including t-tests and ANOVA, to identify significant relationships between these parameters and the resulting concrete characteristics. The report includes a literature review on concrete properties and the impact of various materials, along with detailed descriptive statistics, frequency distributions, and inferential statistical results. The findings aim to provide insights into optimizing concrete properties for improved durability and strength.
Engineering Computational Methods
Student Name:
Instructor Name:
Course Number:
30th December 2019
Student Name:
Instructor Name:
Course Number:
30th December 2019
Paraphrase This Document
Need a fresh take? Get an instant paraphrase of this document with our AI Paraphraser
Introduction
There has been a rise in the consumption of concretes over the past years. The number of
concrete user is estimated to be more than 2.5 billion with the use of virgin materials being
considered to have negative effect on the environment (Aly, et al., 2012). The properties of a
good concrete are determined by factors such as compressive strength, bulk density, water
absorption and initial modulus of elasticity (Wongpa, et al., 2010). Optimizing the above-
mentioned properties is expected to result in high quality of concrete that are durable and of great
strength (Temuujin, et al., 2009).
Therefore, studying, identifying and analyzing parameters (Plasticizer, Curing Type,
coarse Aggregate, Fine, curing age and water/binder ratio) that influences these properties should
be taken in consideration. This study sought to identify the relationship between the different
parameters (Plasticizer, Curing Type, coarse Aggregate, Fine, curing age and water/binder ratio)
and the concrete properties (compressive strength, bulk density, water absorption and initial
modulus of elasticity).
The investigation focusses on how different parameters affects the different properties of
the concrete. Analysis is done using Statistical Package for Social Sciences (SPSS) where both
descriptive and inferential statistics is used to unravel the relationship that exists between the
different parameters and the concrete properties. Some of the inferential statistics applied in this
study include; Independent samples t-test and analysis of variance (one-way ANOVA).
Literature Review
General
Concrete can be defined as a strong mass made from a solidifying medium, with the
ingredients being composed of sand, gravel, cement and water. The use of concrete as a building
material has be ongoing for close to 200 years. Its prosperity and ubiquity might be generally
ascribed to:
i. Toughness under threatening conditions
ii. Simplicity with which it very well may be thrown into an assortment of shapes and size
iii. Its easy availability and relative economy.
Concrete is strikingly solid in pressure however it is similarly powerless in strain.
Henceforth, the utilization of plain concrete as a basic material is constrained to circumstances
where noteworthy pliable burdens and strains do not develop (Mustafa, et al., 2011).
High Performance Concrete (HPC) is made with painstakingly chosen top-notch fixings
and improved blend structures. These are grouped, blended, set, compacted and restored to the
most elevated industry measures. Normally, such cements will have a high cement-water ratio of
0.55 to 0.80. Superplasticizers are generally used to make these solid. Nonetheless, quality isn't
generally the essential required property. For instance, an ordinary quality cement with
extremely high sturdiness and exceptionally low porousness is considered to have elite properties
(Xu, et al., 2010).
Raw Materials and Proportions of HPC
⊘ This is a preview!⊘
Do you want full access?
Subscribe today to unlock all pages.
Trusted by 1+ million students worldwide
This section presents the different materials and their properties as well as the ratios for
obtaining high performance concrete.
Superplasticizer
According to ASTM494, Superplastisizers (SP) are alluded to "as high range water
diminishing admixture which for the most part scatters the water in solid lattice. Three
significant gatherings of Superplastisizers are as per the following: Sulphonated Melamine
Formaldehyde Condense (SMF), Sulphonated Nephthalene Formaldehyde Condense (SNF) and
Modified Lignosulphonates (MLS).The principle reason for utilizing Superplasticizing
admixtures is to lessen the water cement of a blend plan which upgrade solidness of cement. By
utilizing Superplastisizers, we can have flowable solid sort which can be put in hard and blocked
support region (Alnejaili, 2015). A few impacts of Superplastisizers on properties of cement are
as per the following:
Reduction in interfacial strain.
Multilayered adsorption of Organic particle.
Release of water caught among the concrete particles.
Retarding impact of concrete hydration.
Change in morphology of hydrated concrete
A study by (Kim, et al., 2010) considered the adsorption conduct of Sulfonated melamine
formaldehyde (SNF) in concrete for various introductory focus and revealed that its fixation
decline quickly in the initial five minutes after its expansion in to all concrete slurries. In the vast
majority of the cases its fixation arrives at a steady worth when adsorption time is more
prominent than 10 min and proposes a connection between the SNF adsorption conduct on
Paraphrase This Document
Need a fresh take? Get an instant paraphrase of this document with our AI Paraphraser
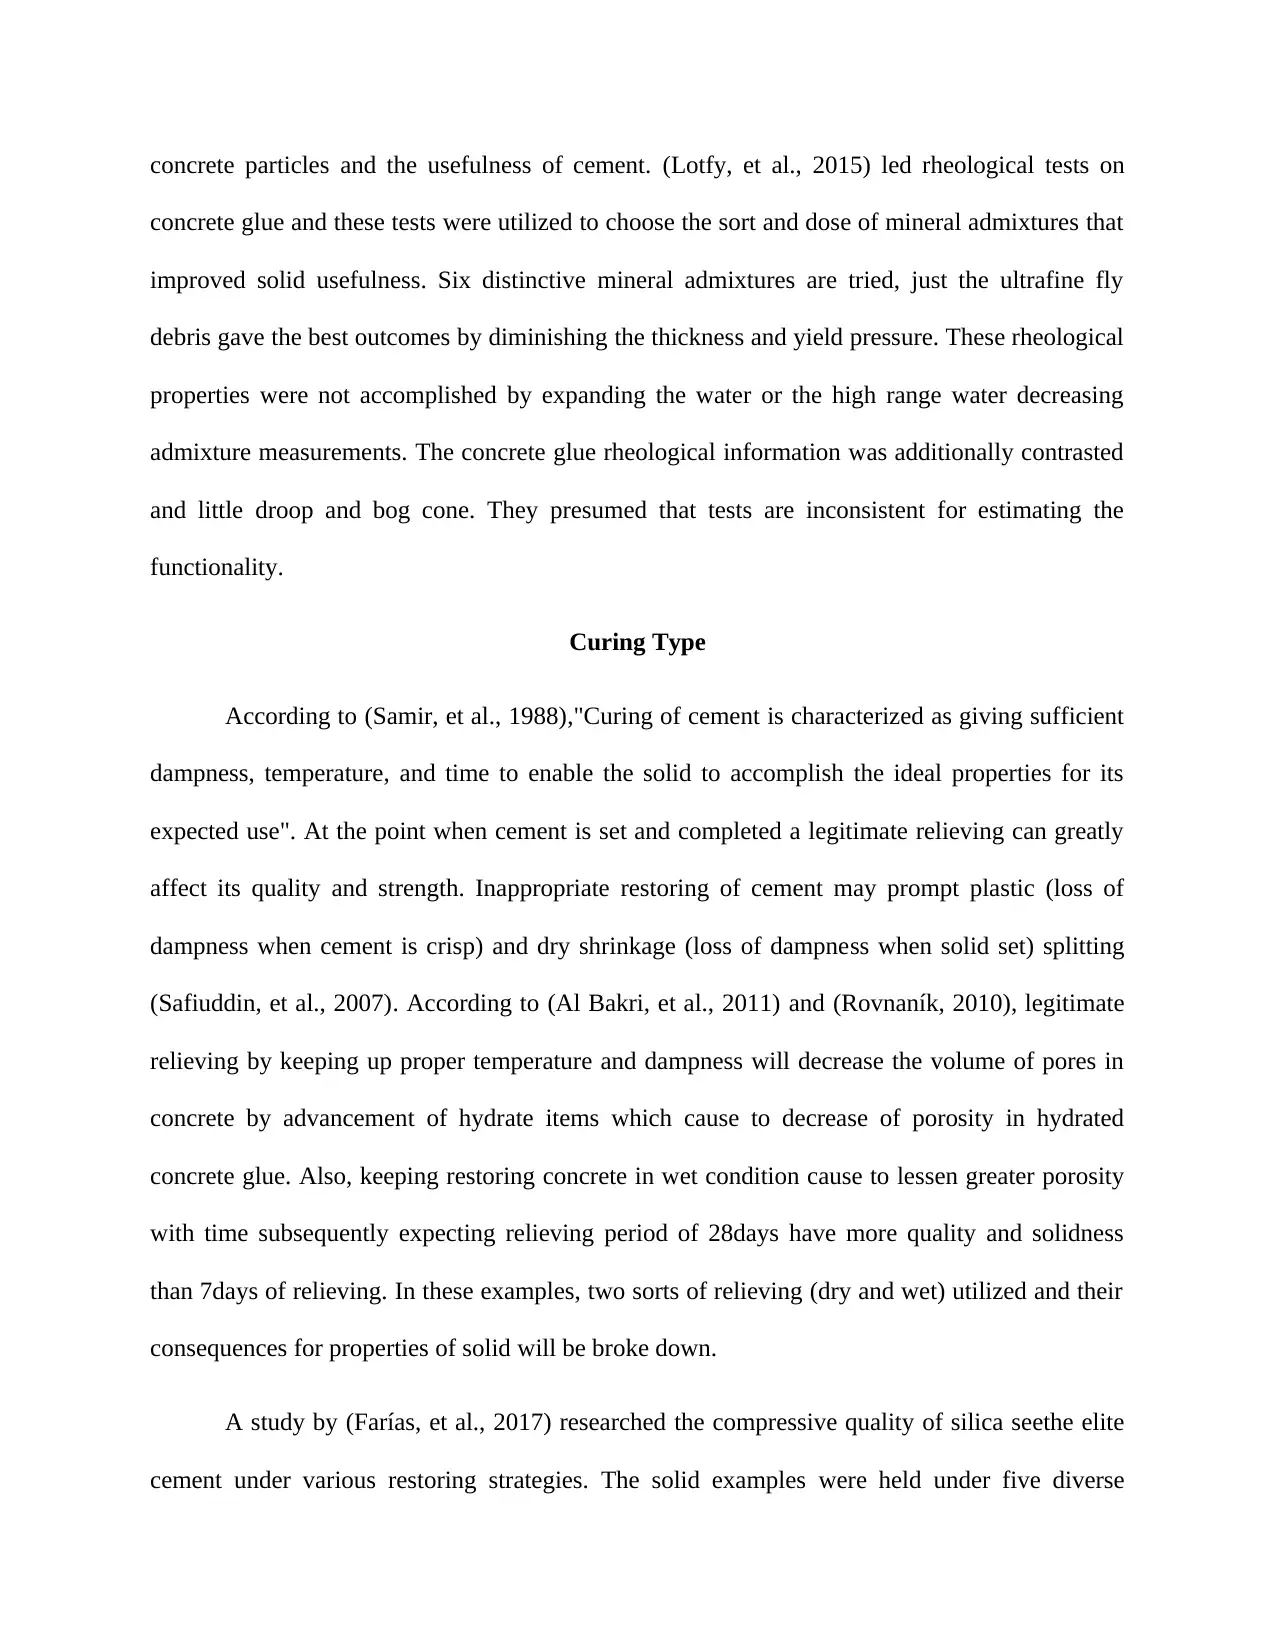
concrete particles and the usefulness of cement. (Lotfy, et al., 2015) led rheological tests on
concrete glue and these tests were utilized to choose the sort and dose of mineral admixtures that
improved solid usefulness. Six distinctive mineral admixtures are tried, just the ultrafine fly
debris gave the best outcomes by diminishing the thickness and yield pressure. These rheological
properties were not accomplished by expanding the water or the high range water decreasing
admixture measurements. The concrete glue rheological information was additionally contrasted
and little droop and bog cone. They presumed that tests are inconsistent for estimating the
functionality.
Curing Type
According to (Samir, et al., 1988),"Curing of cement is characterized as giving sufficient
dampness, temperature, and time to enable the solid to accomplish the ideal properties for its
expected use". At the point when cement is set and completed a legitimate relieving can greatly
affect its quality and strength. Inappropriate restoring of cement may prompt plastic (loss of
dampness when cement is crisp) and dry shrinkage (loss of dampness when solid set) splitting
(Safiuddin, et al., 2007). According to (Al Bakri, et al., 2011) and (Rovnaník, 2010), legitimate
relieving by keeping up proper temperature and dampness will decrease the volume of pores in
concrete by advancement of hydrate items which cause to decrease of porosity in hydrated
concrete glue. Also, keeping restoring concrete in wet condition cause to lessen greater porosity
with time subsequently expecting relieving period of 28days have more quality and solidness
than 7days of relieving. In these examples, two sorts of relieving (dry and wet) utilized and their
consequences for properties of solid will be broke down.
A study by (Farías, et al., 2017) researched the compressive quality of silica seethe elite
cement under various restoring strategies. The solid examples were held under five diverse
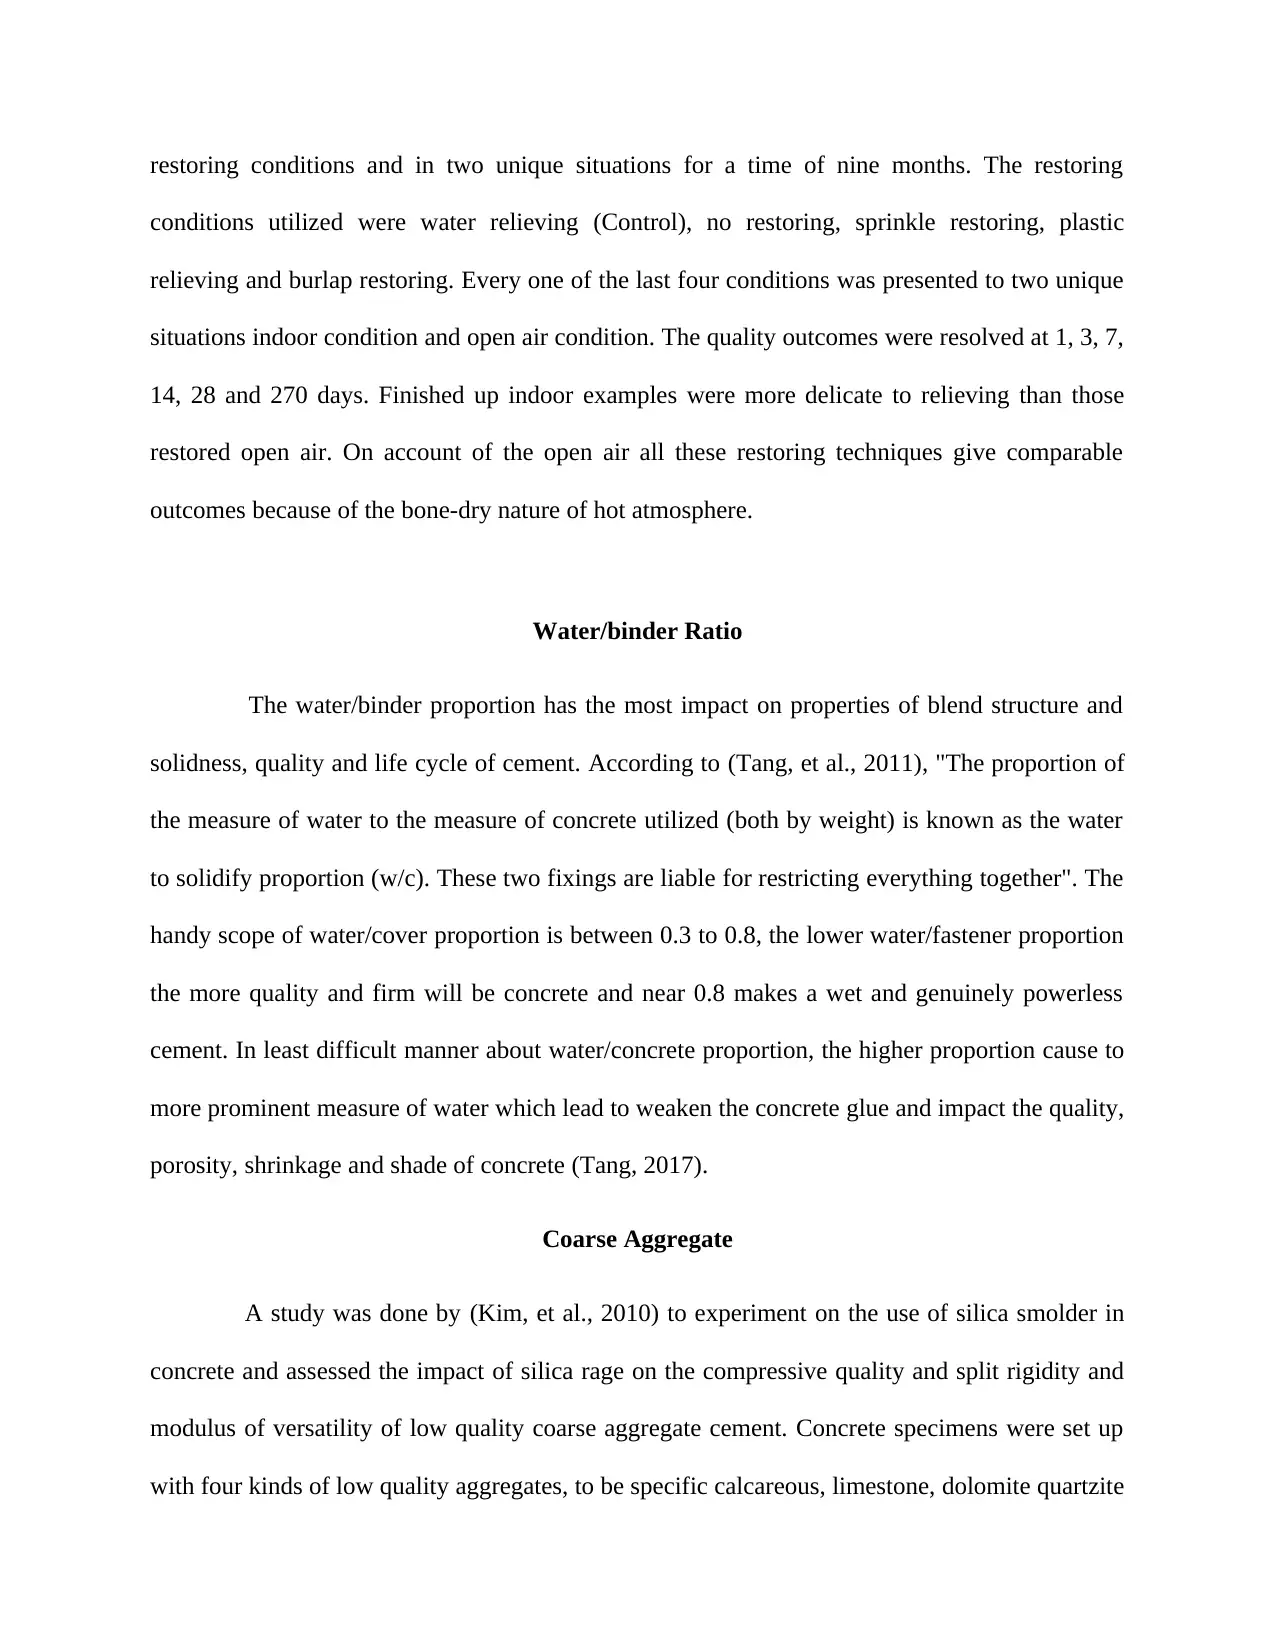
restoring conditions and in two unique situations for a time of nine months. The restoring
conditions utilized were water relieving (Control), no restoring, sprinkle restoring, plastic
relieving and burlap restoring. Every one of the last four conditions was presented to two unique
situations indoor condition and open air condition. The quality outcomes were resolved at 1, 3, 7,
14, 28 and 270 days. Finished up indoor examples were more delicate to relieving than those
restored open air. On account of the open air all these restoring techniques give comparable
outcomes because of the bone-dry nature of hot atmosphere.
Water/binder Ratio
The water/binder proportion has the most impact on properties of blend structure and
solidness, quality and life cycle of cement. According to (Tang, et al., 2011), "The proportion of
the measure of water to the measure of concrete utilized (both by weight) is known as the water
to solidify proportion (w/c). These two fixings are liable for restricting everything together". The
handy scope of water/cover proportion is between 0.3 to 0.8, the lower water/fastener proportion
the more quality and firm will be concrete and near 0.8 makes a wet and genuinely powerless
cement. In least difficult manner about water/concrete proportion, the higher proportion cause to
more prominent measure of water which lead to weaken the concrete glue and impact the quality,
porosity, shrinkage and shade of concrete (Tang, 2017).
Coarse Aggregate
A study was done by (Kim, et al., 2010) to experiment on the use of silica smolder in
concrete and assessed the impact of silica rage on the compressive quality and split rigidity and
modulus of versatility of low quality coarse aggregate cement. Concrete specimens were set up
with four kinds of low quality aggregates, to be specific calcareous, limestone, dolomite quartzite
⊘ This is a preview!⊘
Do you want full access?
Subscribe today to unlock all pages.
Trusted by 1+ million students worldwide
and steel slag. Results demonstrated that, coarse aggregate type impacted the compressive
quality, split rigidity and modulus of versatility of both plain and silica seethe concrete cements
and inferred that fuse of silica smolder upgraded the compressive quality and split elasticity of
cement, particularly that of the low quality limestone total.
Fine Aggregate (sand) Type
A study done by (Rovnaník, 2010) researched the impact of fineness modulus of fine
aggregate on elite cement. The properties of the 6 blends were explored including slump flow,
slump, unit weight and compressive quality, static modulus of flexibility, splitting tensile and
poison's proportion. Fine aggregate with fineness modulus in the scope of 2.18 and 3.24 was
found not to significantly modulus of elasticity and compressive quality.
Curing age
According to (Tang, 2017), curing age has significant effect on the quality of the
concrete. In their study of investigating how the curing age affects the strength of the concrete,
the authors established the curing age affects the strength of the concrete.
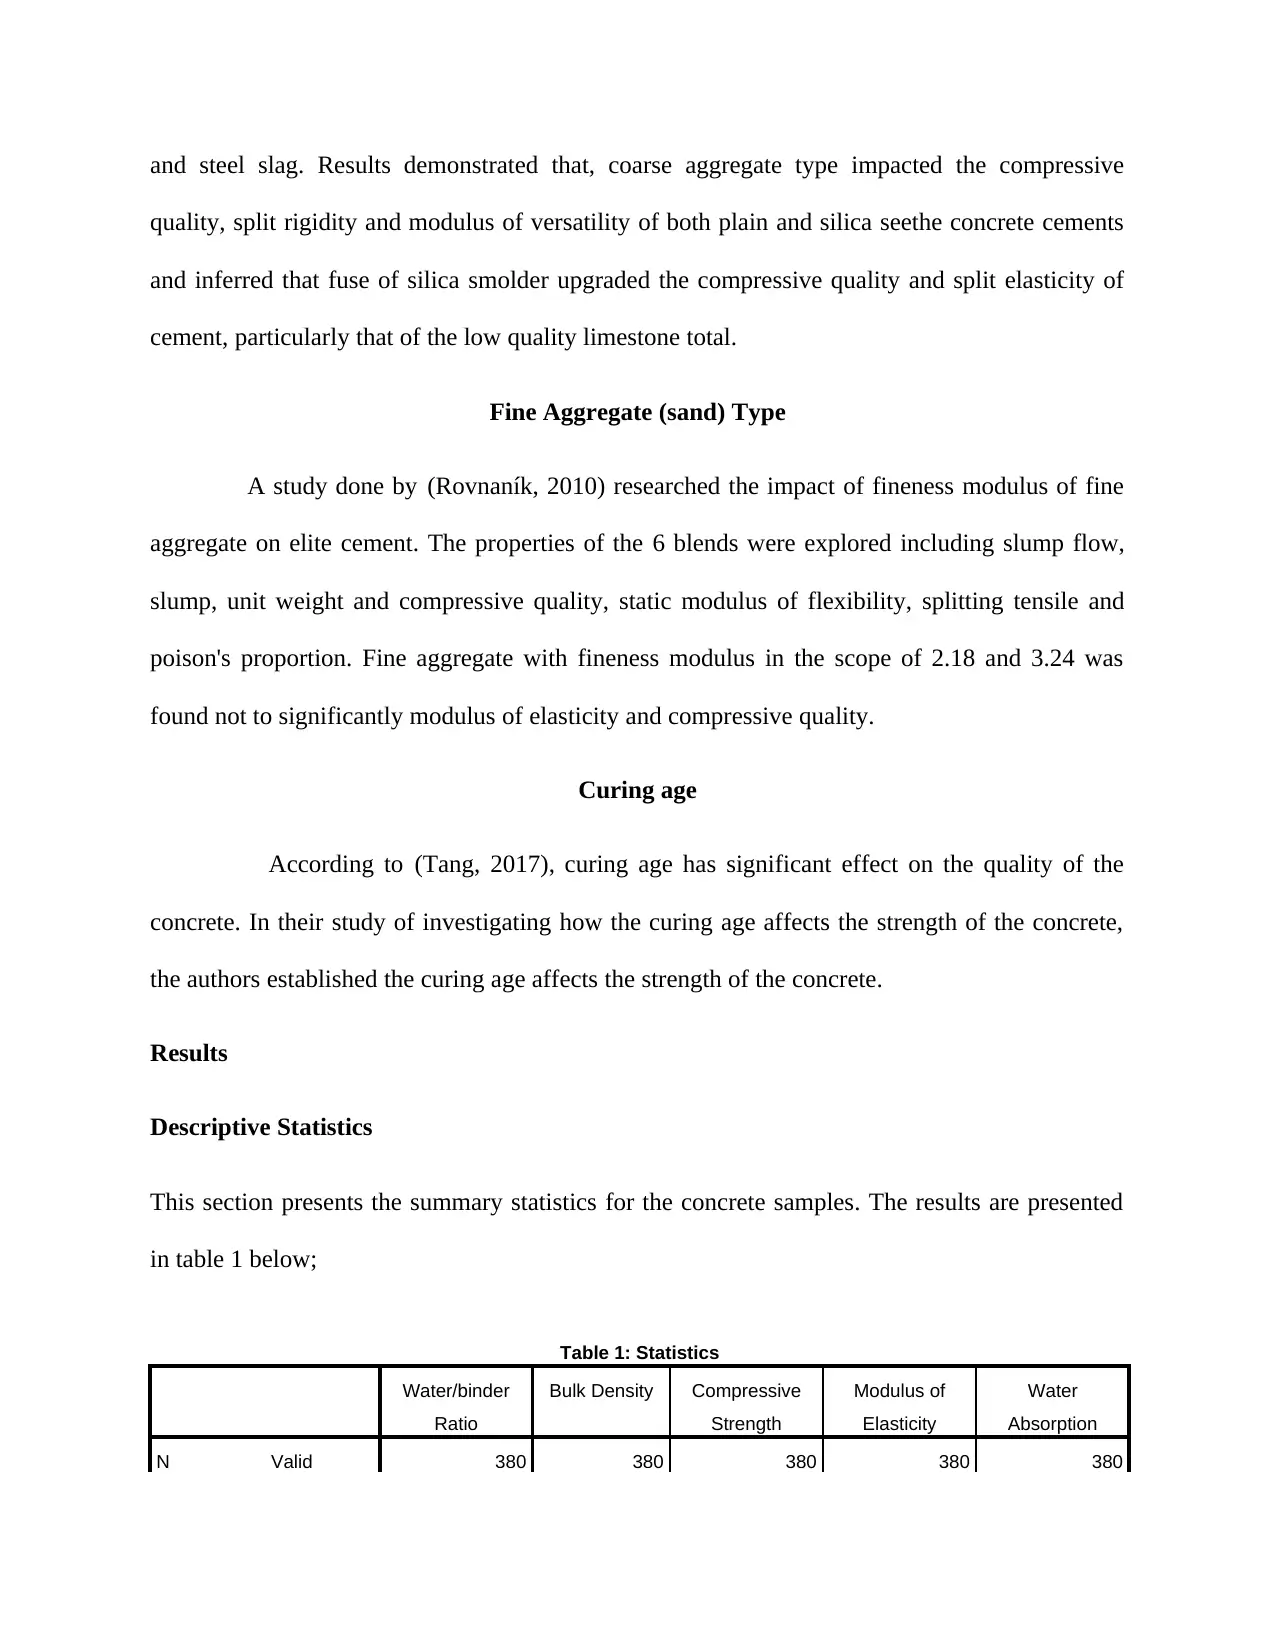
Results
Descriptive Statistics
This section presents the summary statistics for the concrete samples. The results are presented
in table 1 below;
Table 1: Statistics
Water/binder
Ratio
Bulk Density Compressive
Strength
Modulus of
Elasticity
Water
Absorption
N Valid 380 380 380 380 380
quality, split rigidity and modulus of versatility of both plain and silica seethe concrete cements
and inferred that fuse of silica smolder upgraded the compressive quality and split elasticity of
cement, particularly that of the low quality limestone total.
Fine Aggregate (sand) Type
A study done by (Rovnaník, 2010) researched the impact of fineness modulus of fine
aggregate on elite cement. The properties of the 6 blends were explored including slump flow,
slump, unit weight and compressive quality, static modulus of flexibility, splitting tensile and
poison's proportion. Fine aggregate with fineness modulus in the scope of 2.18 and 3.24 was
found not to significantly modulus of elasticity and compressive quality.
Curing age
According to (Tang, 2017), curing age has significant effect on the quality of the
concrete. In their study of investigating how the curing age affects the strength of the concrete,
the authors established the curing age affects the strength of the concrete.
Results
Descriptive Statistics
This section presents the summary statistics for the concrete samples. The results are presented
in table 1 below;
Table 1: Statistics
Water/binder
Ratio
Bulk Density Compressive
Strength
Modulus of
Elasticity
Water
Absorption
N Valid 380 380 380 380 380
Paraphrase This Document
Need a fresh take? Get an instant paraphrase of this document with our AI Paraphraser
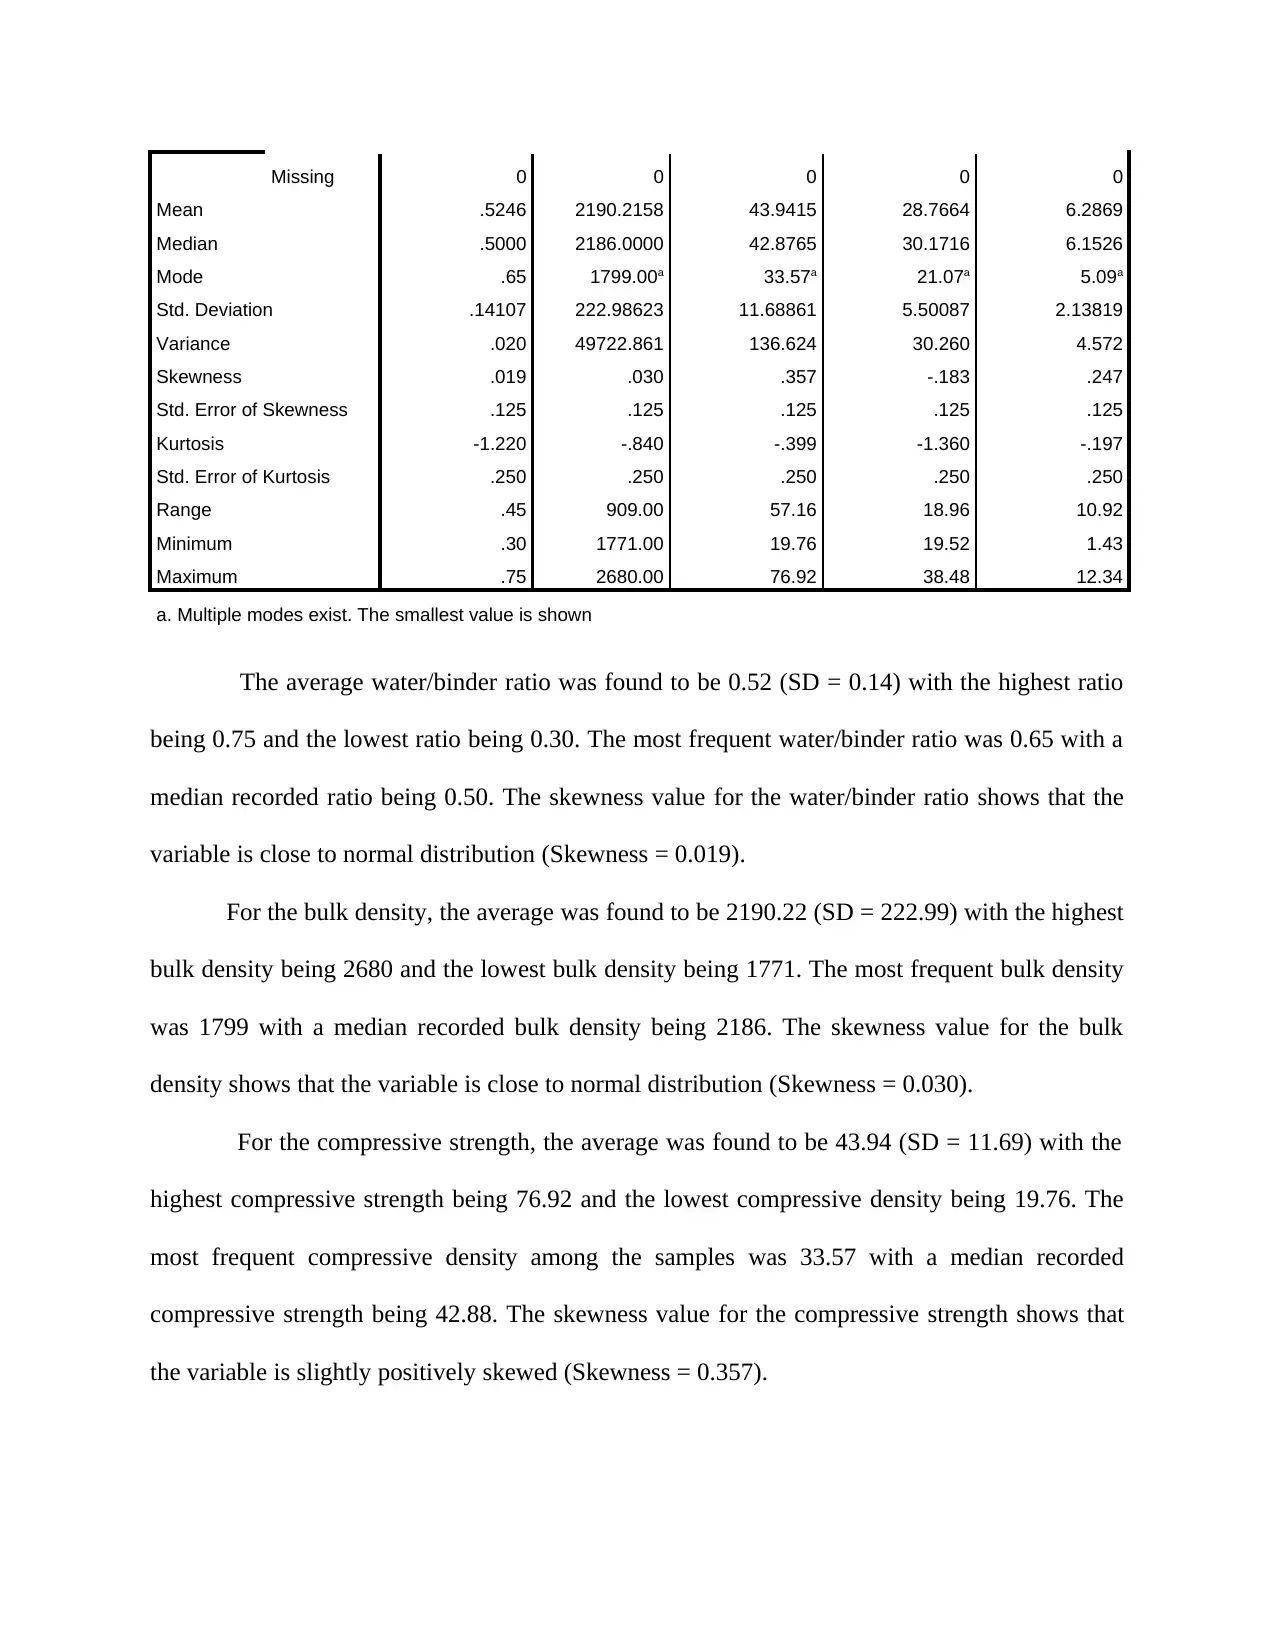
Missing 0 0 0 0 0
Mean .5246 2190.2158 43.9415 28.7664 6.2869
Median .5000 2186.0000 42.8765 30.1716 6.1526
Mode .65 1799.00a 33.57a 21.07a 5.09a
Std. Deviation .14107 222.98623 11.68861 5.50087 2.13819
Variance .020 49722.861 136.624 30.260 4.572
Skewness .019 .030 .357 -.183 .247
Std. Error of Skewness .125 .125 .125 .125 .125
Kurtosis -1.220 -.840 -.399 -1.360 -.197
Std. Error of Kurtosis .250 .250 .250 .250 .250
Range .45 909.00 57.16 18.96 10.92
Minimum .30 1771.00 19.76 19.52 1.43
Maximum .75 2680.00 76.92 38.48 12.34
a. Multiple modes exist. The smallest value is shown
The average water/binder ratio was found to be 0.52 (SD = 0.14) with the highest ratio
being 0.75 and the lowest ratio being 0.30. The most frequent water/binder ratio was 0.65 with a
median recorded ratio being 0.50. The skewness value for the water/binder ratio shows that the
variable is close to normal distribution (Skewness = 0.019).
For the bulk density, the average was found to be 2190.22 (SD = 222.99) with the highest
bulk density being 2680 and the lowest bulk density being 1771. The most frequent bulk density
was 1799 with a median recorded bulk density being 2186. The skewness value for the bulk
density shows that the variable is close to normal distribution (Skewness = 0.030).
For the compressive strength, the average was found to be 43.94 (SD = 11.69) with the
highest compressive strength being 76.92 and the lowest compressive density being 19.76. The
most frequent compressive density among the samples was 33.57 with a median recorded
compressive strength being 42.88. The skewness value for the compressive strength shows that
the variable is slightly positively skewed (Skewness = 0.357).
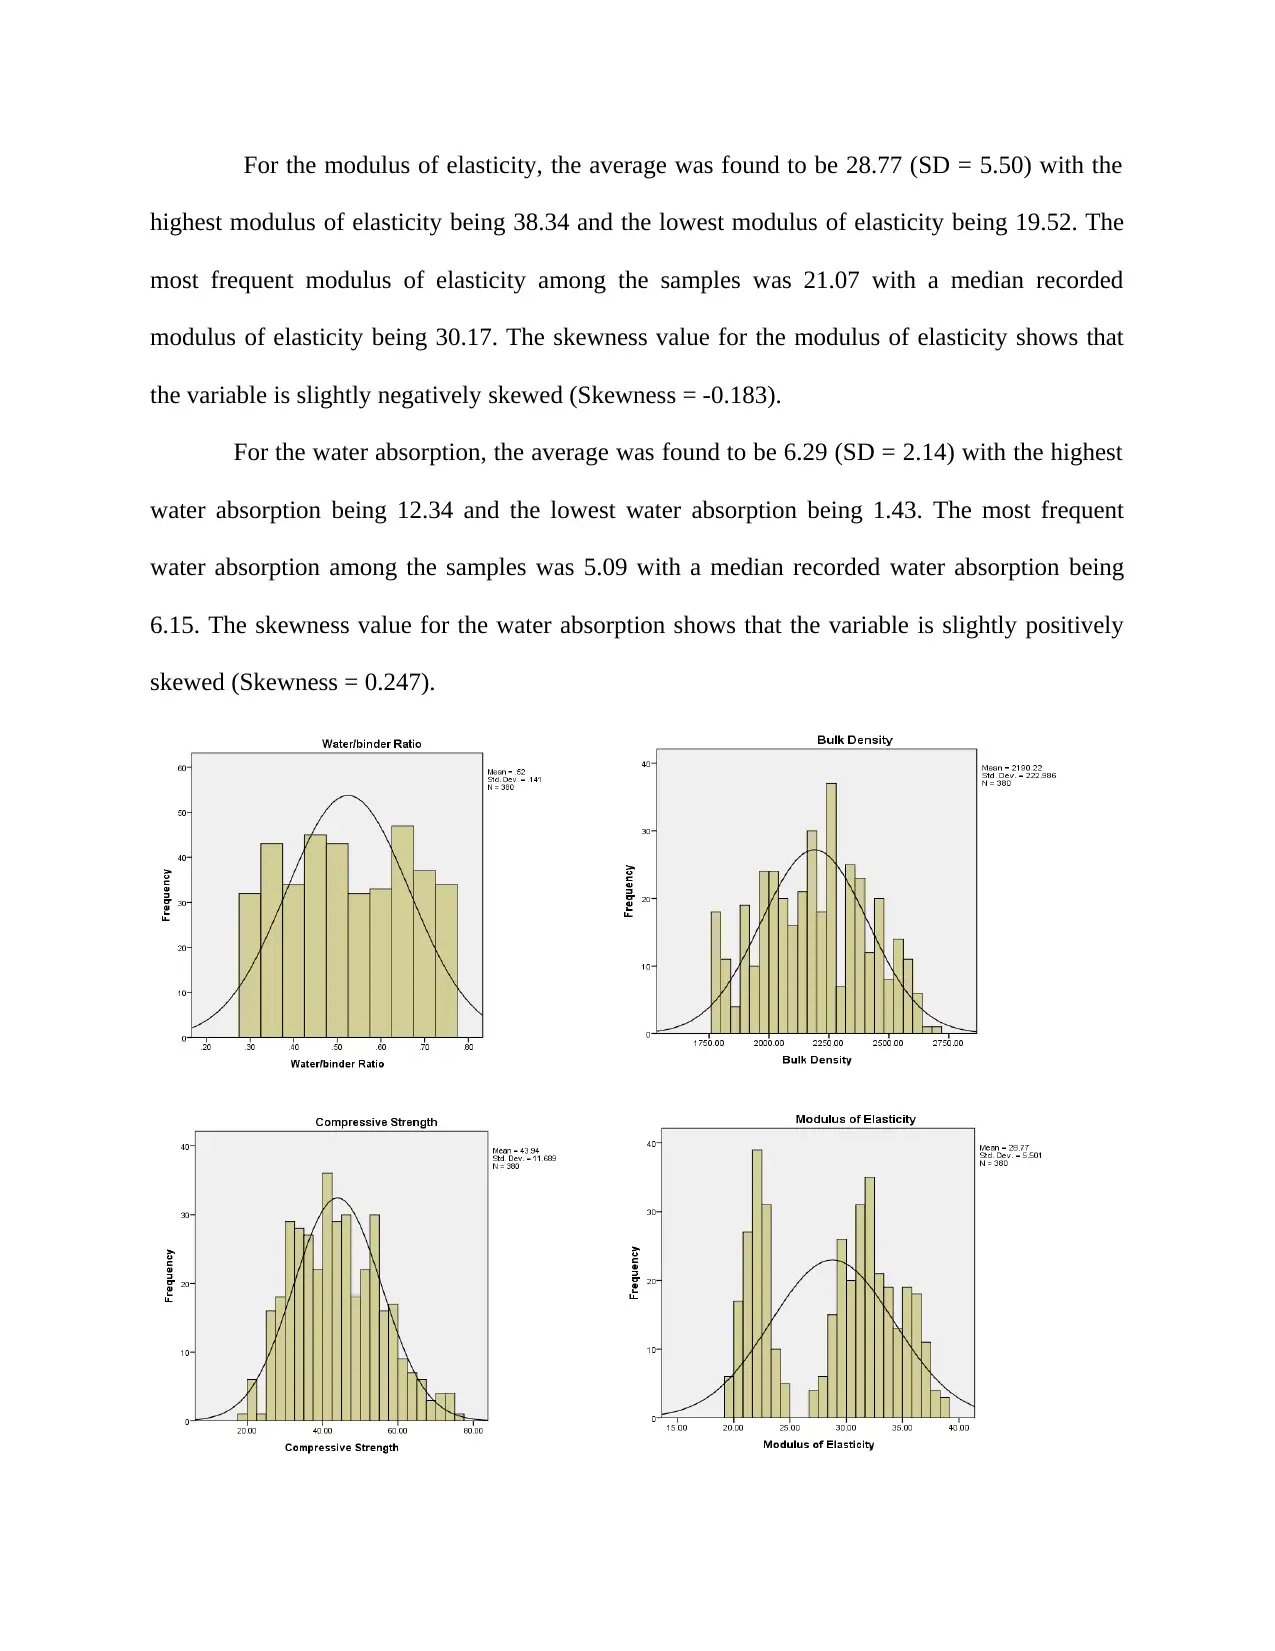
For the modulus of elasticity, the average was found to be 28.77 (SD = 5.50) with the
highest modulus of elasticity being 38.34 and the lowest modulus of elasticity being 19.52. The
most frequent modulus of elasticity among the samples was 21.07 with a median recorded
modulus of elasticity being 30.17. The skewness value for the modulus of elasticity shows that
the variable is slightly negatively skewed (Skewness = -0.183).
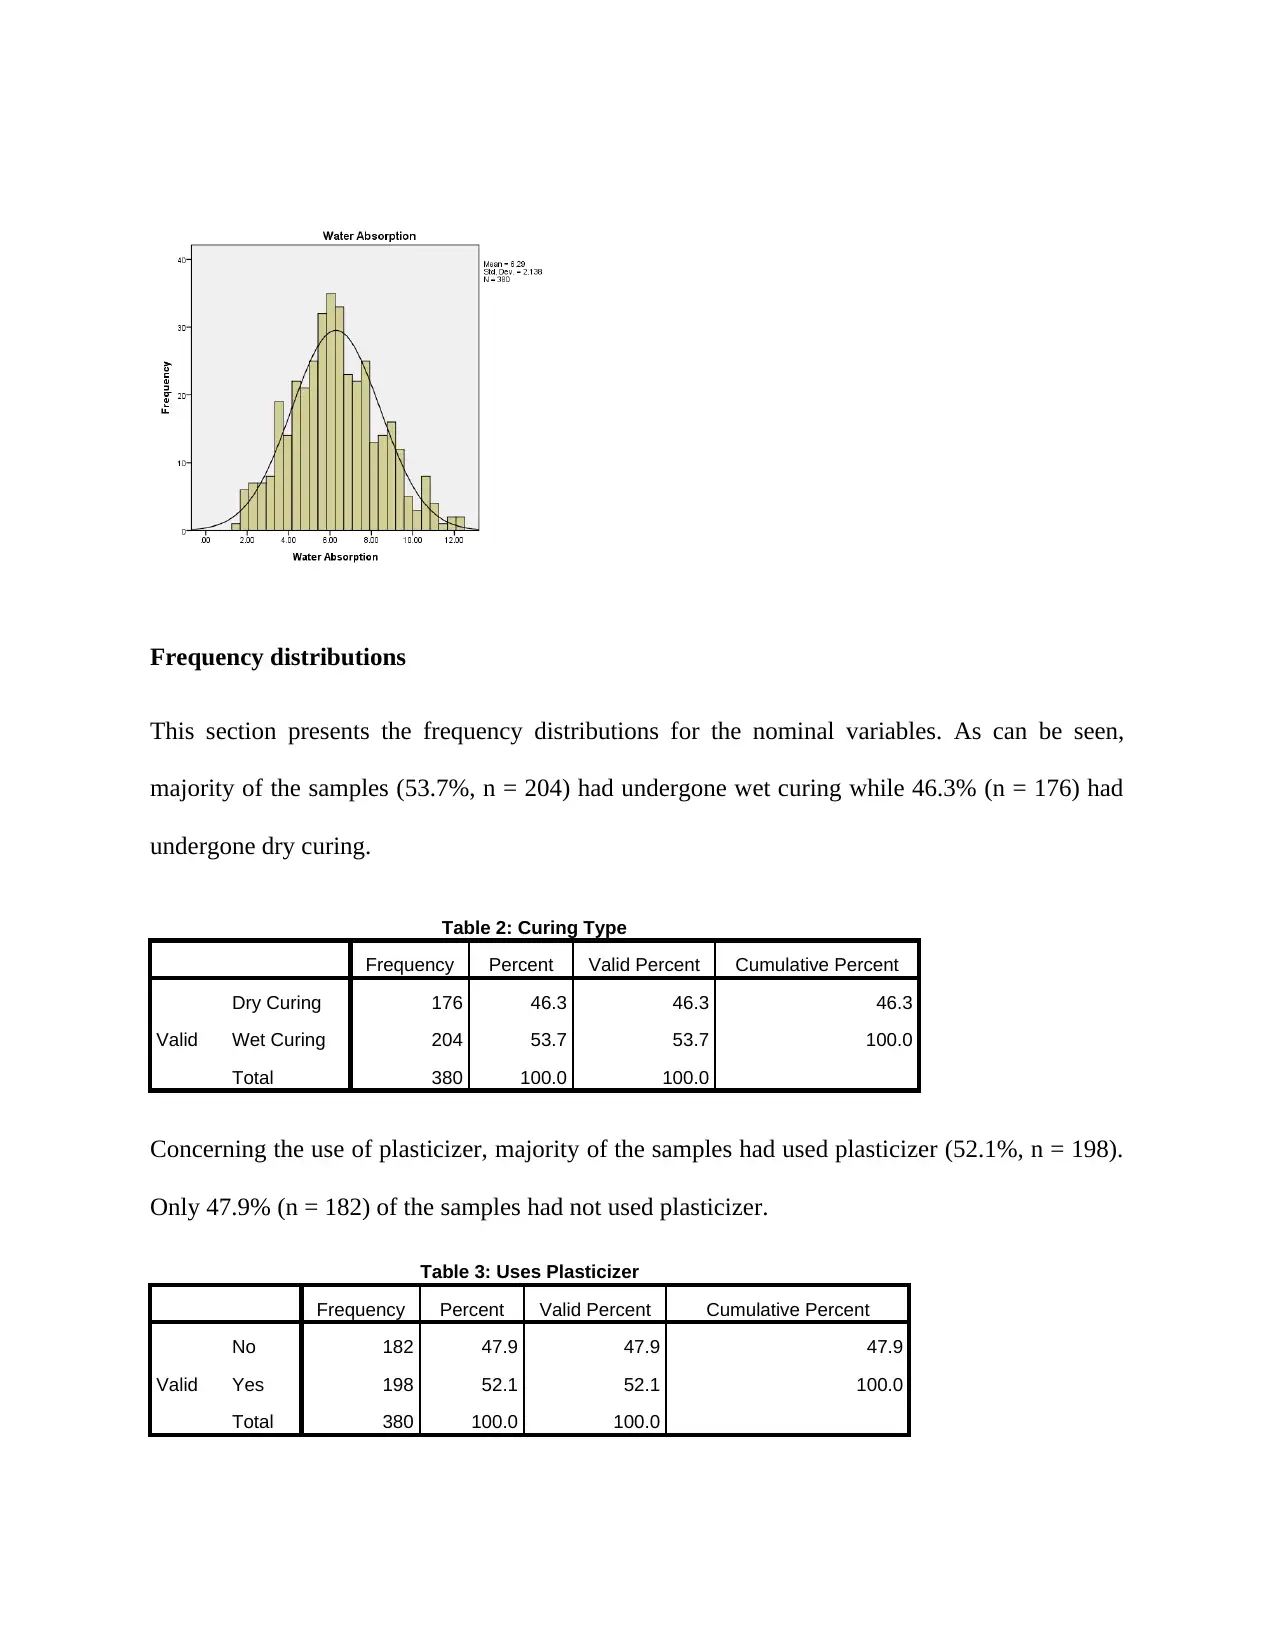
For the water absorption, the average was found to be 6.29 (SD = 2.14) with the highest
water absorption being 12.34 and the lowest water absorption being 1.43. The most frequent
water absorption among the samples was 5.09 with a median recorded water absorption being
6.15. The skewness value for the water absorption shows that the variable is slightly positively
skewed (Skewness = 0.247).
highest modulus of elasticity being 38.34 and the lowest modulus of elasticity being 19.52. The
most frequent modulus of elasticity among the samples was 21.07 with a median recorded
modulus of elasticity being 30.17. The skewness value for the modulus of elasticity shows that
the variable is slightly negatively skewed (Skewness = -0.183).
For the water absorption, the average was found to be 6.29 (SD = 2.14) with the highest
water absorption being 12.34 and the lowest water absorption being 1.43. The most frequent
water absorption among the samples was 5.09 with a median recorded water absorption being
6.15. The skewness value for the water absorption shows that the variable is slightly positively
skewed (Skewness = 0.247).
⊘ This is a preview!⊘
Do you want full access?
Subscribe today to unlock all pages.
Trusted by 1+ million students worldwide
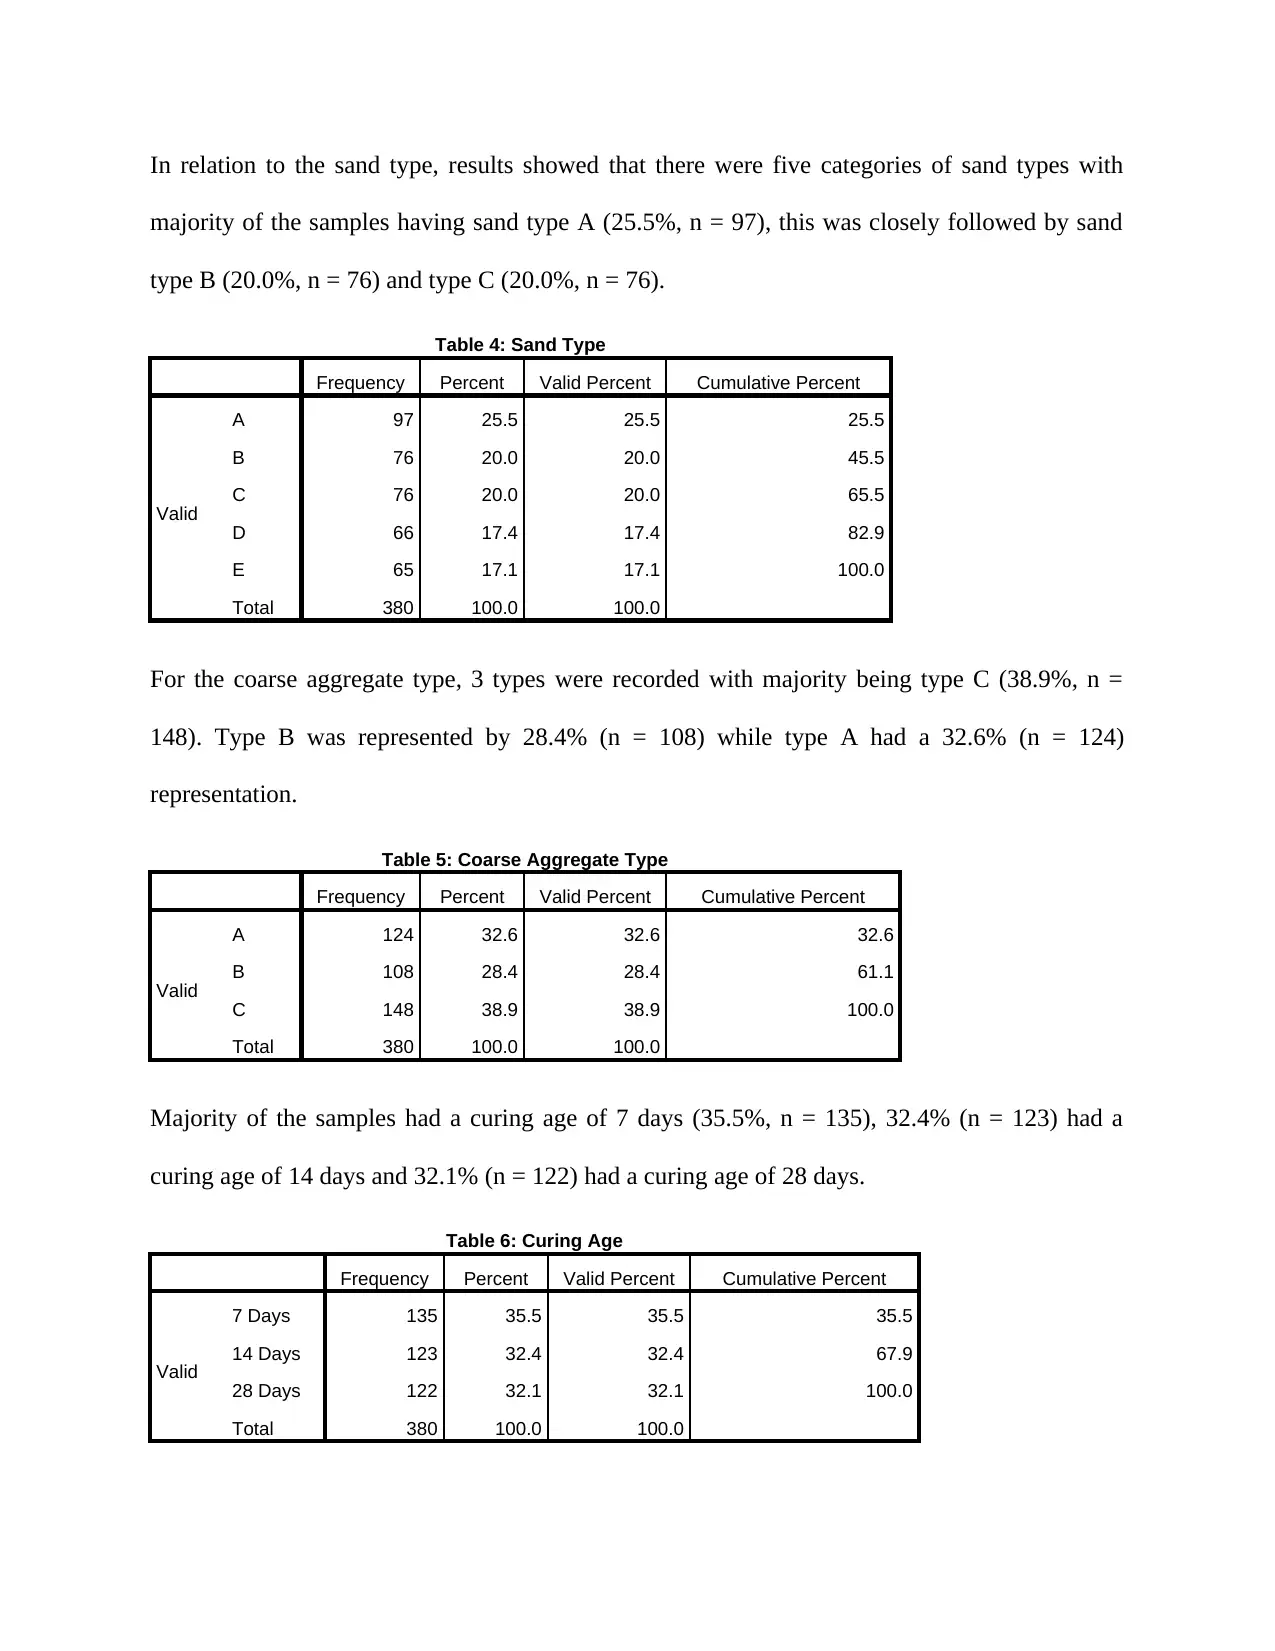
Frequency distributions
This section presents the frequency distributions for the nominal variables. As can be seen,
majority of the samples (53.7%, n = 204) had undergone wet curing while 46.3% (n = 176) had
undergone dry curing.
Table 2: Curing Type
Frequency Percent Valid Percent Cumulative Percent
Valid
Dry Curing 176 46.3 46.3 46.3
Wet Curing 204 53.7 53.7 100.0
Total 380 100.0 100.0
Concerning the use of plasticizer, majority of the samples had used plasticizer (52.1%, n = 198).
Only 47.9% (n = 182) of the samples had not used plasticizer.
Table 3: Uses Plasticizer
Frequency Percent Valid Percent Cumulative Percent
Valid
No 182 47.9 47.9 47.9
Yes 198 52.1 52.1 100.0
Total 380 100.0 100.0
Paraphrase This Document
Need a fresh take? Get an instant paraphrase of this document with our AI Paraphraser
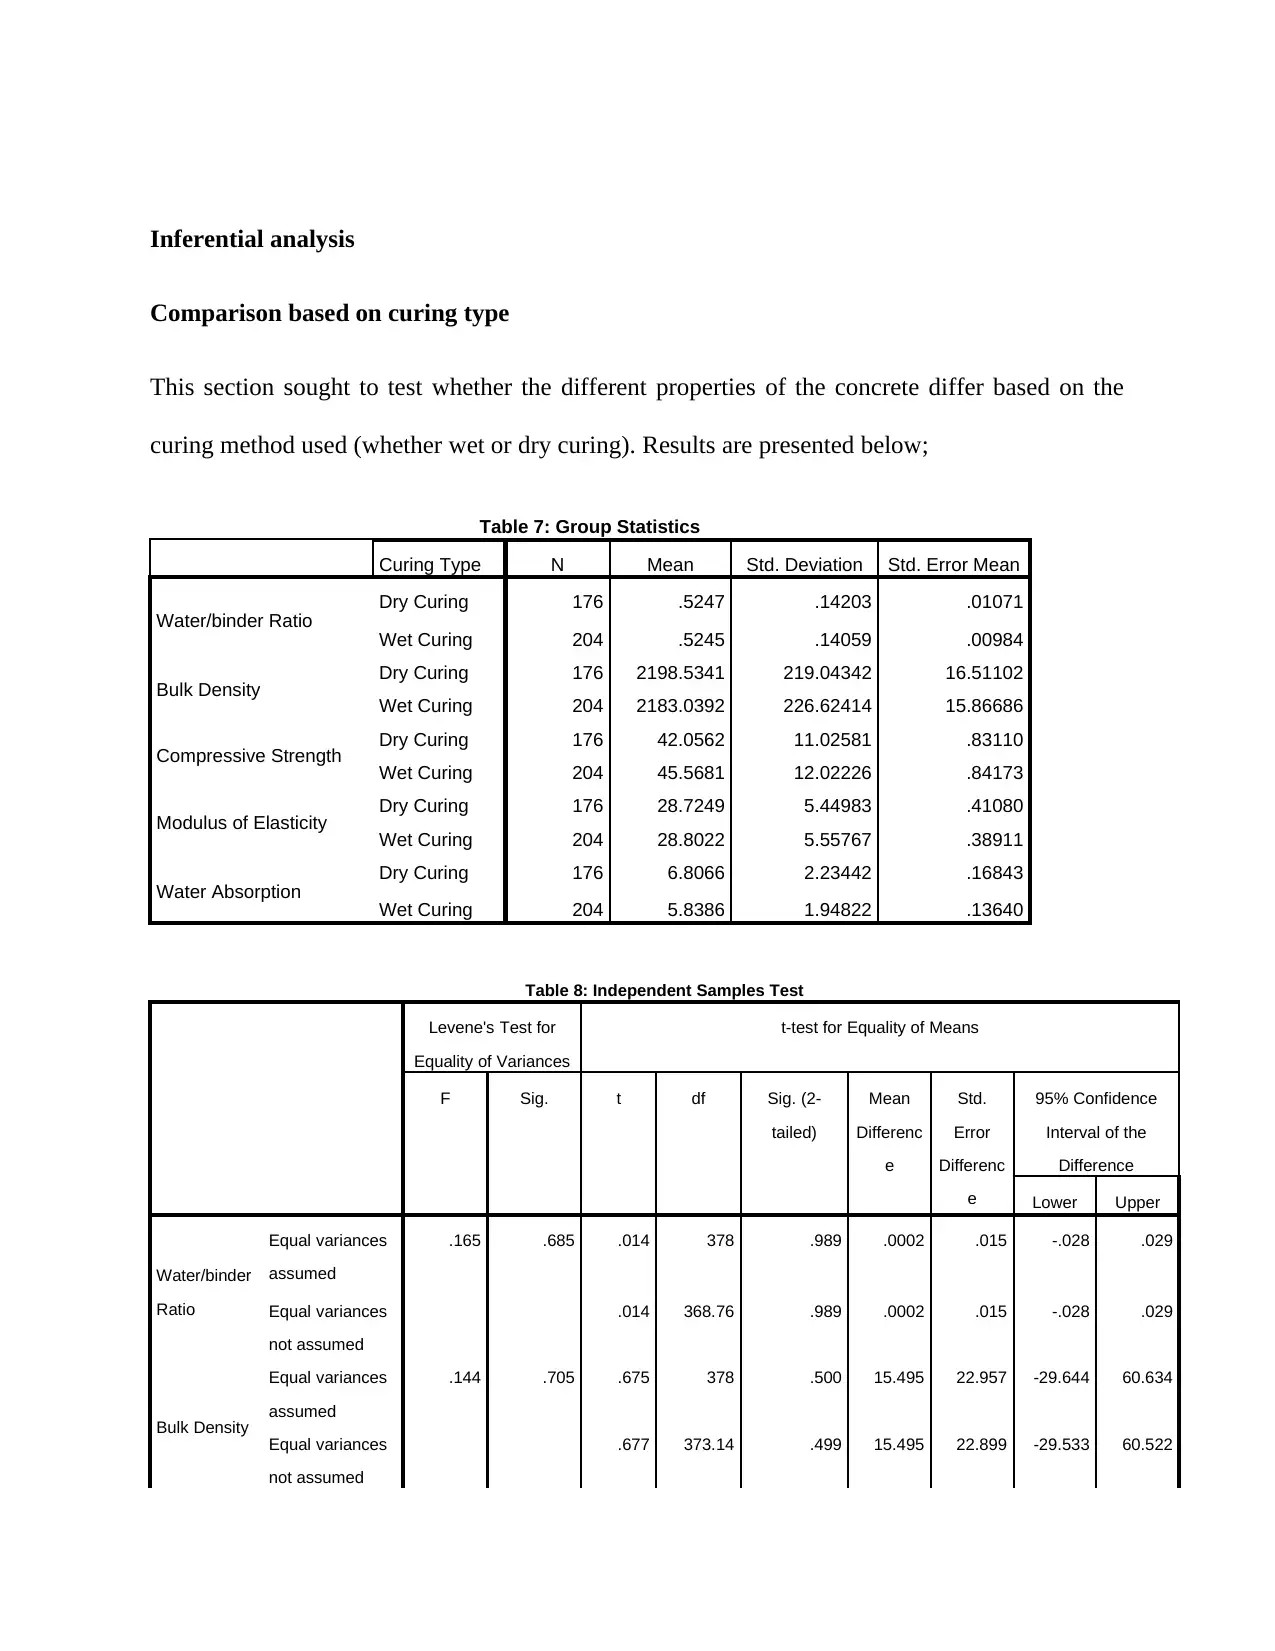
In relation to the sand type, results showed that there were five categories of sand types with
majority of the samples having sand type A (25.5%, n = 97), this was closely followed by sand
type B (20.0%, n = 76) and type C (20.0%, n = 76).
Table 4: Sand Type
Frequency Percent Valid Percent Cumulative Percent
Valid
A 97 25.5 25.5 25.5
B 76 20.0 20.0 45.5
C 76 20.0 20.0 65.5
D 66 17.4 17.4 82.9
E 65 17.1 17.1 100.0
Total 380 100.0 100.0
For the coarse aggregate type, 3 types were recorded with majority being type C (38.9%, n =
148). Type B was represented by 28.4% (n = 108) while type A had a 32.6% (n = 124)
representation.
Table 5: Coarse Aggregate Type
Frequency Percent Valid Percent Cumulative Percent
Valid
A 124 32.6 32.6 32.6
B 108 28.4 28.4 61.1
C 148 38.9 38.9 100.0
Total 380 100.0 100.0
Majority of the samples had a curing age of 7 days (35.5%, n = 135), 32.4% (n = 123) had a
curing age of 14 days and 32.1% (n = 122) had a curing age of 28 days.
Table 6: Curing Age
Frequency Percent Valid Percent Cumulative Percent
Valid
7 Days 135 35.5 35.5 35.5
14 Days 123 32.4 32.4 67.9
28 Days 122 32.1 32.1 100.0
Total 380 100.0 100.0
Inferential analysis
Comparison based on curing type
This section sought to test whether the different properties of the concrete differ based on the
curing method used (whether wet or dry curing). Results are presented below;
Table 7: Group Statistics
Curing Type N Mean Std. Deviation Std. Error Mean
Water/binder Ratio Dry Curing 176 .5247 .14203 .01071
Wet Curing 204 .5245 .14059 .00984
Bulk Density Dry Curing 176 2198.5341 219.04342 16.51102
Wet Curing 204 2183.0392 226.62414 15.86686
Compressive Strength Dry Curing 176 42.0562 11.02581 .83110
Wet Curing 204 45.5681 12.02226 .84173
Modulus of Elasticity Dry Curing 176 28.7249 5.44983 .41080
Wet Curing 204 28.8022 5.55767 .38911
Water Absorption Dry Curing 176 6.8066 2.23442 .16843
Wet Curing 204 5.8386 1.94822 .13640
Table 8: Independent Samples Test
Levene's Test for
Equality of Variances
t-test for Equality of Means
F Sig. t df Sig. (2-
tailed)
Mean
Differenc
e
Std.
Error
Differenc
e
95% Confidence
Interval of the
Difference
Lower Upper
Water/binder
Ratio
Equal variances
assumed
.165 .685 .014 378 .989 .0002 .015 -.028 .029
Equal variances
not assumed
.014 368.76 .989 .0002 .015 -.028 .029
Bulk Density
Equal variances
assumed
.144 .705 .675 378 .500 15.495 22.957 -29.644 60.634
Equal variances
not assumed
.677 373.14 .499 15.495 22.899 -29.533 60.522
⊘ This is a preview!⊘
Do you want full access?
Subscribe today to unlock all pages.
Trusted by 1+ million students worldwide
1 out of 21
Related Documents


Your All-in-One AI-Powered Toolkit for Academic Success.
+13062052269
info@desklib.com
Available 24*7 on WhatsApp / Email
![[object Object]](/_next/static/media/star-bottom.7253800d.svg)
Unlock your academic potential
Copyright © 2020–2026 A2Z Services. All Rights Reserved. Developed and managed by ZUCOL.