Statistics Project: Confidence Intervals - US State Income

Verified

Added on  2022/08/12

|8
|493
|39
Homework Assignment
AI Summary
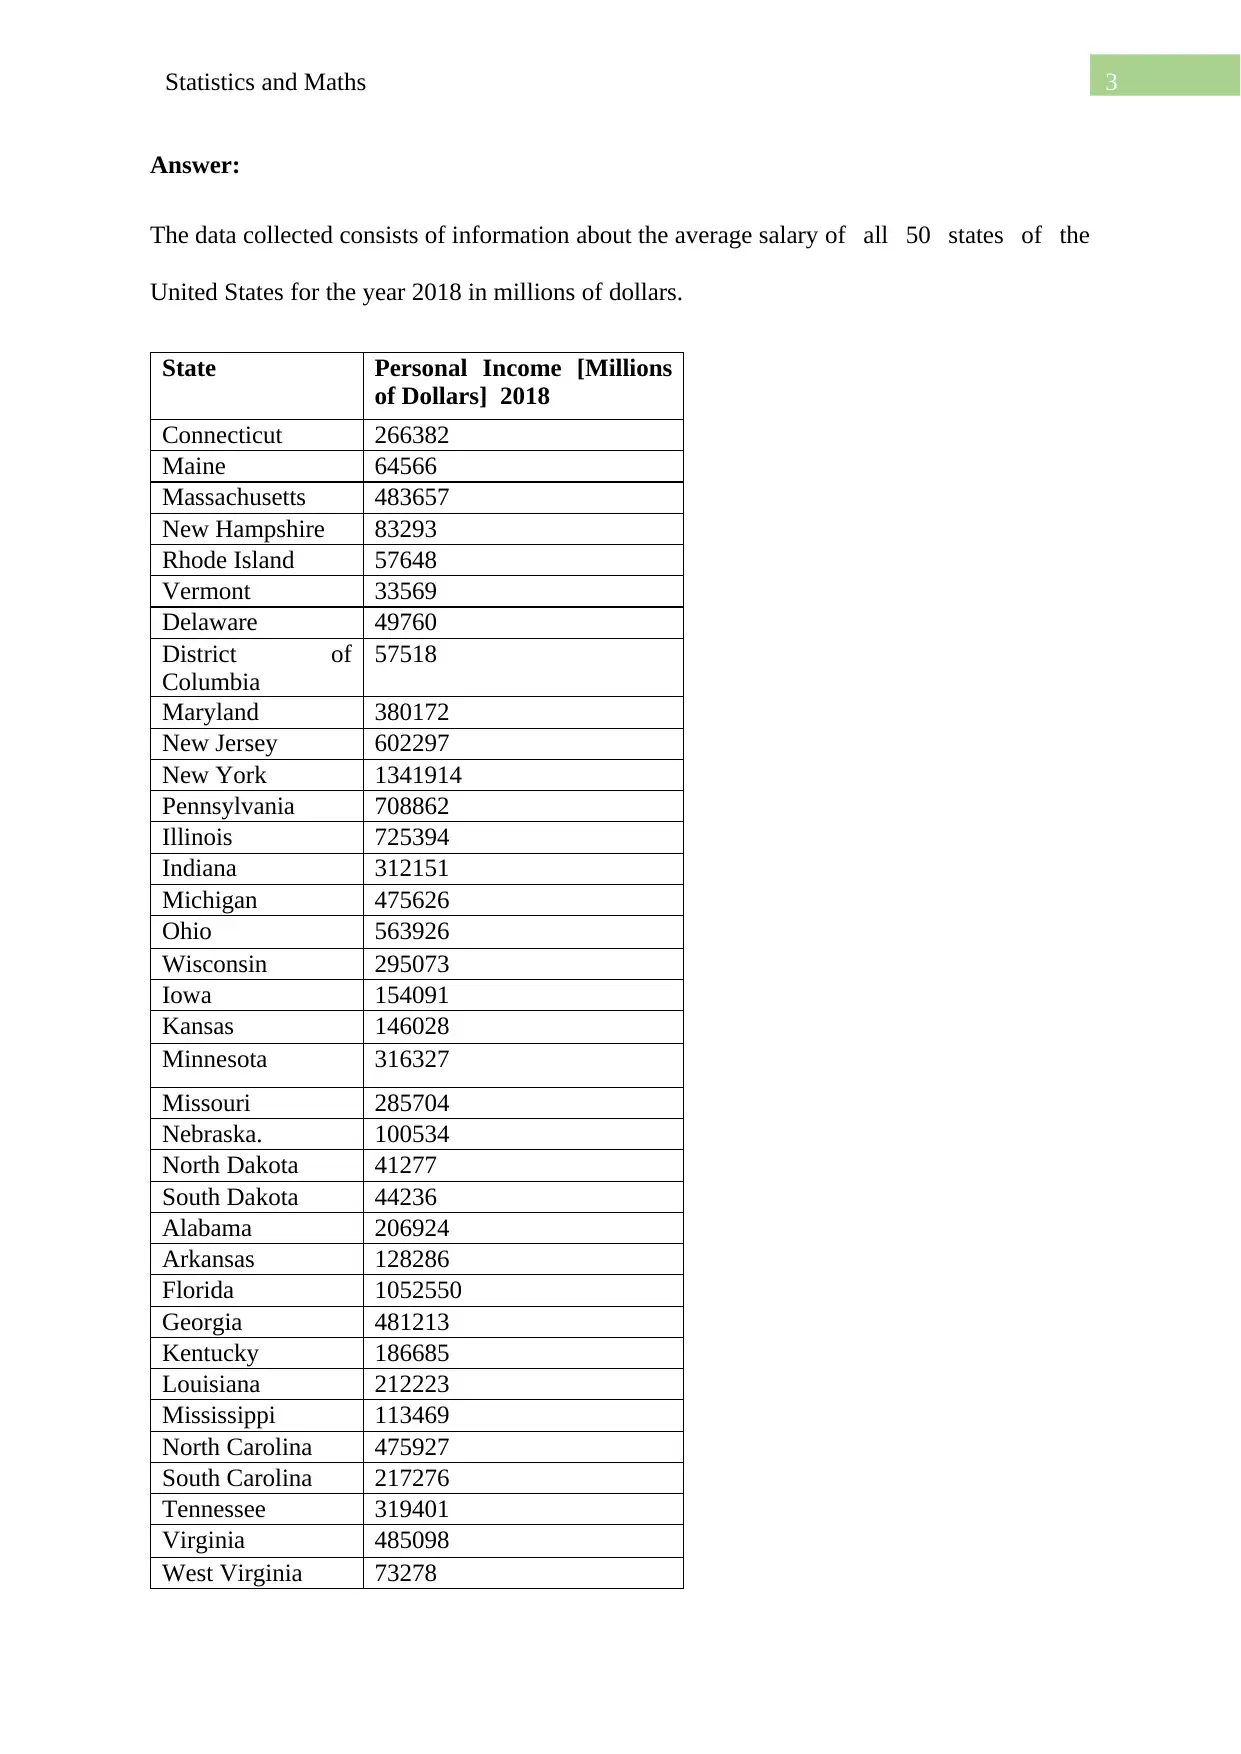
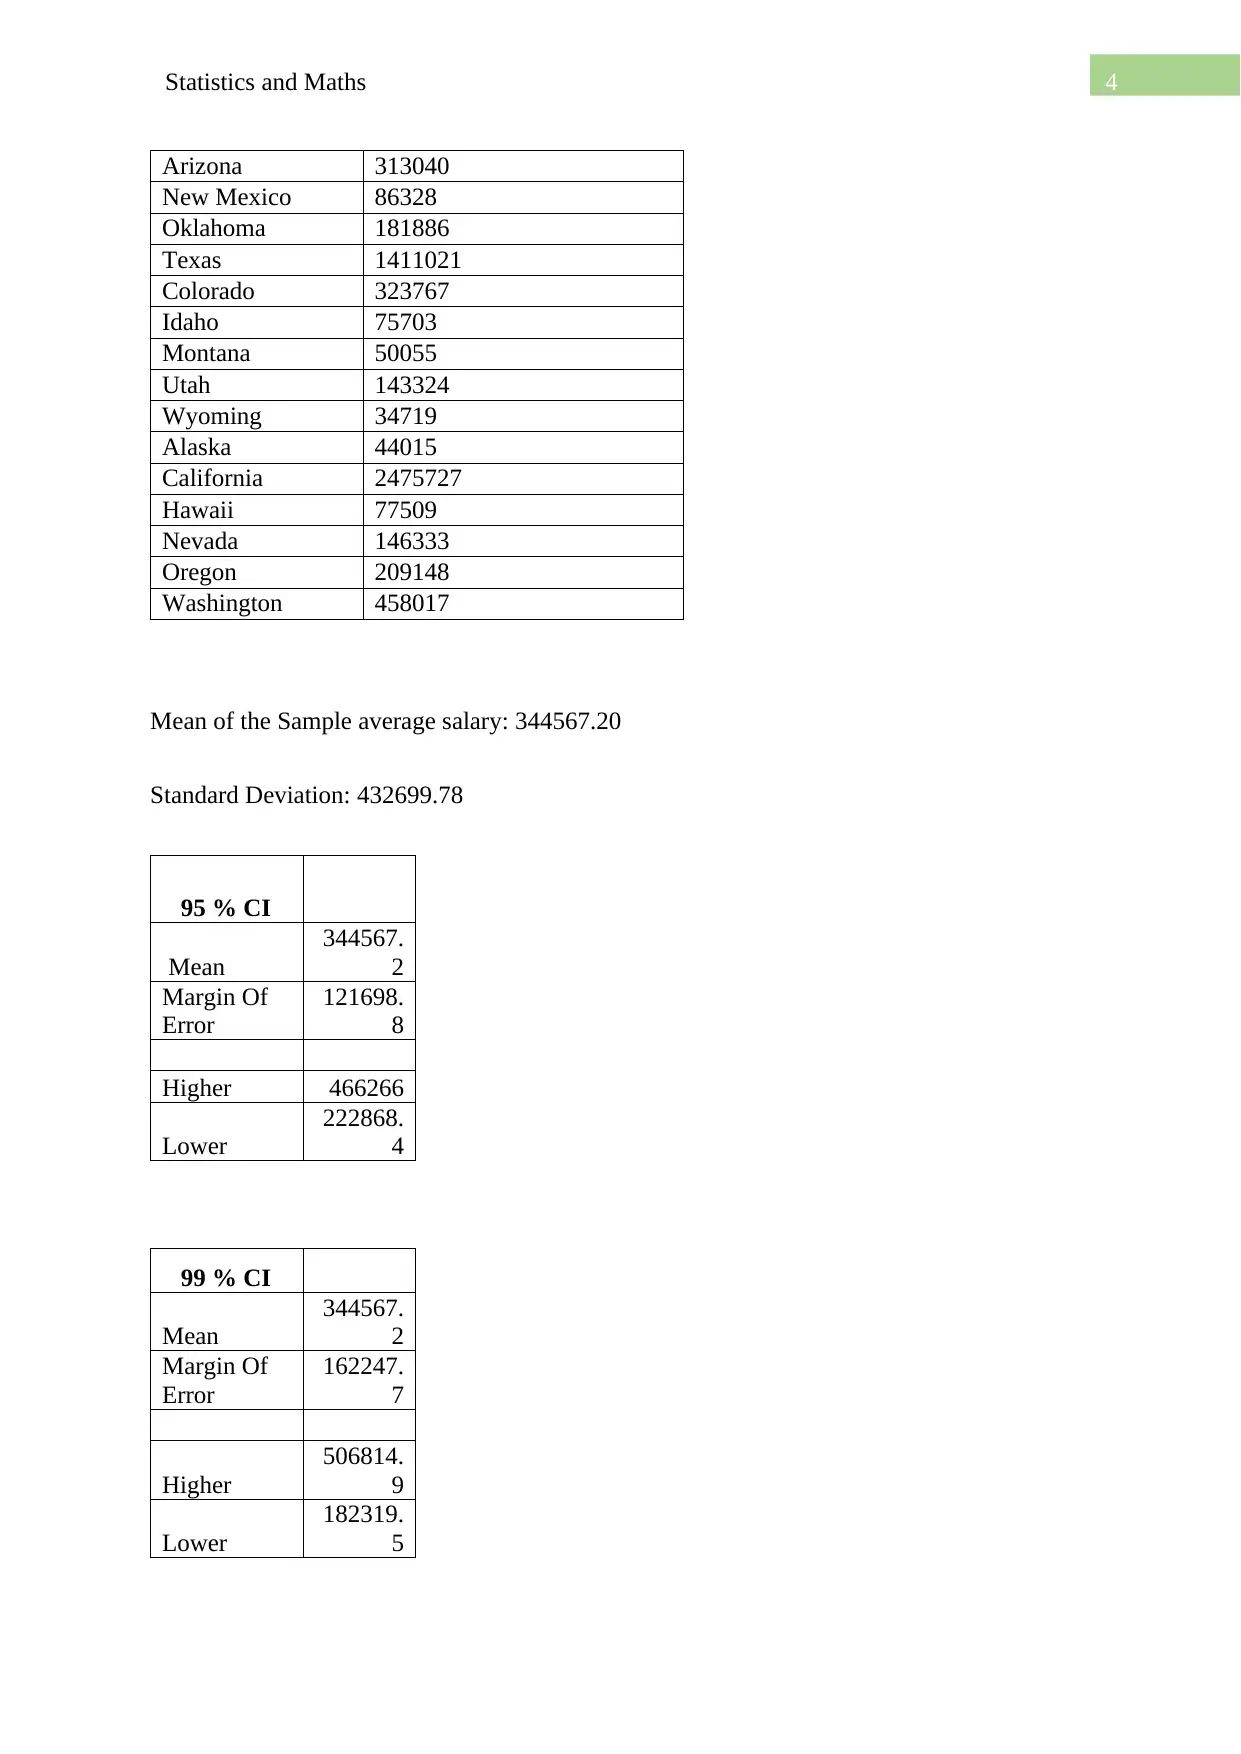
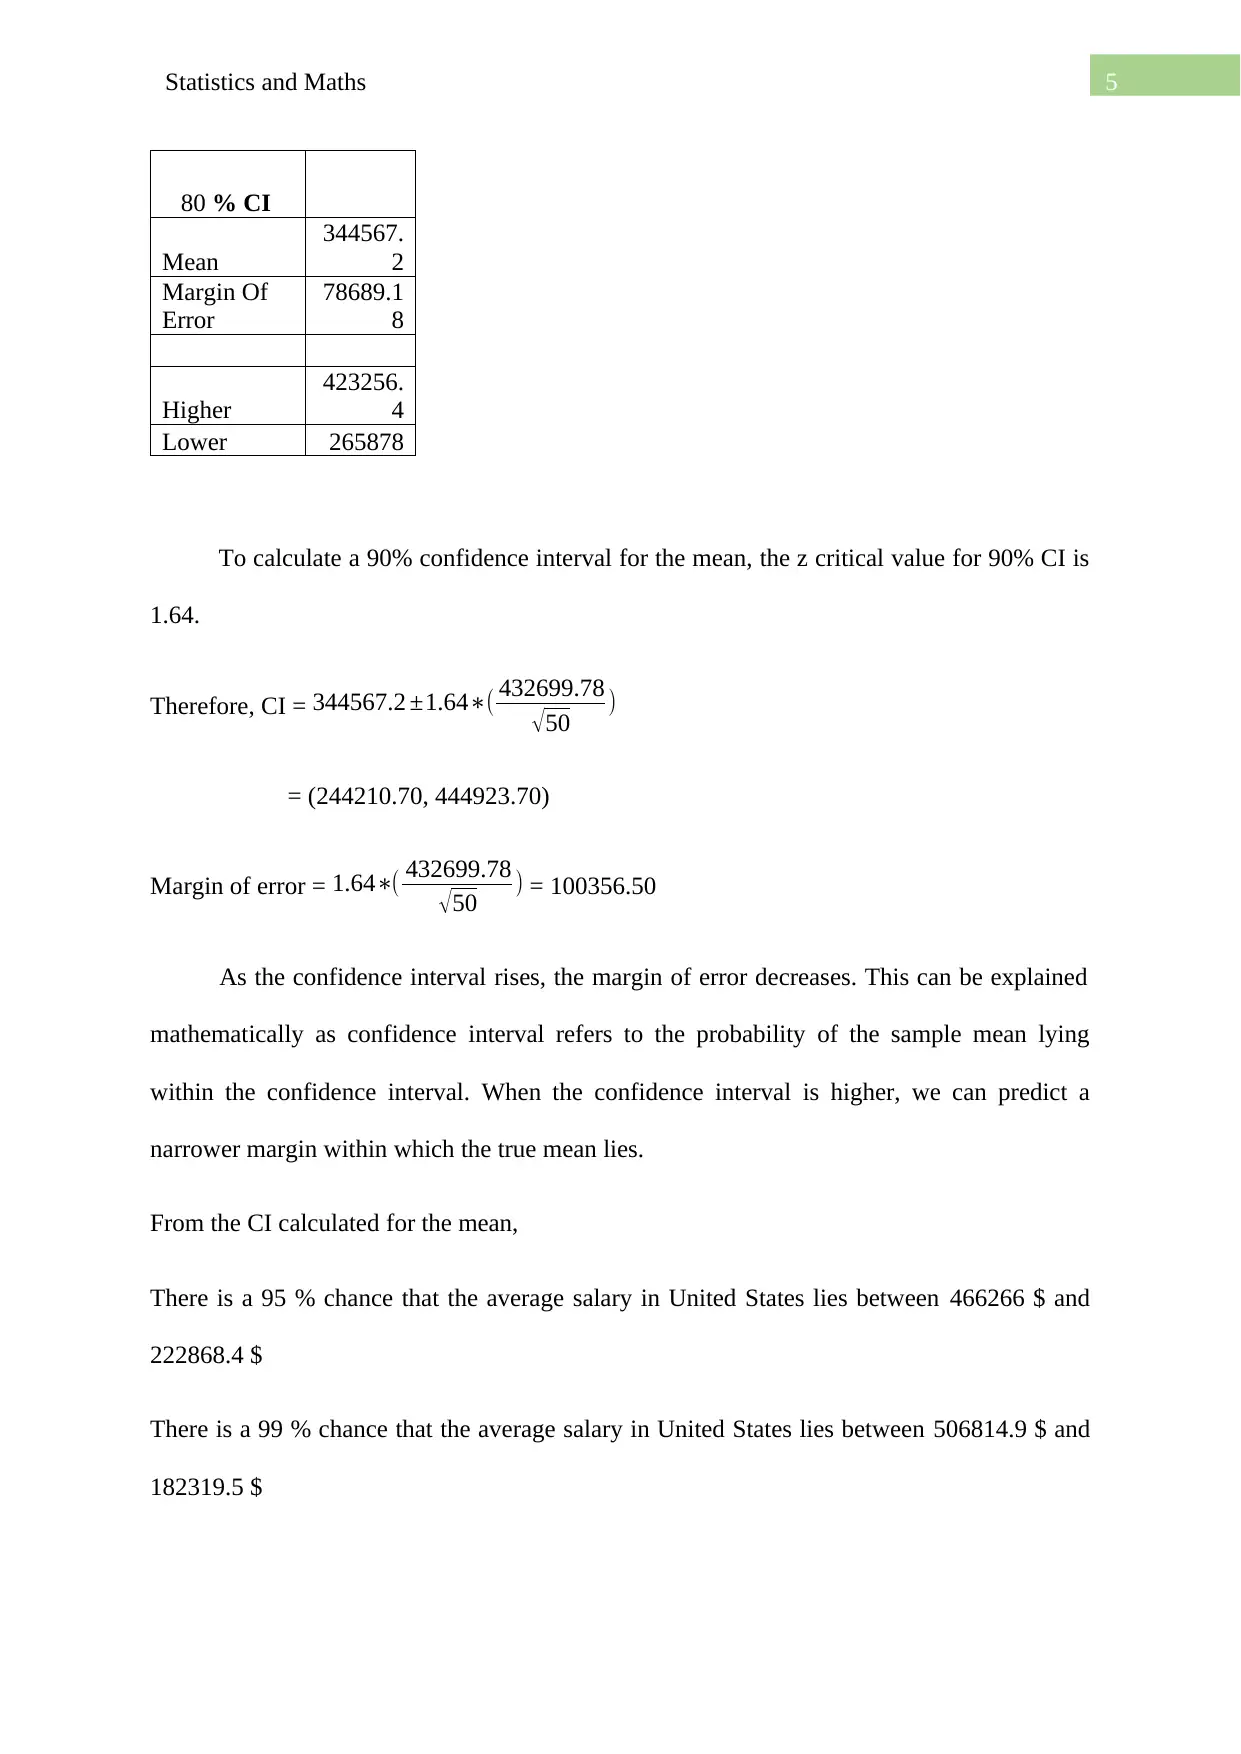
This homework assignment presents a statistical analysis of US state income data for the year 2018. The student calculates the mean and standard deviation of the average salaries across all 50 states. The core of the assignment involves constructing and interpreting confidence intervals at 80%, 95%, and 99% confidence levels. The student demonstrates an understanding of how the margin of error changes with different confidence levels and the relationship between confidence intervals and the probability of the true mean falling within the calculated range. The analysis provides insights into the distribution of state incomes, highlighting the application of statistical methods to real-world datasets. The assignment also includes a discussion on the relationship between margin of error and confidence interval length, demonstrating the student's grasp of statistical concepts and their practical implications. The student correctly calculates margin of error and confidence intervals.
Document Page
Running head: Statistics And Maths
Statistics and Maths
Name of the University
Name of the Student
tabler-icon-diamond-filled.svg

Paraphrase This Document

Need a fresh take? Get an instant paraphrase of this document with our AI Paraphraser
Document Page
2Statistics and Maths
Table of Contents
Answer:......................................................................................................................................3
References:.................................................................................................................................7
Document Page
3Statistics and Maths
Answer:
The data collected consists of information about the average salary of all 50 states of the
United States for the year 2018 in millions of dollars.
State Personal Income [Millions
of Dollars] 2018
Connecticut 266382
Maine 64566
Massachusetts 483657
New Hampshire 83293
Rhode Island 57648
Vermont 33569
Delaware 49760
District of
Columbia
57518
Maryland 380172
New Jersey 602297
New York 1341914
Pennsylvania 708862
Illinois 725394
Indiana 312151
Michigan 475626
Ohio 563926
Wisconsin 295073
Iowa 154091
Kansas 146028
Minnesota 316327
Missouri 285704
Nebraska. 100534
North Dakota 41277
South Dakota 44236
Alabama 206924
Arkansas 128286
Florida 1052550
Georgia 481213
Kentucky 186685
Louisiana 212223
Mississippi 113469
North Carolina 475927
South Carolina 217276
Tennessee 319401
Virginia 485098
West Virginia 73278
Document Page
4Statistics and Maths
Arizona 313040
New Mexico 86328
Oklahoma 181886
Texas 1411021
Colorado 323767
Idaho 75703
Montana 50055
Utah 143324
Wyoming 34719
Alaska 44015
California 2475727
Hawaii 77509
Nevada 146333
Oregon 209148
Washington 458017
Mean of the Sample average salary: 344567.20
Standard Deviation: 432699.78
95 % CI
Mean
344567.
2
Margin Of
Error
121698.
8
Higher 466266
Lower
222868.
4
99 % CI
Mean
344567.
2
Margin Of
Error
162247.
7
Higher
506814.
9
Lower
182319.
5
tabler-icon-diamond-filled.svg

Paraphrase This Document

Need a fresh take? Get an instant paraphrase of this document with our AI Paraphraser
Document Page
5Statistics and Maths
80 % CI
Mean
344567.
2
Margin Of
Error
78689.1
8
Higher
423256.
4
Lower 265878
To calculate a 90% confidence interval for the mean, the z critical value for 90% CI is
1.64.
Therefore, CI = 344567.2 ±1.64( 432699.78
50 )
= (244210.70, 444923.70)
Margin of error = 1.64( 432699.78
50 ) = 100356.50
As the confidence interval rises, the margin of error decreases. This can be explained
mathematically as confidence interval refers to the probability of the sample mean lying
within the confidence interval. When the confidence interval is higher, we can predict a
narrower margin within which the true mean lies.
From the CI calculated for the mean,
There is a 95 % chance that the average salary in United States lies between 466266 $ and
222868.4 $
There is a 99 % chance that the average salary in United States lies between 506814.9 $ and
182319.5 $
Document Page
6Statistics and Maths
There is a 80 % chance that the average salary in United States lies between 423256.4 $ and
265878 $
Working on this problem it was understood how the margin of error and confidence
interval are related and it was also noticed that as the confidence interval increases, the length
of the interval decreases.
This problems helped show how interesting insights can be extracted about a large
dataset with standard statistical methods such finding out mean, standard deviation or
confidence intervals.
Document Page
7Statistics and Maths
tabler-icon-diamond-filled.svg

Paraphrase This Document

Need a fresh take? Get an instant paraphrase of this document with our AI Paraphraser
Document Page
8Statistics and Maths
References:
Siegel, A., 2016. Practical business statistics. Academic Press.
Black, K.U., 2019. Business statistics: for contemporary decision making. Wiley.
chevron_up_icon
1 out of 8
circle_padding
hide_on_mobile
zoom_out_icon
[object Object]