Statistics Assignment: Confidence Intervals, Mean, and Sample Analysis

Verified

Added on  2023/01/11

|3
|299
|83
Homework Assignment
AI Summary
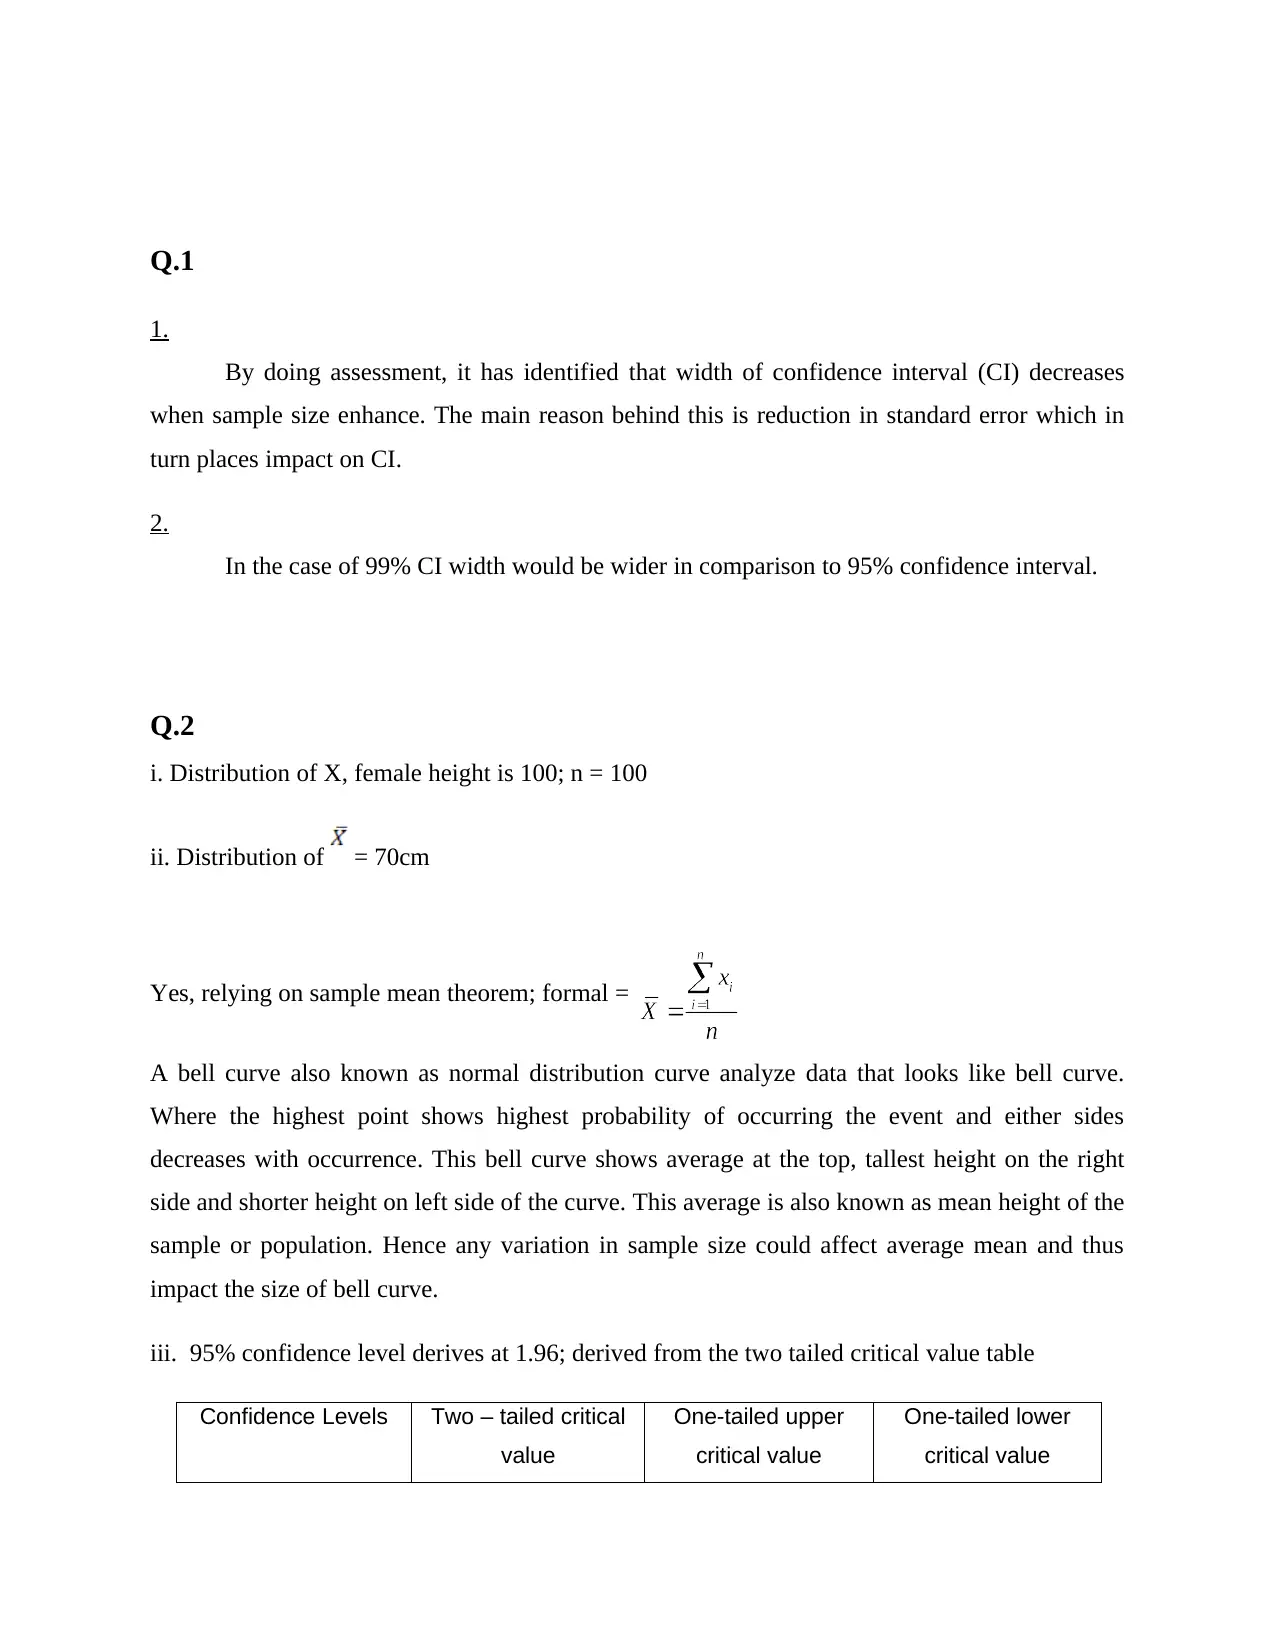
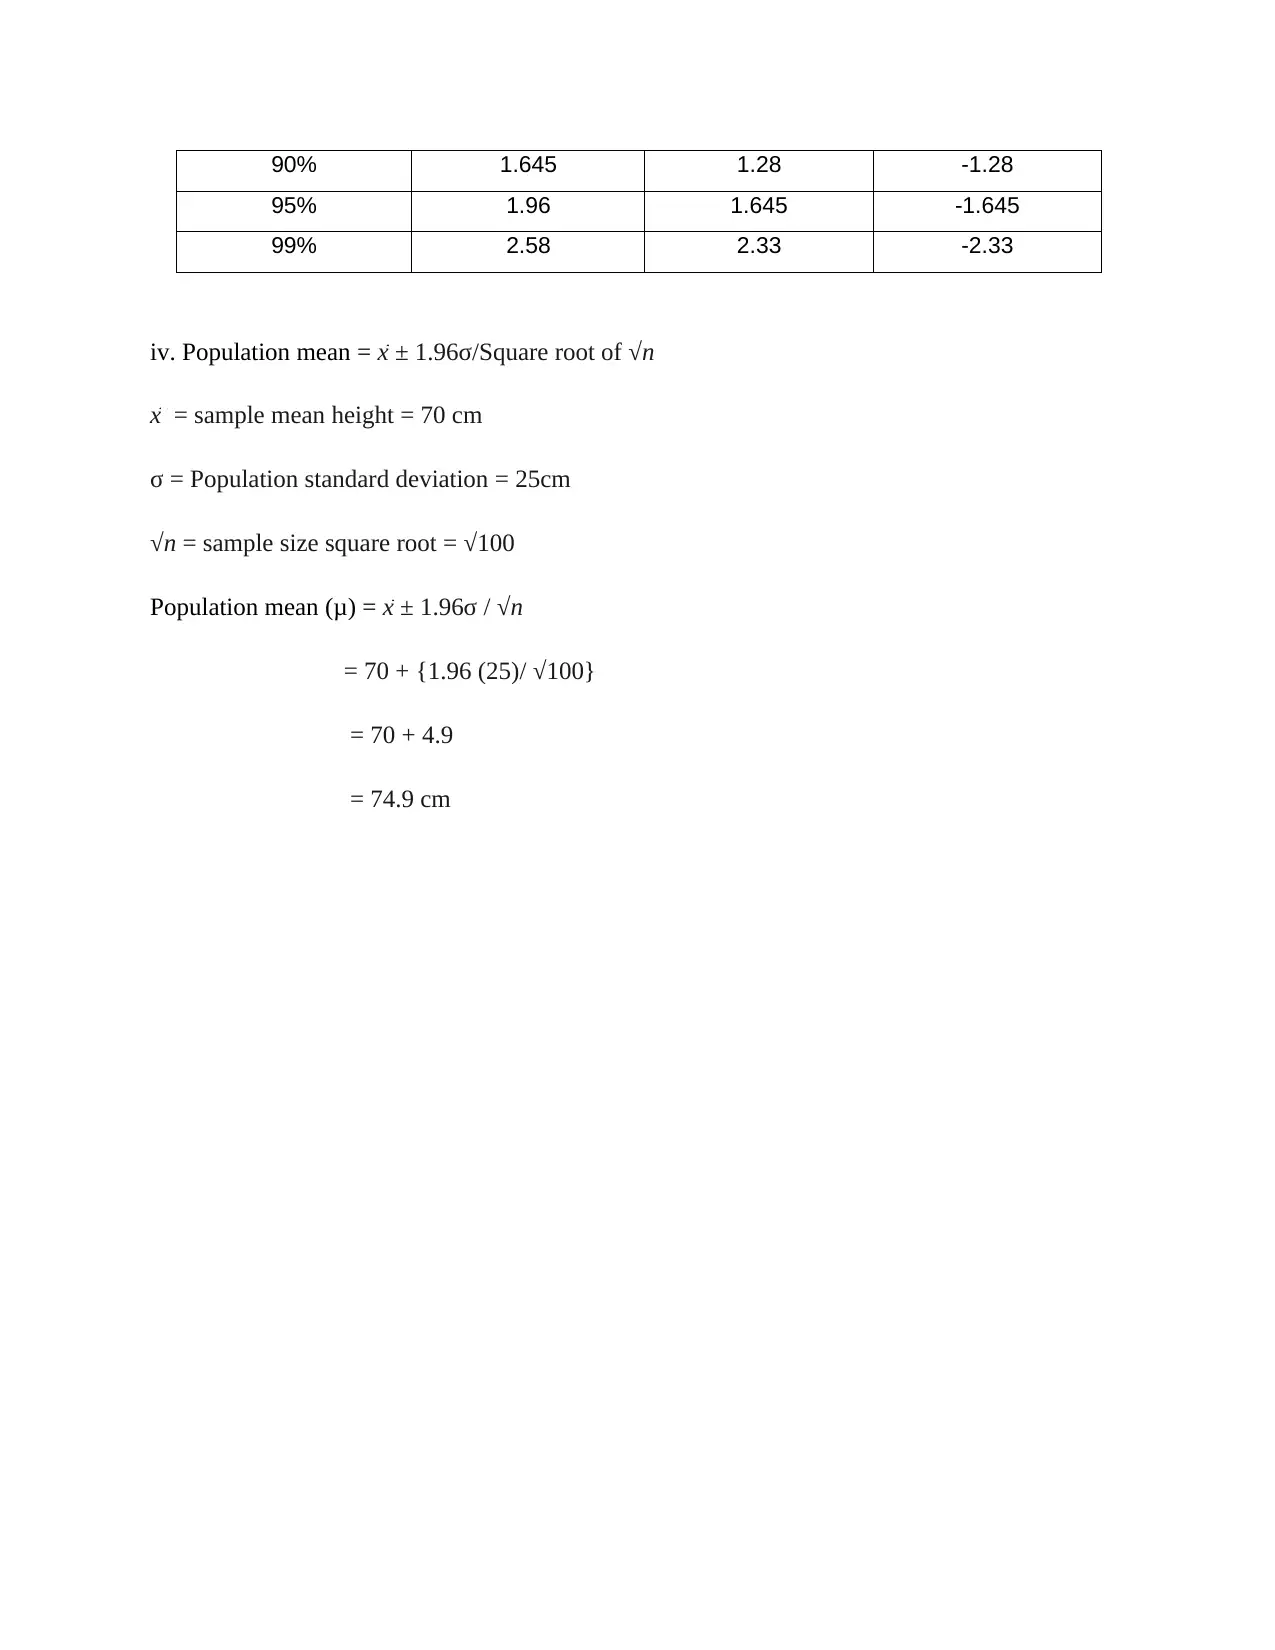
This statistics assignment delves into the concepts of confidence intervals and mean calculations. It explores how the width of a confidence interval decreases with an increased sample size, due to a reduction in standard error. The assignment also highlights the differences between 95% and 99% confidence intervals. Furthermore, it includes an analysis of female height data, examining its distribution and the impact of sample size on the mean. The solution calculates the population mean using the sample mean, standard deviation, and sample size, demonstrating the application of statistical formulas and principles. The assignment provides a comprehensive understanding of statistical concepts and their practical applications.
Document Page
STATISTICS
tabler-icon-diamond-filled.svg

Paraphrase This Document

Need a fresh take? Get an instant paraphrase of this document with our AI Paraphraser
Document Page
Q.1
1.
By doing assessment, it has identified that width of confidence interval (CI) decreases
when sample size enhance. The main reason behind this is reduction in standard error which in
turn places impact on CI.
2.
In the case of 99% CI width would be wider in comparison to 95% confidence interval.
Q.2
i. Distribution of X, female height is 100; n = 100
ii. Distribution of = 70cm
Yes, relying on sample mean theorem; formal =
A bell curve also known as normal distribution curve analyze data that looks like bell curve.
Where the highest point shows highest probability of occurring the event and either sides
decreases with occurrence. This bell curve shows average at the top, tallest height on the right
side and shorter height on left side of the curve. This average is also known as mean height of the
sample or population. Hence any variation in sample size could affect average mean and thus
impact the size of bell curve.
iii. 95% confidence level derives at 1.96; derived from the two tailed critical value table
Confidence Levels Two – tailed critical
value
One-tailed upper
critical value
One-tailed lower
critical value
Document Page
90% 1.645 1.28 -1.28
95% 1.96 1.645 -1.645
99% 2.58 2.33 -2.33
iv. Population mean = ± 1.96σ/Square root of n
= sample mean height = 70 cm
σ = Population standard deviation = 25cm
n = sample size square root = √100
Population mean (μ) = ± 1.96σ / n
= 70 + {1.96 (25)/ √100}
= 70 + 4.9
= 74.9 cm
chevron_up_icon
1 out of 3
circle_padding
hide_on_mobile
zoom_out_icon
[object Object]