MARK4338: Marketing Assignment on Conjoint Analysis and Mapping
VerifiedAdded on 2019/10/18
|2
|556
|388
Project
AI Summary
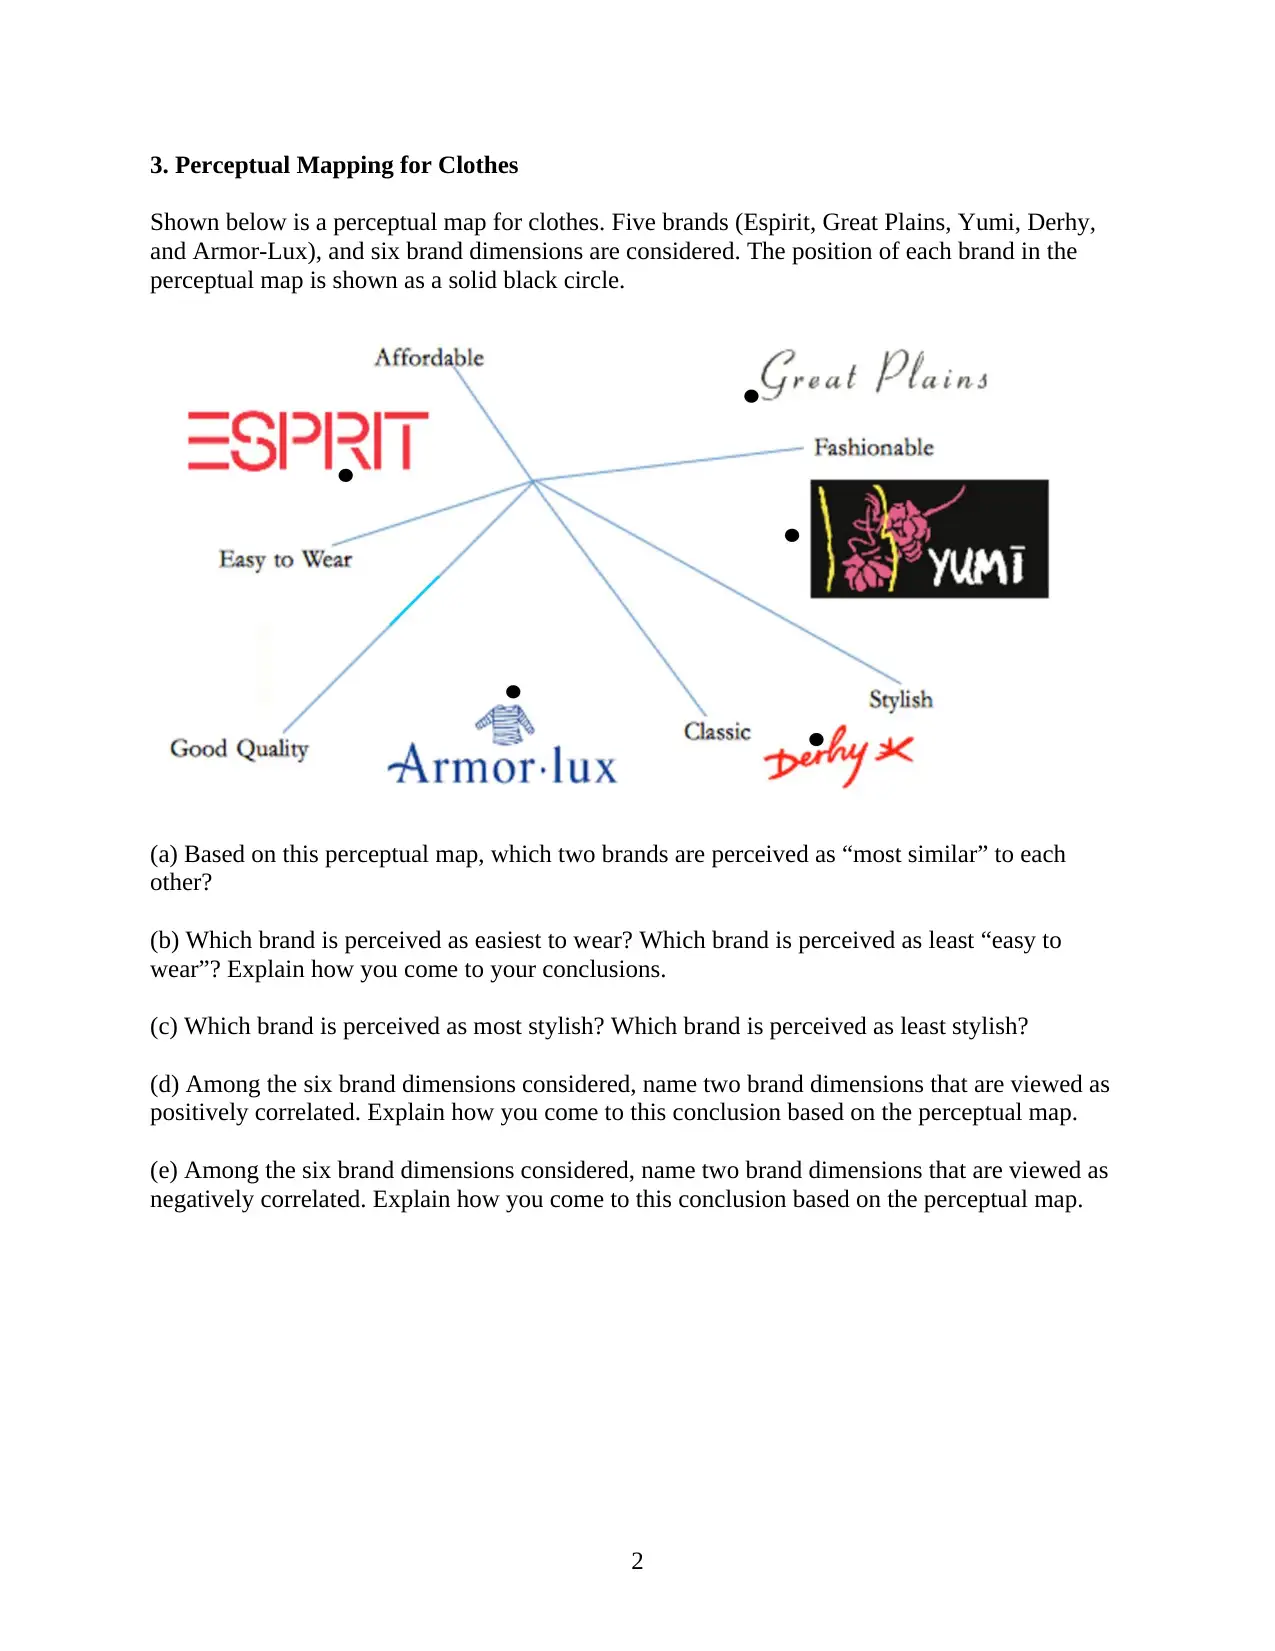
This marketing assignment involves a detailed analysis of consumer preferences using conjoint analysis and perceptual mapping techniques. The assignment begins with a single consumer example, calculating part-worth utilities and relative importance of attributes related to train service (...

Marketing Research MARK4338
Assignment #4
Due Date: Oct 24, 2016 (in class)
Suppose Amtrain, a major rail company, is considering a new hi-speed train service from New
York to Toronto. To study consumers’ preference for train service, Amtrain commissioned a
conjoint study. Train service is modeled as a bundle of the following attributes:
Trip duration: 5 hours, 7 hours
Price: $200, $350
Food: snack only, gourmet meals
Seat quality: standard, premium
In terms of study design, each respondent is shown a total of 2x2x2x2 = 16 product profiles, and
is asked to rate each profile on a 0 to 10 scale.
1. Conjoint analysis of a simple example (1 consumer)
The survey for one particular respondent is shown in the file “Conjoint train (single
respondent).xls”. Note: For Mac users, you need to use EXCEL on a PC (in the computer lab).
Using the Tools Data Analysis Regression function in EXCEL, compute
(a) The part-worth for each attribute level for this respondent
(b) The relative importance of each attribute for this respondent
Make sure you explain your dummy variable coding scheme clearly.
2. Compute exercise (N consumers)
The complete survey result for 50 respondents are shown in the file “Conjoint train (all
respondents).xls”.
Using the function LINEST() and the procedure described in class, analyze the conjoint data for
all respondents and answer the following questions:
(a) what is the most important attribute across the whole population? What is the average relative
importance of this attribute?
(b) what is the least important attribute across the whole population? What is the average relative
importance of this attribute?
(c) what percentage of respondents think that trip duration is most important? Price? Food? Seat
quality?
1
Paraphrase This Document
Need a fresh take? Get an instant paraphrase of this document with our AI Paraphraser

3. Perceptual Mapping for Clothes
Shown below is a perceptual map for clothes. Five brands (Espirit, Great Plains, Yumi, Derhy,
and Armor-Lux), and six brand dimensions are considered. The position of each brand in the
perceptual map is shown as a solid black circle.
(a) Based on this perceptual map, which two brands are perceived as “most similar” to each
other?
(b) Which brand is perceived as easiest to wear? Which brand is perceived as least “easy to
wear”? Explain how you come to your conclusions.
(c) Which brand is perceived as most stylish? Which brand is perceived as least stylish?
(d) Among the six brand dimensions considered, name two brand dimensions that are viewed as
positively correlated. Explain how you come to this conclusion based on the perceptual map.
(e) Among the six brand dimensions considered, name two brand dimensions that are viewed as
negatively correlated. Explain how you come to this conclusion based on the perceptual map.
2
1 out of 2

Your All-in-One AI-Powered Toolkit for Academic Success.
+13062052269
info@desklib.com
Available 24*7 on WhatsApp / Email
Unlock your academic potential
© 2024 | Zucol Services PVT LTD | All rights reserved.