Conroy Manufacturing: Risk Assessment and Marketing Strategy Report
VerifiedAdded on 2020/04/01
|15
|3483
|328
Report
AI Summary
This report provides a comprehensive analysis of Conroy Manufacturing's marketing strategies, focusing on the development of new agricultural tools and equipment. It employs a Bayesian approach to evaluate consulting marketing options, incorporating decision tree analysis, reliability matrices, and the coefficient of variation for risk assessment. The report explores the decision-maker's utility function and presents tabular, graphical, and mathematical representations of the data. It also addresses risk assessment and coping strategies, including a ranking process for preference among alternatives. The core objective is to help Conroy Manufacturing sustain its stability, attract more customers, and integrate with the company prototype to increase and rationalize its competencies. The report emphasizes customer service as a key competitive advantage and encourages collaborative learning and information sharing across all levels of the company.
1
Contents
Administrative synopsis...............................................................................................................................1
Selection of the best consulting marketing using Bayesian Approach.........................................................2
Developing a reliability matrix:............................................................................................................3
Decision Tree Approach:......................................................................................................................5
Coefficient of Variation [C.V] as Risk Measuring Tool..................................................................................5
Decision Maker's Utility Function................................................................................................................6
Tabular Representation.......................................................................................................................8
Graphical Representation....................................................................................................................9
Mathematical Representation...........................................................................................................10
Risk Assessment & Coping Strategies:.......................................................................................................10
Ranking Process for Preference among Alternatives.................................................................................13
References.................................................................................................................................................14
Paraphrase This Document
Need a fresh take? Get an instant paraphrase of this document with our AI Paraphraser
2
Administrative synopsis
The core objective at the moment is that the Conroy manufacturing company aims to viewpoint
manufacturing diverse new product of agricultural tools and gear, with a prediction to sustain its
steadiness and fascinate more buyers.
In additionally, the company management aims to assimilate with the company prototypical in
order to increase and rationalize the ones competences. The Conroy manufacturing company is
determined to concentrate majorly on purchaser services in its basis. The ultimate goal is to
attract more customers from 30% to 85%.
The Conroy manufacturing company identifies that its forte and their new competitive merit are
and always will be customers. Every subordinate in the company is esteemed, respected,
encouraged and performance driven. The administration will work collectively to recurrently
learn and share philosophies and information. The company inspires supportive efforts at every
level and across all activities in the company as they hopes that they will do the right thing.
3
Selection of the best consulting marketing using Bayesian
Approach
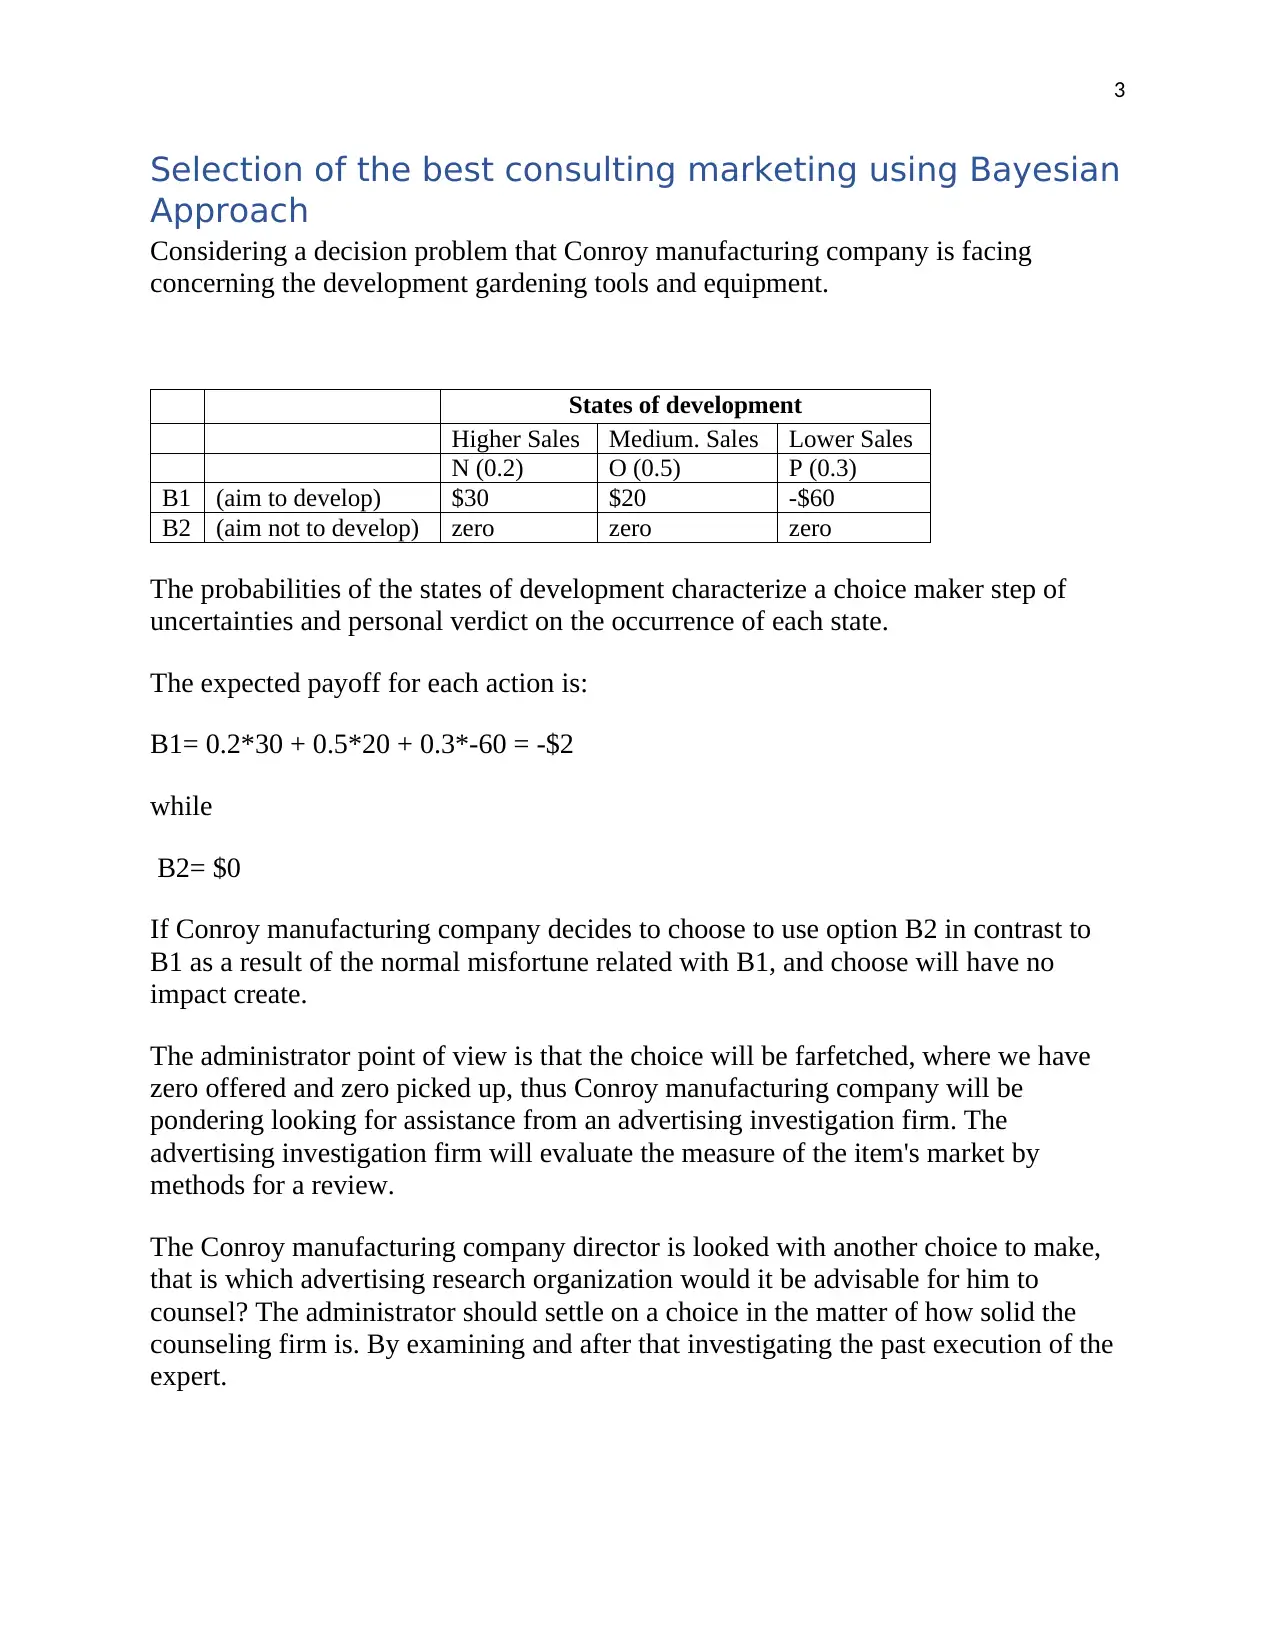
Considering a decision problem that Conroy manufacturing company is facing
concerning the development gardening tools and equipment.
States of development
Higher Sales Medium. Sales Lower Sales
N (0.2) O (0.5) P (0.3)
B1 (aim to develop) $30 $20 -$60
B2 (aim not to develop) zero zero zero
The probabilities of the states of development characterize a choice maker step of
uncertainties and personal verdict on the occurrence of each state.
The expected payoff for each action is:
B1= 0.2*30 + 0.5*20 + 0.3*-60 = -$2
while
B2= $0
If Conroy manufacturing company decides to choose to use option B2 in contrast to
B1 as a result of the normal misfortune related with B1, and choose will have no
impact create.
The administrator point of view is that the choice will be farfetched, where we have
zero offered and zero picked up, thus Conroy manufacturing company will be
pondering looking for assistance from an advertising investigation firm. The
advertising investigation firm will evaluate the measure of the item's market by
methods for a review.
The Conroy manufacturing company director is looked with another choice to make,
that is which advertising research organization would it be advisable for him to
counsel? The administrator should settle on a choice in the matter of how solid the
counseling firm is. By examining and after that investigating the past execution of the
expert.
Selection of the best consulting marketing using Bayesian
Approach
Considering a decision problem that Conroy manufacturing company is facing
concerning the development gardening tools and equipment.
States of development
Higher Sales Medium. Sales Lower Sales
N (0.2) O (0.5) P (0.3)
B1 (aim to develop) $30 $20 -$60
B2 (aim not to develop) zero zero zero
The probabilities of the states of development characterize a choice maker step of
uncertainties and personal verdict on the occurrence of each state.
The expected payoff for each action is:
B1= 0.2*30 + 0.5*20 + 0.3*-60 = -$2
while
B2= $0
If Conroy manufacturing company decides to choose to use option B2 in contrast to
B1 as a result of the normal misfortune related with B1, and choose will have no
impact create.
The administrator point of view is that the choice will be farfetched, where we have
zero offered and zero picked up, thus Conroy manufacturing company will be
pondering looking for assistance from an advertising investigation firm. The
advertising investigation firm will evaluate the measure of the item's market by
methods for a review.
The Conroy manufacturing company director is looked with another choice to make,
that is which advertising research organization would it be advisable for him to
counsel? The administrator should settle on a choice in the matter of how solid the
counseling firm is. By examining and after that investigating the past execution of the
expert.
⊘ This is a preview!⊘
Do you want full access?
Subscribe today to unlock all pages.
Trusted by 1+ million students worldwide
4
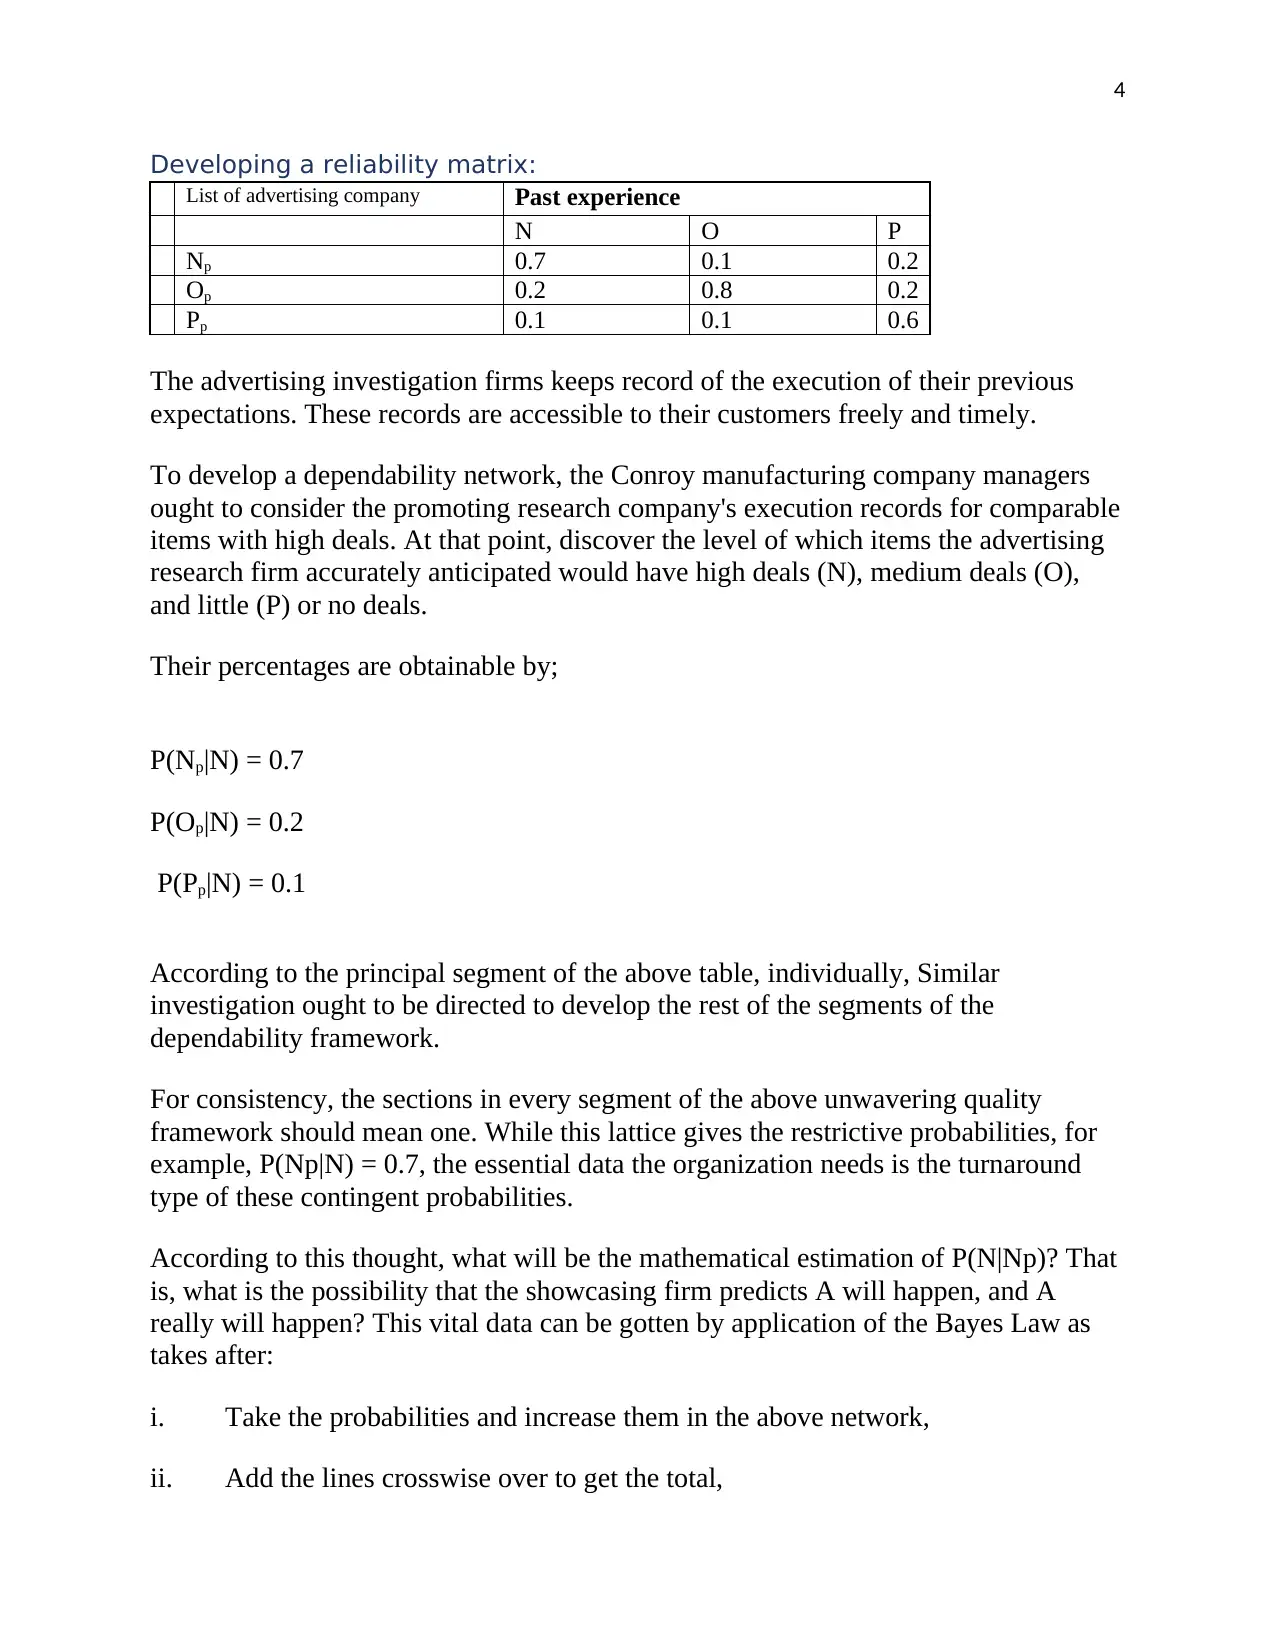
Developing a reliability matrix:
List of advertising company Past experience
N O P
Np 0.7 0.1 0.2
Op 0.2 0.8 0.2
Pp 0.1 0.1 0.6
The advertising investigation firms keeps record of the execution of their previous
expectations. These records are accessible to their customers freely and timely.
To develop a dependability network, the Conroy manufacturing company managers
ought to consider the promoting research company's execution records for comparable
items with high deals. At that point, discover the level of which items the advertising
research firm accurately anticipated would have high deals (N), medium deals (O),
and little (P) or no deals.
Their percentages are obtainable by;
P(Np|N) = 0.7
P(Op|N) = 0.2
P(Pp|N) = 0.1
According to the principal segment of the above table, individually, Similar
investigation ought to be directed to develop the rest of the segments of the
dependability framework.
For consistency, the sections in every segment of the above unwavering quality
framework should mean one. While this lattice gives the restrictive probabilities, for
example, P(Np|N) = 0.7, the essential data the organization needs is the turnaround
type of these contingent probabilities.
According to this thought, what will be the mathematical estimation of P(N|Np)? That
is, what is the possibility that the showcasing firm predicts A will happen, and A
really will happen? This vital data can be gotten by application of the Bayes Law as
takes after:
i. Take the probabilities and increase them in the above network,
ii. Add the lines crosswise over to get the total,
Paraphrase This Document
Need a fresh take? Get an instant paraphrase of this document with our AI Paraphraser
5
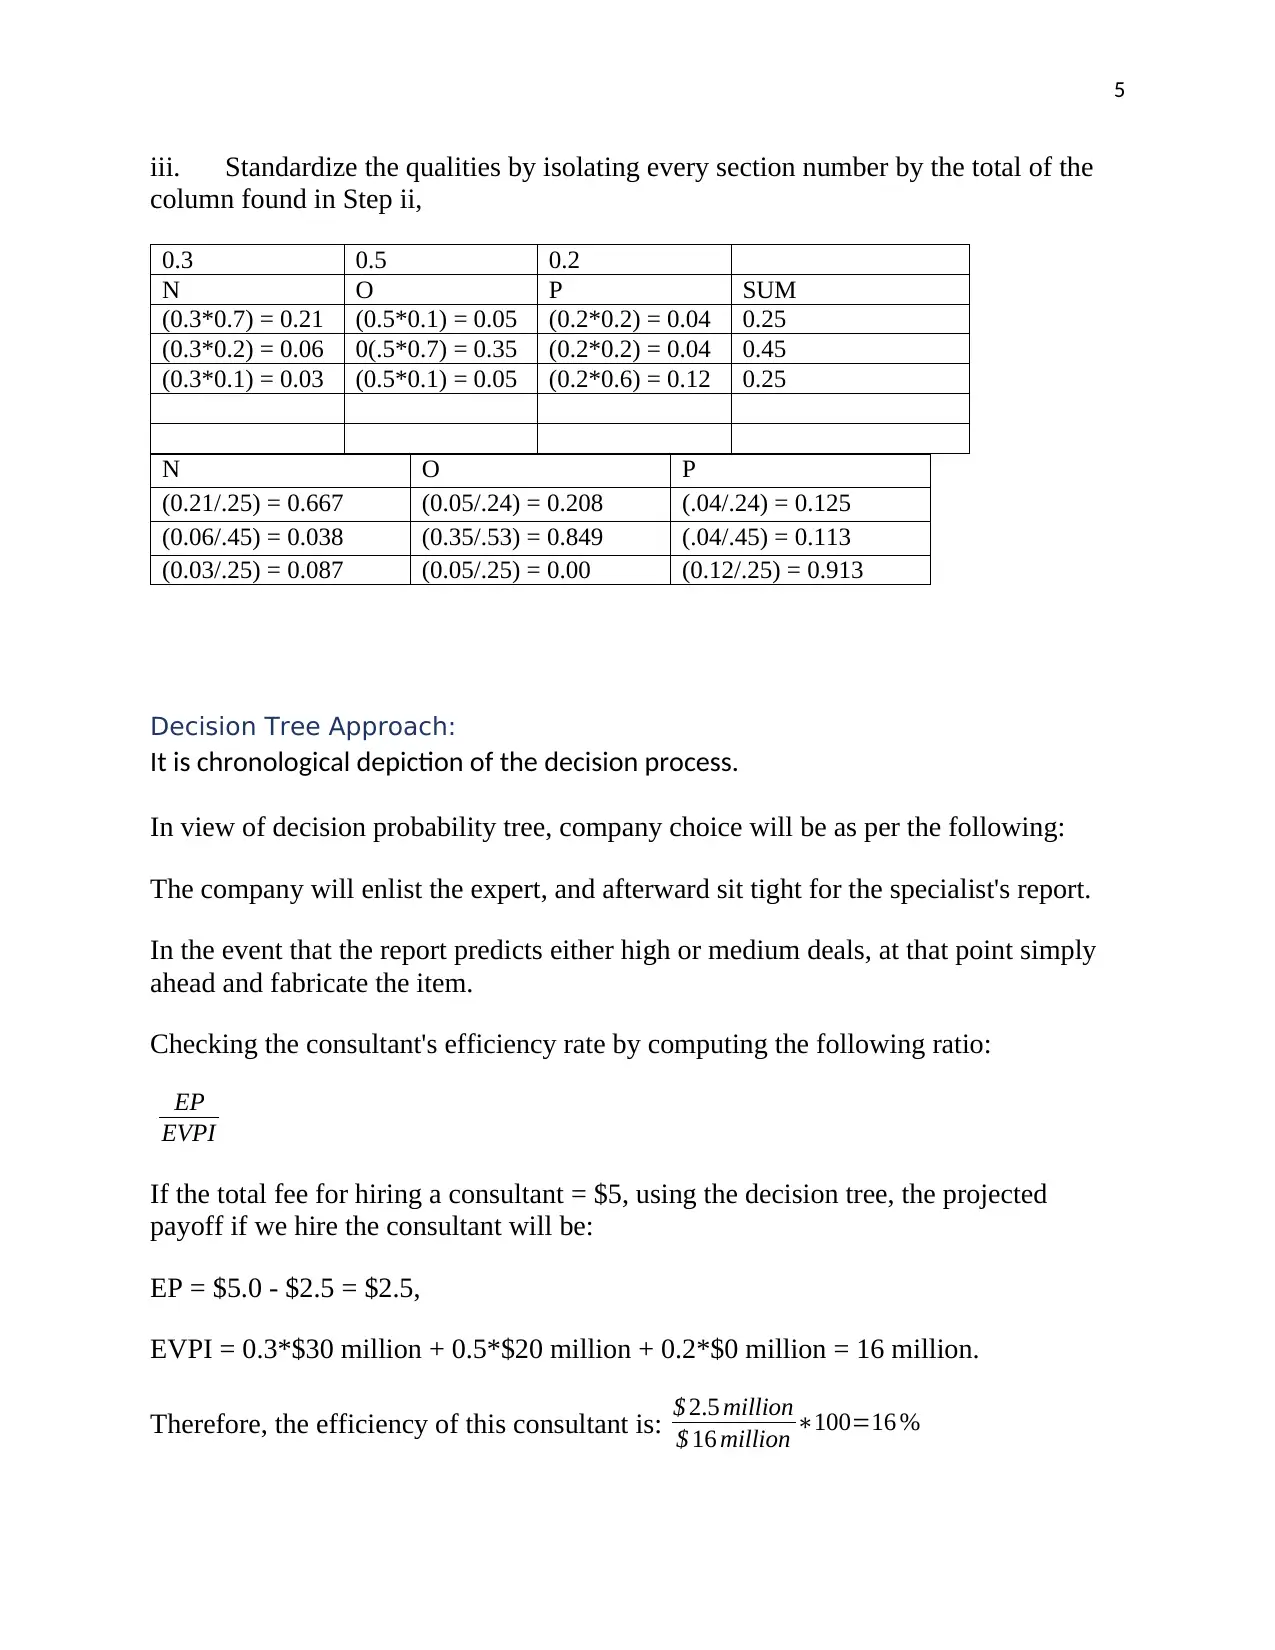
iii. Standardize the qualities by isolating every section number by the total of the
column found in Step ii,
0.3 0.5 0.2
N O P SUM
(0.3*0.7) = 0.21 (0.5*0.1) = 0.05 (0.2*0.2) = 0.04 0.25
(0.3*0.2) = 0.06 0(.5*0.7) = 0.35 (0.2*0.2) = 0.04 0.45
(0.3*0.1) = 0.03 (0.5*0.1) = 0.05 (0.2*0.6) = 0.12 0.25
N O P
(0.21/.25) = 0.667 (0.05/.24) = 0.208 (.04/.24) = 0.125
(0.06/.45) = 0.038 (0.35/.53) = 0.849 (.04/.45) = 0.113
(0.03/.25) = 0.087 (0.05/.25) = 0.00 (0.12/.25) = 0.913
Decision Tree Approach:
It is chronological depiction of the decision process.
In view of decision probability tree, company choice will be as per the following:
The company will enlist the expert, and afterward sit tight for the specialist's report.
In the event that the report predicts either high or medium deals, at that point simply
ahead and fabricate the item.
Checking the consultant's efficiency rate by computing the following ratio:
EP
EVPI
If the total fee for hiring a consultant = $5, using the decision tree, the projected
payoff if we hire the consultant will be:
EP = $5.0 - $2.5 = $2.5,
EVPI = 0.3*$30 million + 0.5*$20 million + 0.2*$0 million = 16 million.
Therefore, the efficiency of this consultant is: $ 2.5 million
$ 16 million ∗100=16 %
6
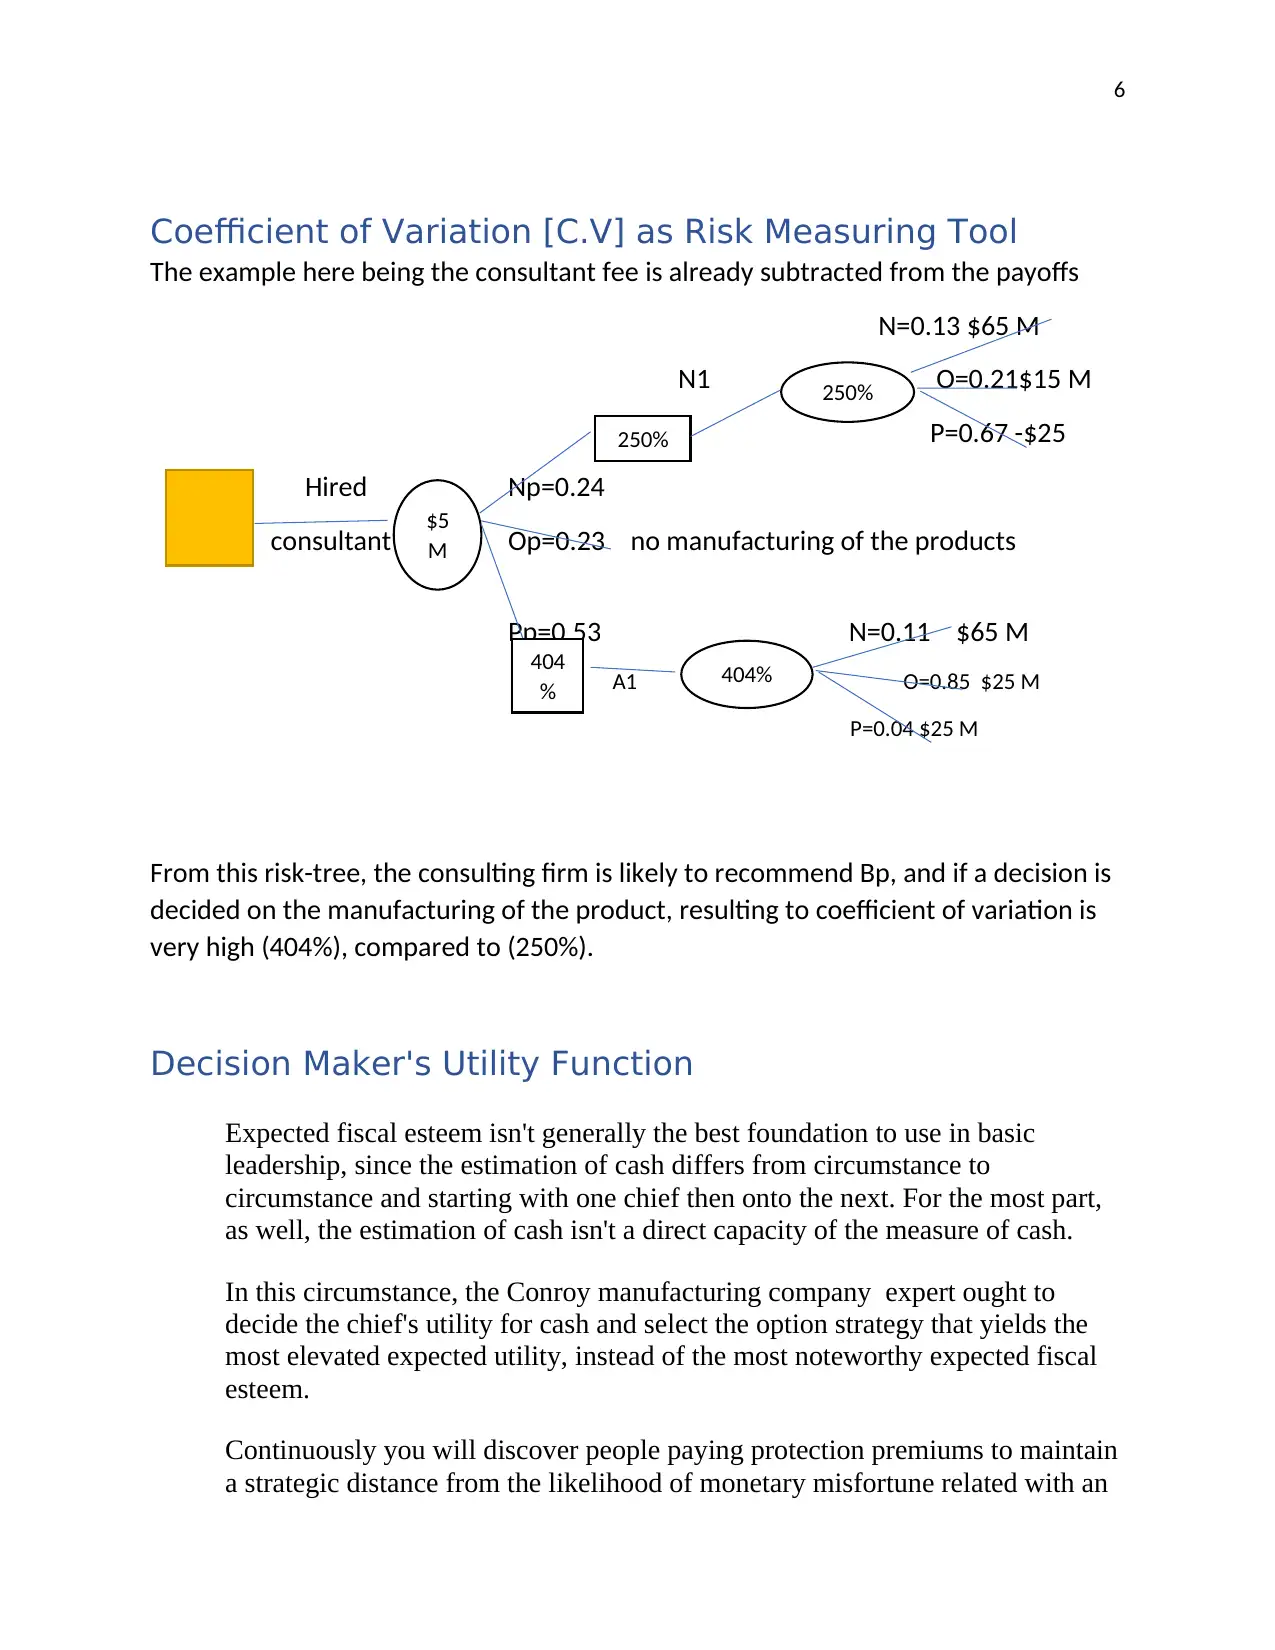
Coefficient of Variation [C.V] as Risk Measuring Tool
The example here being the consultant fee is already subtracted from the payoffs
N=0.13 $65 M
N1 O=0.21$15 M
P=0.67 -$25
Hired Np=0.24
consultant Op=0.23 no manufacturing of the products
Pp=0.53 N=0.11 $65 M
A1 O=0.85 $25 M
P=0.04 $25 M
From this risk-tree, the consulting firm is likely to recommend Bp, and if a decision is
decided on the manufacturing of the product, resulting to coefficient of variation is
very high (404%), compared to (250%).
Decision Maker's Utility Function
Expected fiscal esteem isn't generally the best foundation to use in basic
leadership, since the estimation of cash differs from circumstance to
circumstance and starting with one chief then onto the next. For the most part,
as well, the estimation of cash isn't a direct capacity of the measure of cash.
In this circumstance, the Conroy manufacturing company expert ought to
decide the chief's utility for cash and select the option strategy that yields the
most elevated expected utility, instead of the most noteworthy expected fiscal
esteem.
Continuously you will discover people paying protection premiums to maintain
a strategic distance from the likelihood of monetary misfortune related with an
$5
M
250%
404
%
250%
404%
⊘ This is a preview!⊘
Do you want full access?
Subscribe today to unlock all pages.
Trusted by 1+ million students worldwide
7
unwanted occasion happening. Be that as it may, utilities of various results are
not specifically relative to their fiscal outcomes. In the event that the
misfortune is thought to be moderately vast, an individual will probably select
to pay a related premium. On the off chance that an individual considers the
misfortune immaterial, it is more improbable the individual will pay the related
premium.
People vary in their states of mind towards hazard and these distinctions will
impact their decisions. In this manner, people should settle on a similar choice
each time in respect to the apparent hazard in comparative circumstances. This
does not imply that all people would evaluate a similar measure of hazard to
comparative circumstances. Further, because of the monetary soundness of an
individual, two people confronting a similar circumstance may respond
distinctively yet carry on objectively. A person's disparities of sentiment and
understanding of strategies can likewise deliver contrasts.
The normal money related reward related with different choices might be
absurd for the accompanying two essential reasons:
1. The estimation of cash may not genuinely express the individual estimation
of the result.
2. Expected financial esteems may not precisely reflect hazard avoidance.
The motivation behind why one purchases protection and the other don't will
rely upon the basic leadership process includes mental and financial elements,
among others. In this way, keeping in mind the end goal to settle on a
trustworthy choice considering the chief's state of mind towards chance, one
must interpret the financial result grid into the utility lattice. The principle
question that should be asked is: how would we gauge the utility capacity for a
particular chief?
Assumption
Consider our Investment Decision Problem according to Conroy fabricating
organization.
What might the utility of $24 million be?
an) Assign 100 utile and zero utile to the biggest and littlest ($) result,
separately in the result framework. For our numerical case, we allot 100 utile to
15, and 0 utile to - 2,
Paraphrase This Document
Need a fresh take? Get an instant paraphrase of this document with our AI Paraphraser
8
b) Ask the chief to pick between the accompanying two situations:
1) hold the $24 million for doing nothing
Or, then again
2) Implement the venture and receive consequently a net measure of $30
million with likelihood (p) OR - $4 million with likelihood (1-p), where p is a
chosen number in the vicinity of 0 and 1.
By changing the estimation of p and rehashing a comparative inquiry, there
exists an incentive for p at which the chief is aloof between the two situations.
Say, p = 0.58.
c) Now, the utility for $24 million is equivalent to
0.58(100) + (1-0.58) * (0) = 58.
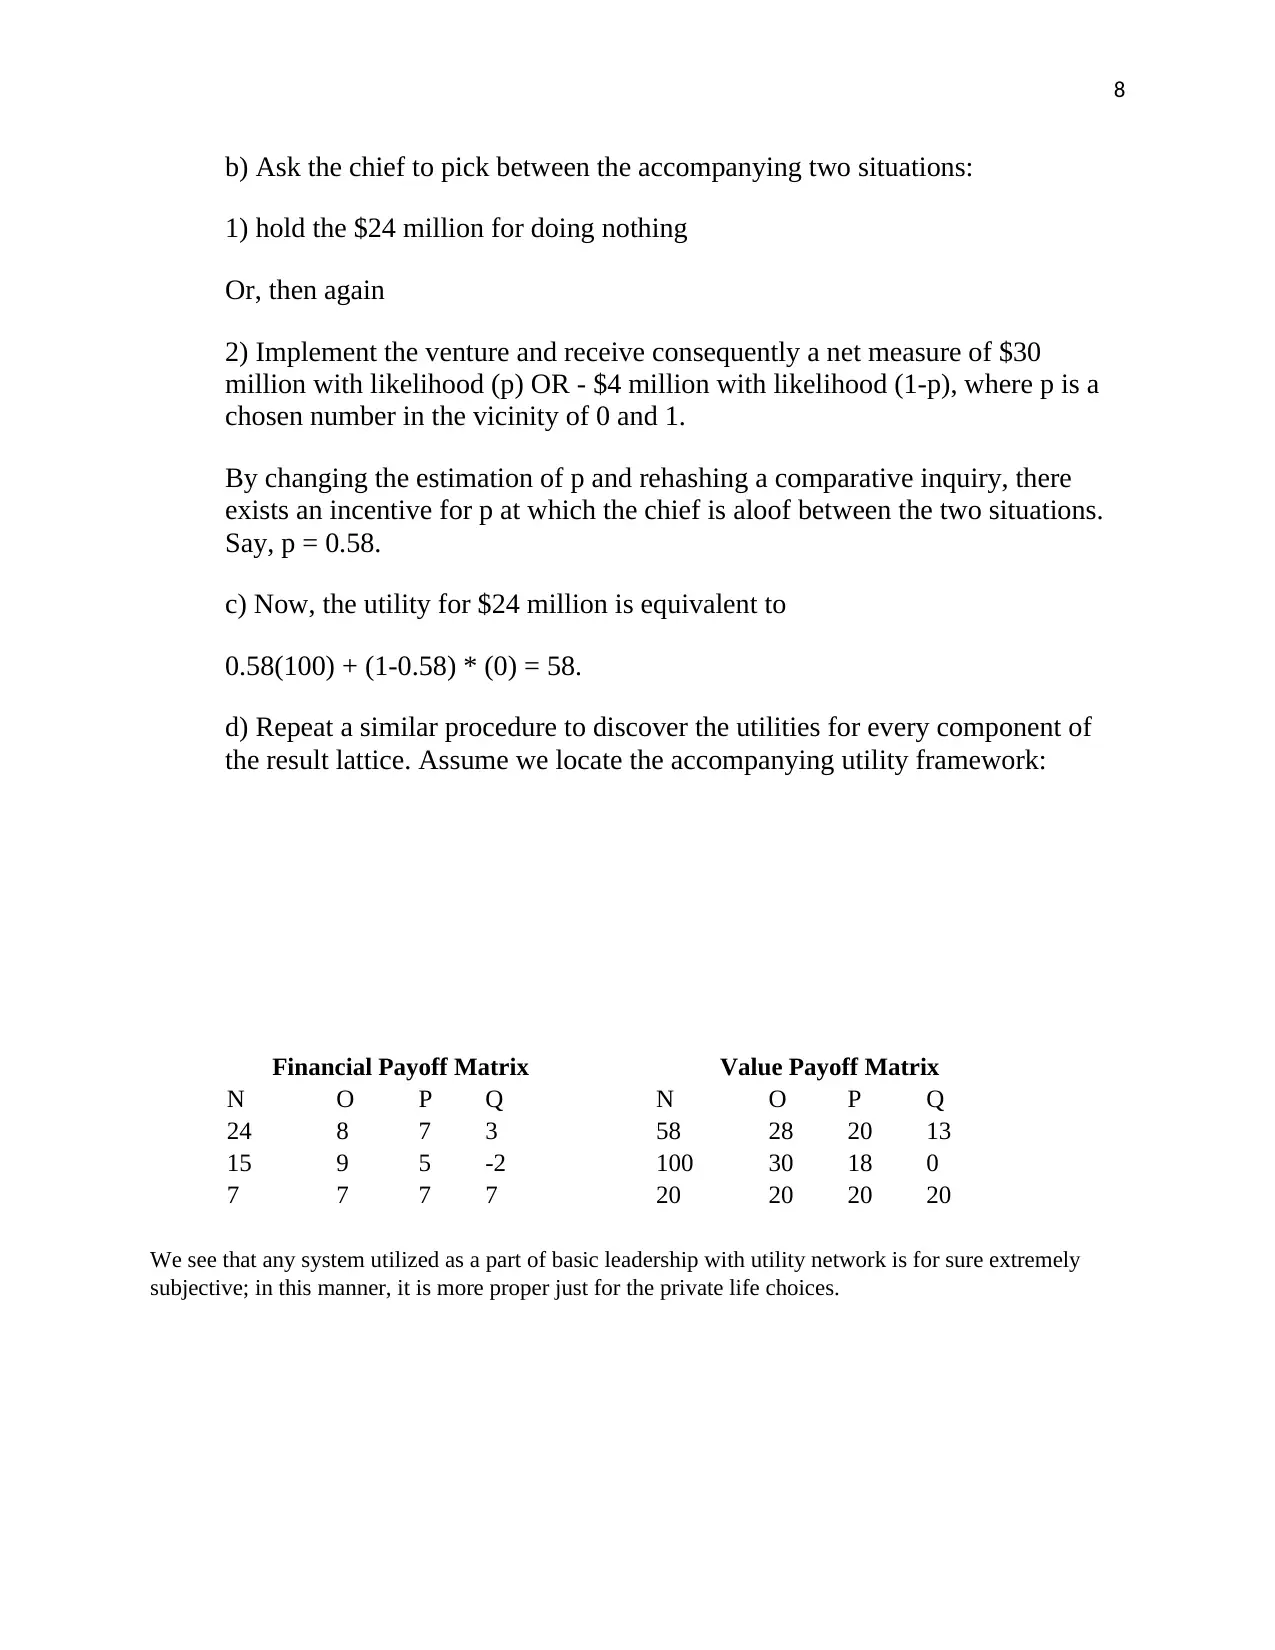
d) Repeat a similar procedure to discover the utilities for every component of
the result lattice. Assume we locate the accompanying utility framework:
Financial Payoff Matrix Value Payoff Matrix
N O P Q N O P Q
24 8 7 3 58 28 20 13
15 9 5 -2 100 30 18 0
7 7 7 7 20 20 20 20
We see that any system utilized as a part of basic leadership with utility network is for sure extremely
subjective; in this manner, it is more proper just for the private life choices.
b) Ask the chief to pick between the accompanying two situations:
1) hold the $24 million for doing nothing
Or, then again
2) Implement the venture and receive consequently a net measure of $30
million with likelihood (p) OR - $4 million with likelihood (1-p), where p is a
chosen number in the vicinity of 0 and 1.
By changing the estimation of p and rehashing a comparative inquiry, there
exists an incentive for p at which the chief is aloof between the two situations.
Say, p = 0.58.
c) Now, the utility for $24 million is equivalent to
0.58(100) + (1-0.58) * (0) = 58.
d) Repeat a similar procedure to discover the utilities for every component of
the result lattice. Assume we locate the accompanying utility framework:
Financial Payoff Matrix Value Payoff Matrix
N O P Q N O P Q
24 8 7 3 58 28 20 13
15 9 5 -2 100 30 18 0
7 7 7 7 20 20 20 20
We see that any system utilized as a part of basic leadership with utility network is for sure extremely
subjective; in this manner, it is more proper just for the private life choices.
9
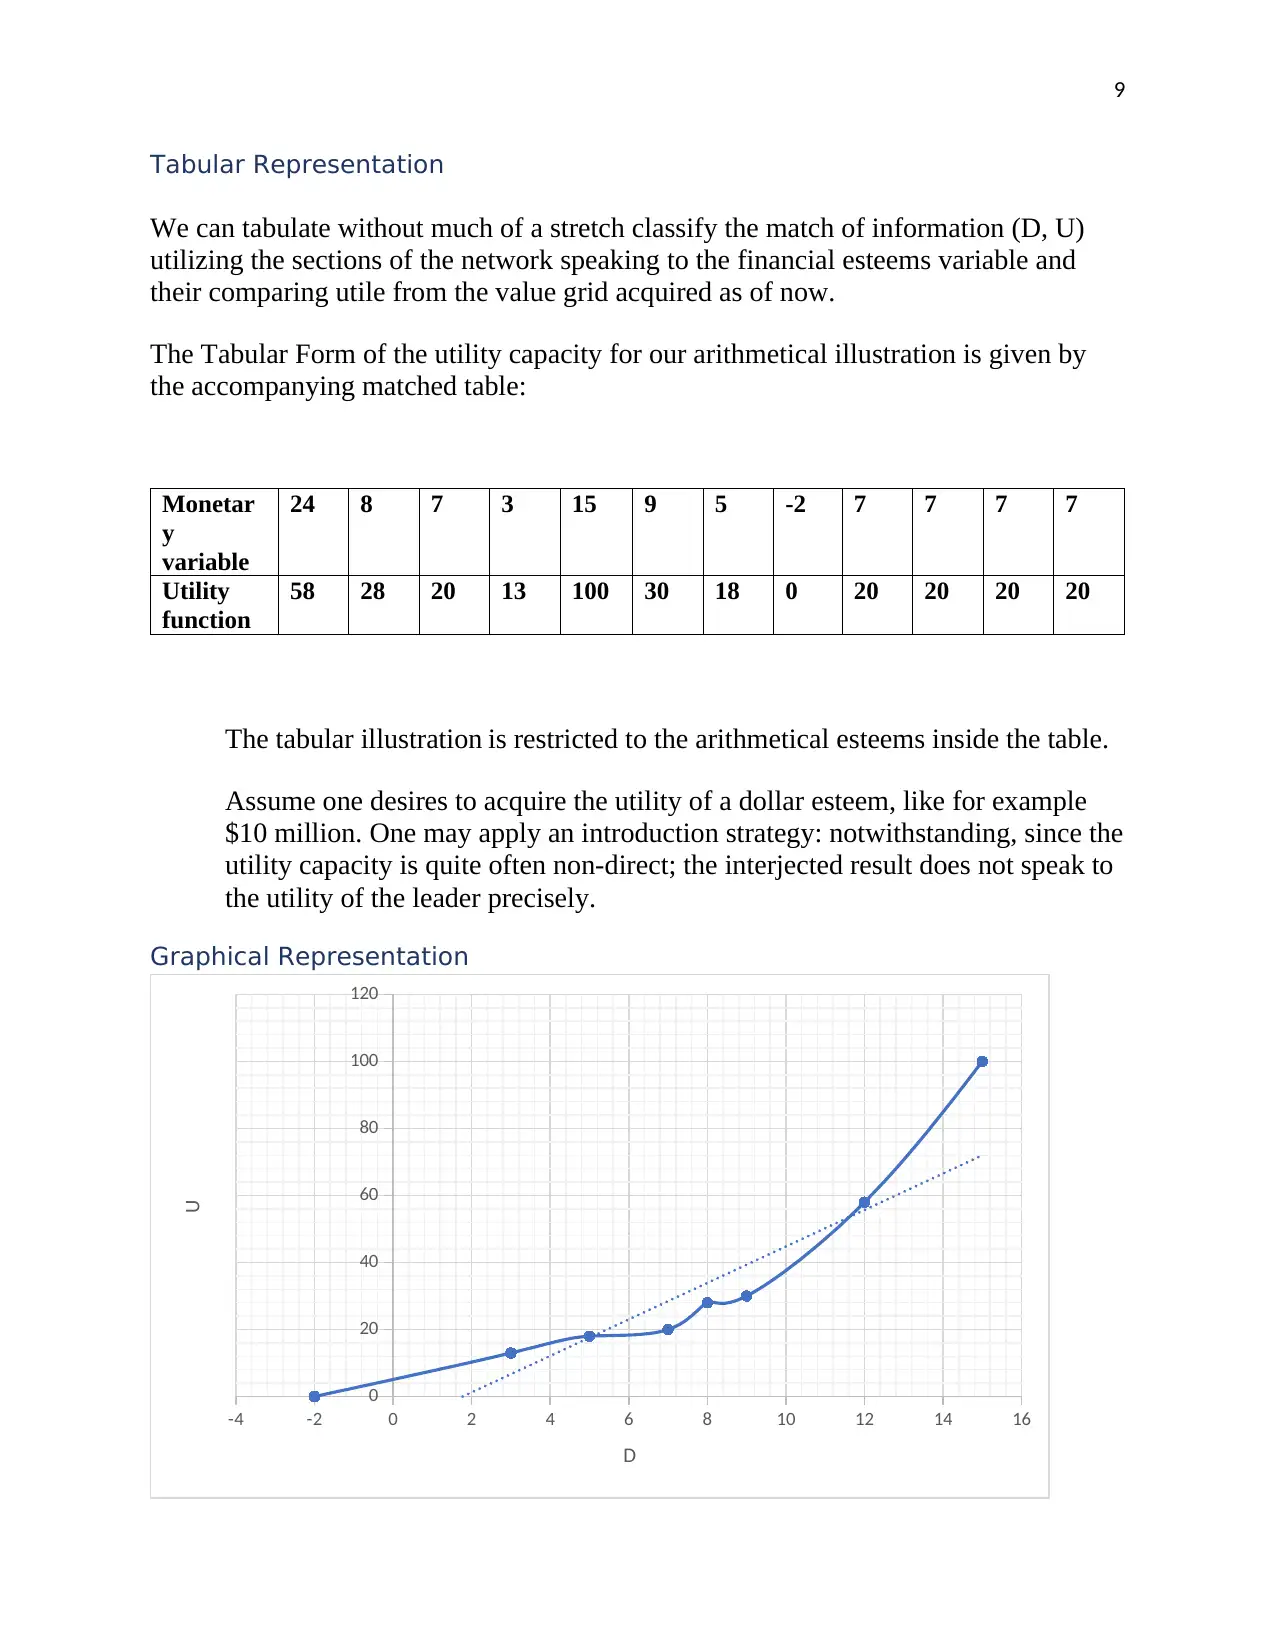
Tabular Representation
We can tabulate without much of a stretch classify the match of information (D, U)
utilizing the sections of the network speaking to the financial esteems variable and
their comparing utile from the value grid acquired as of now.
The Tabular Form of the utility capacity for our arithmetical illustration is given by
the accompanying matched table:
Monetar
y
variable
24 8 7 3 15 9 5 -2 7 7 7 7
Utility
function
58 28 20 13 100 30 18 0 20 20 20 20
The tabular illustration is restricted to the arithmetical esteems inside the table.
Assume one desires to acquire the utility of a dollar esteem, like for example
$10 million. One may apply an introduction strategy: notwithstanding, since the
utility capacity is quite often non-direct; the interjected result does not speak to
the utility of the leader precisely.
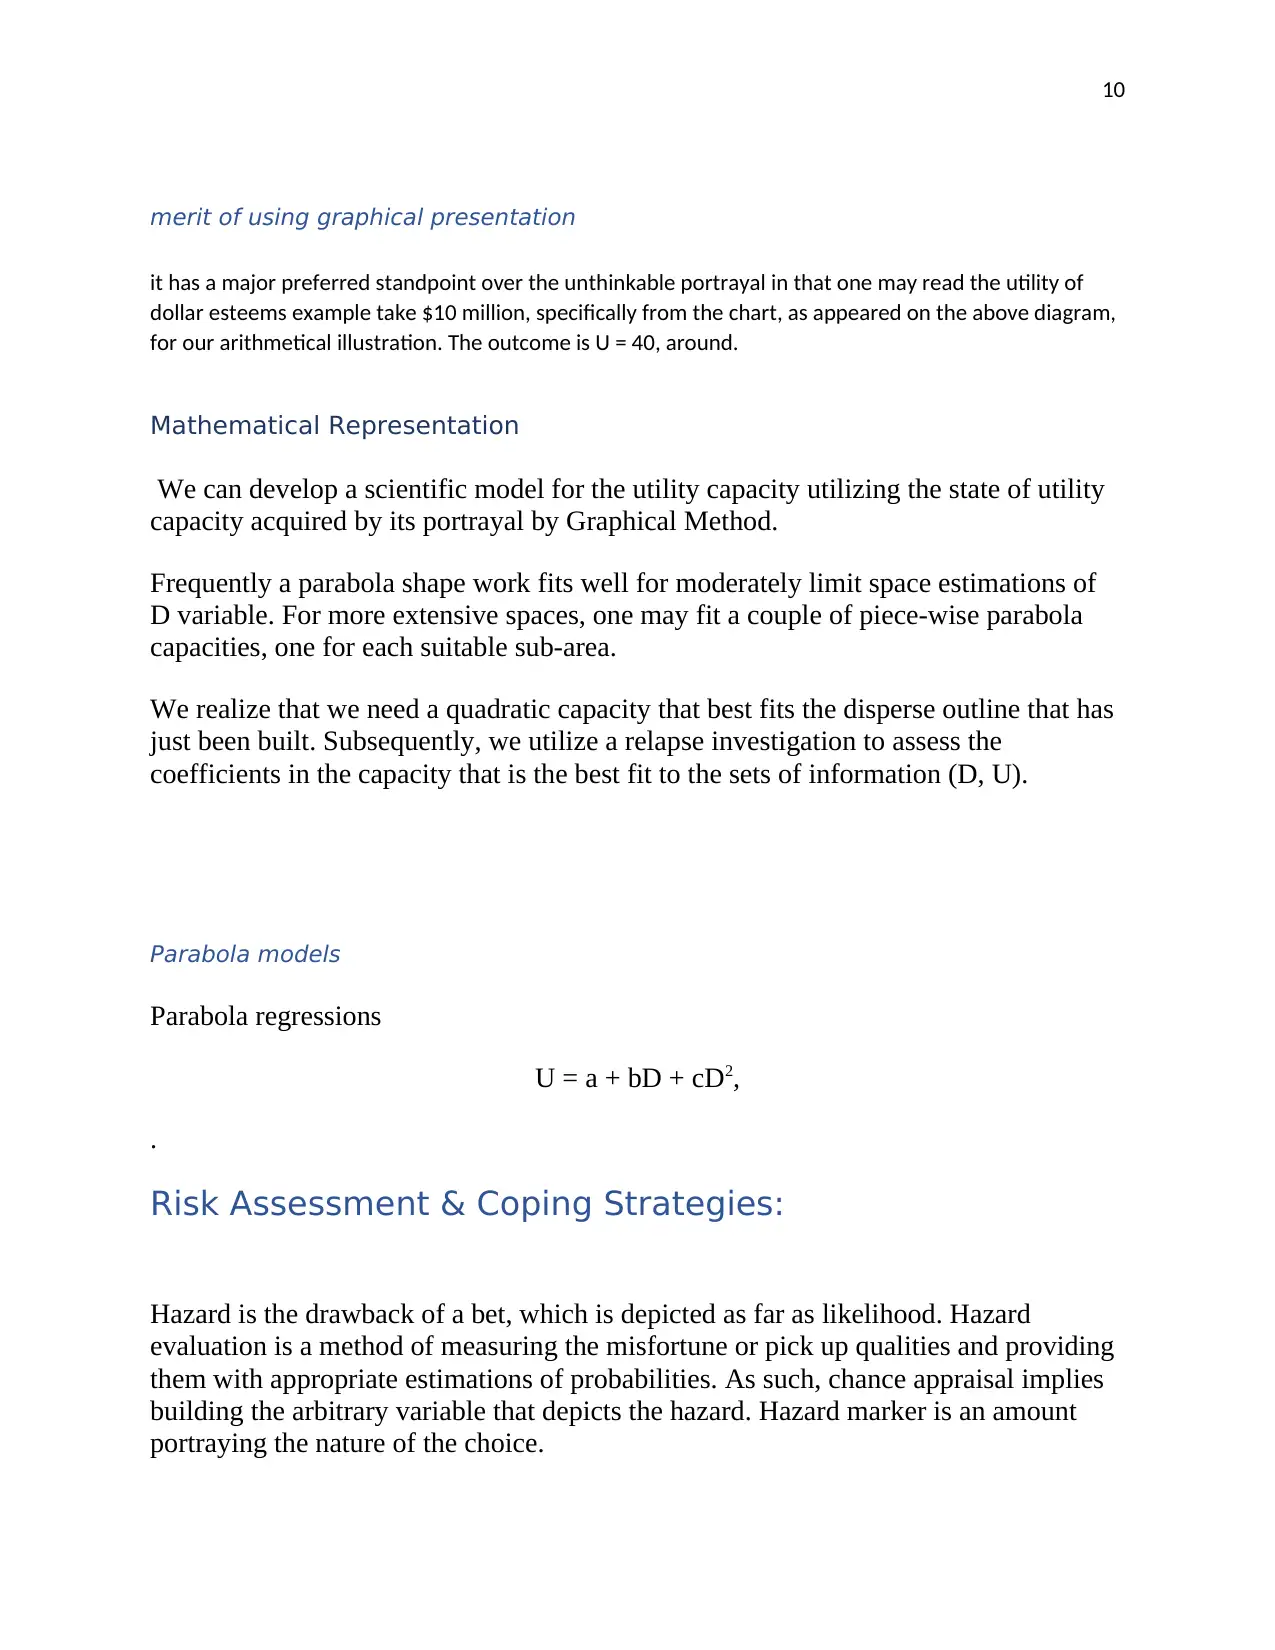
Graphical Representation
-4 -2 0 2 4 6 8 10 12 14 16
0
20
40
60
80
100
120
D
U
Tabular Representation
We can tabulate without much of a stretch classify the match of information (D, U)
utilizing the sections of the network speaking to the financial esteems variable and
their comparing utile from the value grid acquired as of now.
The Tabular Form of the utility capacity for our arithmetical illustration is given by
the accompanying matched table:
Monetar
y
variable
24 8 7 3 15 9 5 -2 7 7 7 7
Utility
function
58 28 20 13 100 30 18 0 20 20 20 20
The tabular illustration is restricted to the arithmetical esteems inside the table.
Assume one desires to acquire the utility of a dollar esteem, like for example
$10 million. One may apply an introduction strategy: notwithstanding, since the
utility capacity is quite often non-direct; the interjected result does not speak to
the utility of the leader precisely.
Graphical Representation
-4 -2 0 2 4 6 8 10 12 14 16
0
20
40
60
80
100
120
D
U
⊘ This is a preview!⊘
Do you want full access?
Subscribe today to unlock all pages.
Trusted by 1+ million students worldwide
10
merit of using graphical presentation
it has a major preferred standpoint over the unthinkable portrayal in that one may read the utility of
dollar esteems example take $10 million, specifically from the chart, as appeared on the above diagram,
for our arithmetical illustration. The outcome is U = 40, around.
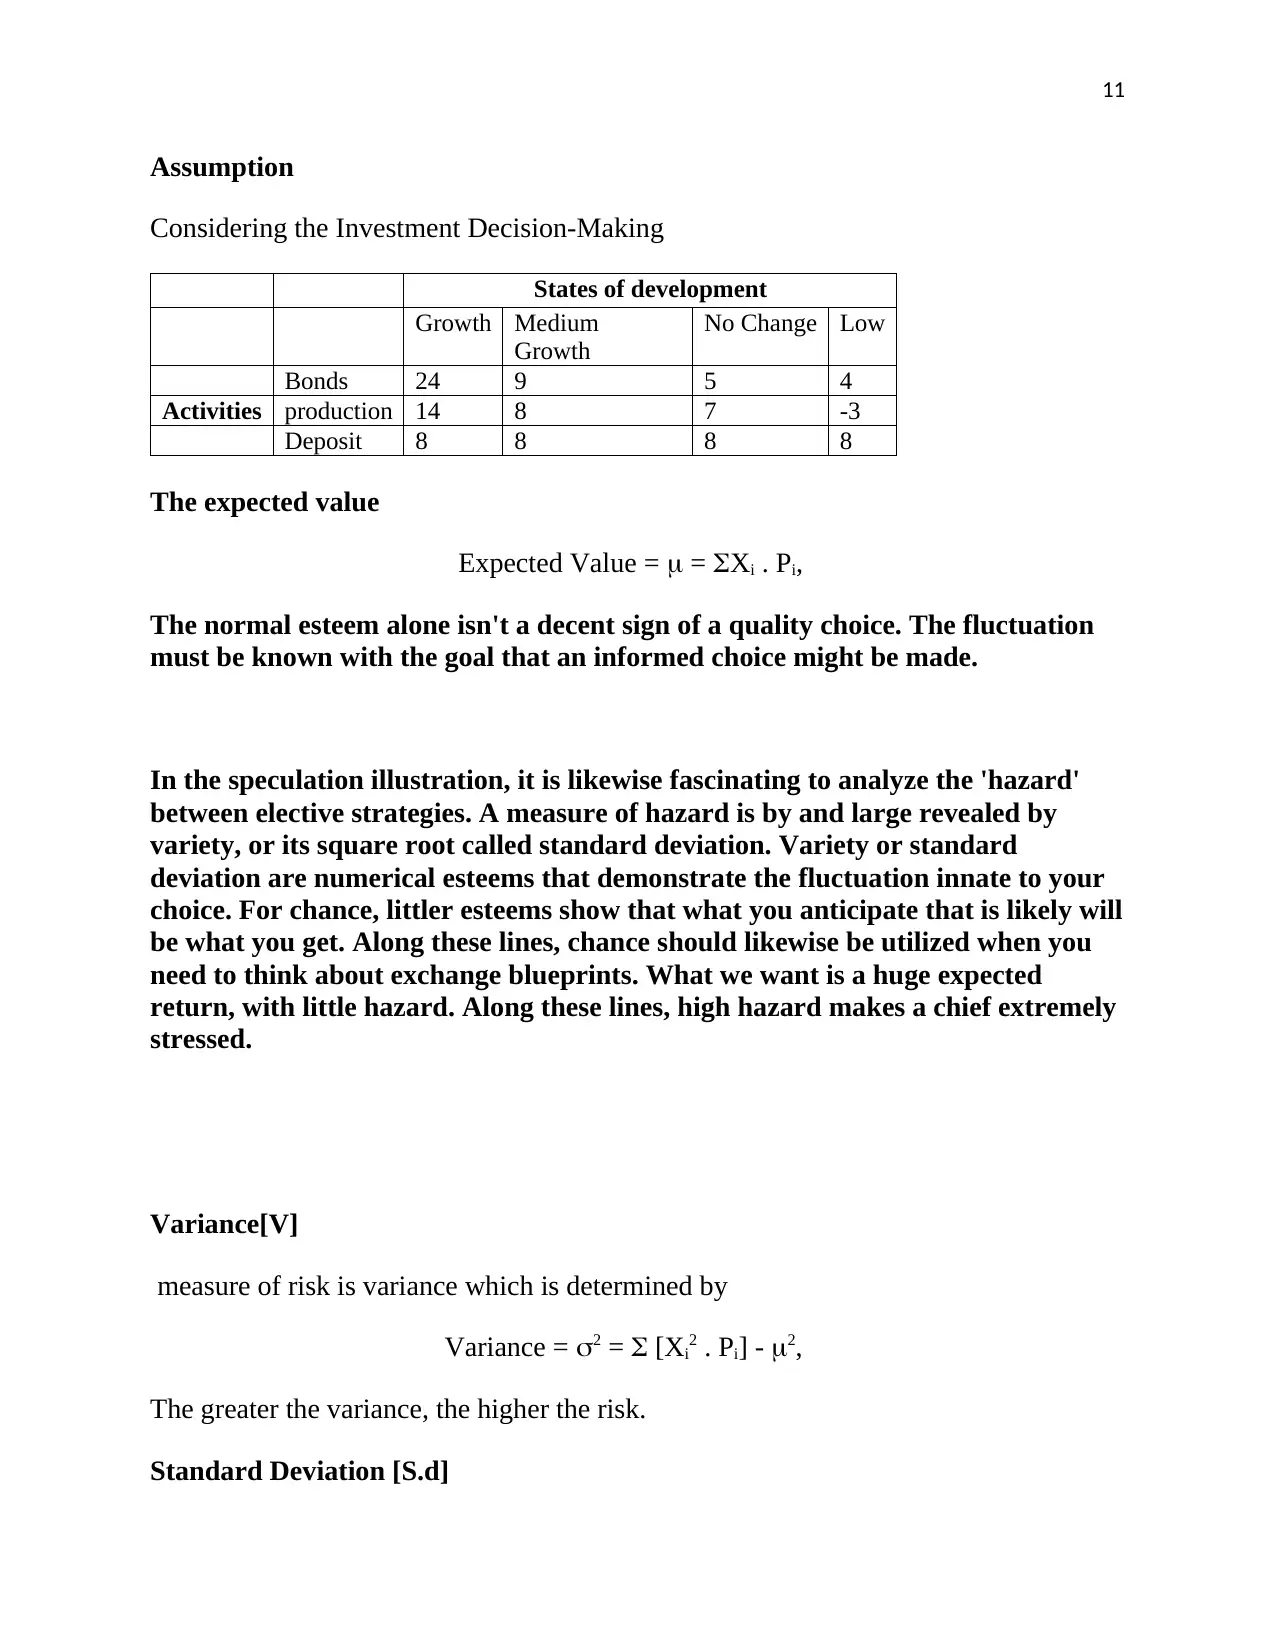
Mathematical Representation
We can develop a scientific model for the utility capacity utilizing the state of utility
capacity acquired by its portrayal by Graphical Method.
Frequently a parabola shape work fits well for moderately limit space estimations of
D variable. For more extensive spaces, one may fit a couple of piece-wise parabola
capacities, one for each suitable sub-area.
We realize that we need a quadratic capacity that best fits the disperse outline that has
just been built. Subsequently, we utilize a relapse investigation to assess the
coefficients in the capacity that is the best fit to the sets of information (D, U).
Parabola models
Parabola regressions
U = a + bD + cD2,
.
Risk Assessment & Coping Strategies:
Hazard is the drawback of a bet, which is depicted as far as likelihood. Hazard
evaluation is a method of measuring the misfortune or pick up qualities and providing
them with appropriate estimations of probabilities. As such, chance appraisal implies
building the arbitrary variable that depicts the hazard. Hazard marker is an amount
portraying the nature of the choice.
merit of using graphical presentation
it has a major preferred standpoint over the unthinkable portrayal in that one may read the utility of
dollar esteems example take $10 million, specifically from the chart, as appeared on the above diagram,
for our arithmetical illustration. The outcome is U = 40, around.
Mathematical Representation
We can develop a scientific model for the utility capacity utilizing the state of utility
capacity acquired by its portrayal by Graphical Method.
Frequently a parabola shape work fits well for moderately limit space estimations of
D variable. For more extensive spaces, one may fit a couple of piece-wise parabola
capacities, one for each suitable sub-area.
We realize that we need a quadratic capacity that best fits the disperse outline that has
just been built. Subsequently, we utilize a relapse investigation to assess the
coefficients in the capacity that is the best fit to the sets of information (D, U).
Parabola models
Parabola regressions
U = a + bD + cD2,
.
Risk Assessment & Coping Strategies:
Hazard is the drawback of a bet, which is depicted as far as likelihood. Hazard
evaluation is a method of measuring the misfortune or pick up qualities and providing
them with appropriate estimations of probabilities. As such, chance appraisal implies
building the arbitrary variable that depicts the hazard. Hazard marker is an amount
portraying the nature of the choice.
Paraphrase This Document
Need a fresh take? Get an instant paraphrase of this document with our AI Paraphraser
11
Assumption
Considering the Investment Decision-Making
States of development
Growth Medium
Growth
No Change Low
Bonds 24 9 5 4
Activities production 14 8 7 -3
Deposit 8 8 8 8
The expected value
Expected Value = = Xi . Pi,
The normal esteem alone isn't a decent sign of a quality choice. The fluctuation
must be known with the goal that an informed choice might be made.
In the speculation illustration, it is likewise fascinating to analyze the 'hazard'
between elective strategies. A measure of hazard is by and large revealed by
variety, or its square root called standard deviation. Variety or standard
deviation are numerical esteems that demonstrate the fluctuation innate to your
choice. For chance, littler esteems show that what you anticipate that is likely will
be what you get. Along these lines, chance should likewise be utilized when you
need to think about exchange blueprints. What we want is a huge expected
return, with little hazard. Along these lines, high hazard makes a chief extremely
stressed.
Variance[V]
measure of risk is variance which is determined by
Variance = 2 = [Xi2 . Pi] - 2,
The greater the variance, the higher the risk.
Standard Deviation [S.d]
12
Standard Deviation = = √variance
Both V and S.d provide the same information. That is a process of calculating
standard deviation always involves calculating the variance. Because standard
deviation is the square root of the variance.
The Volatility measures
= standard deviation
√timeduration
.
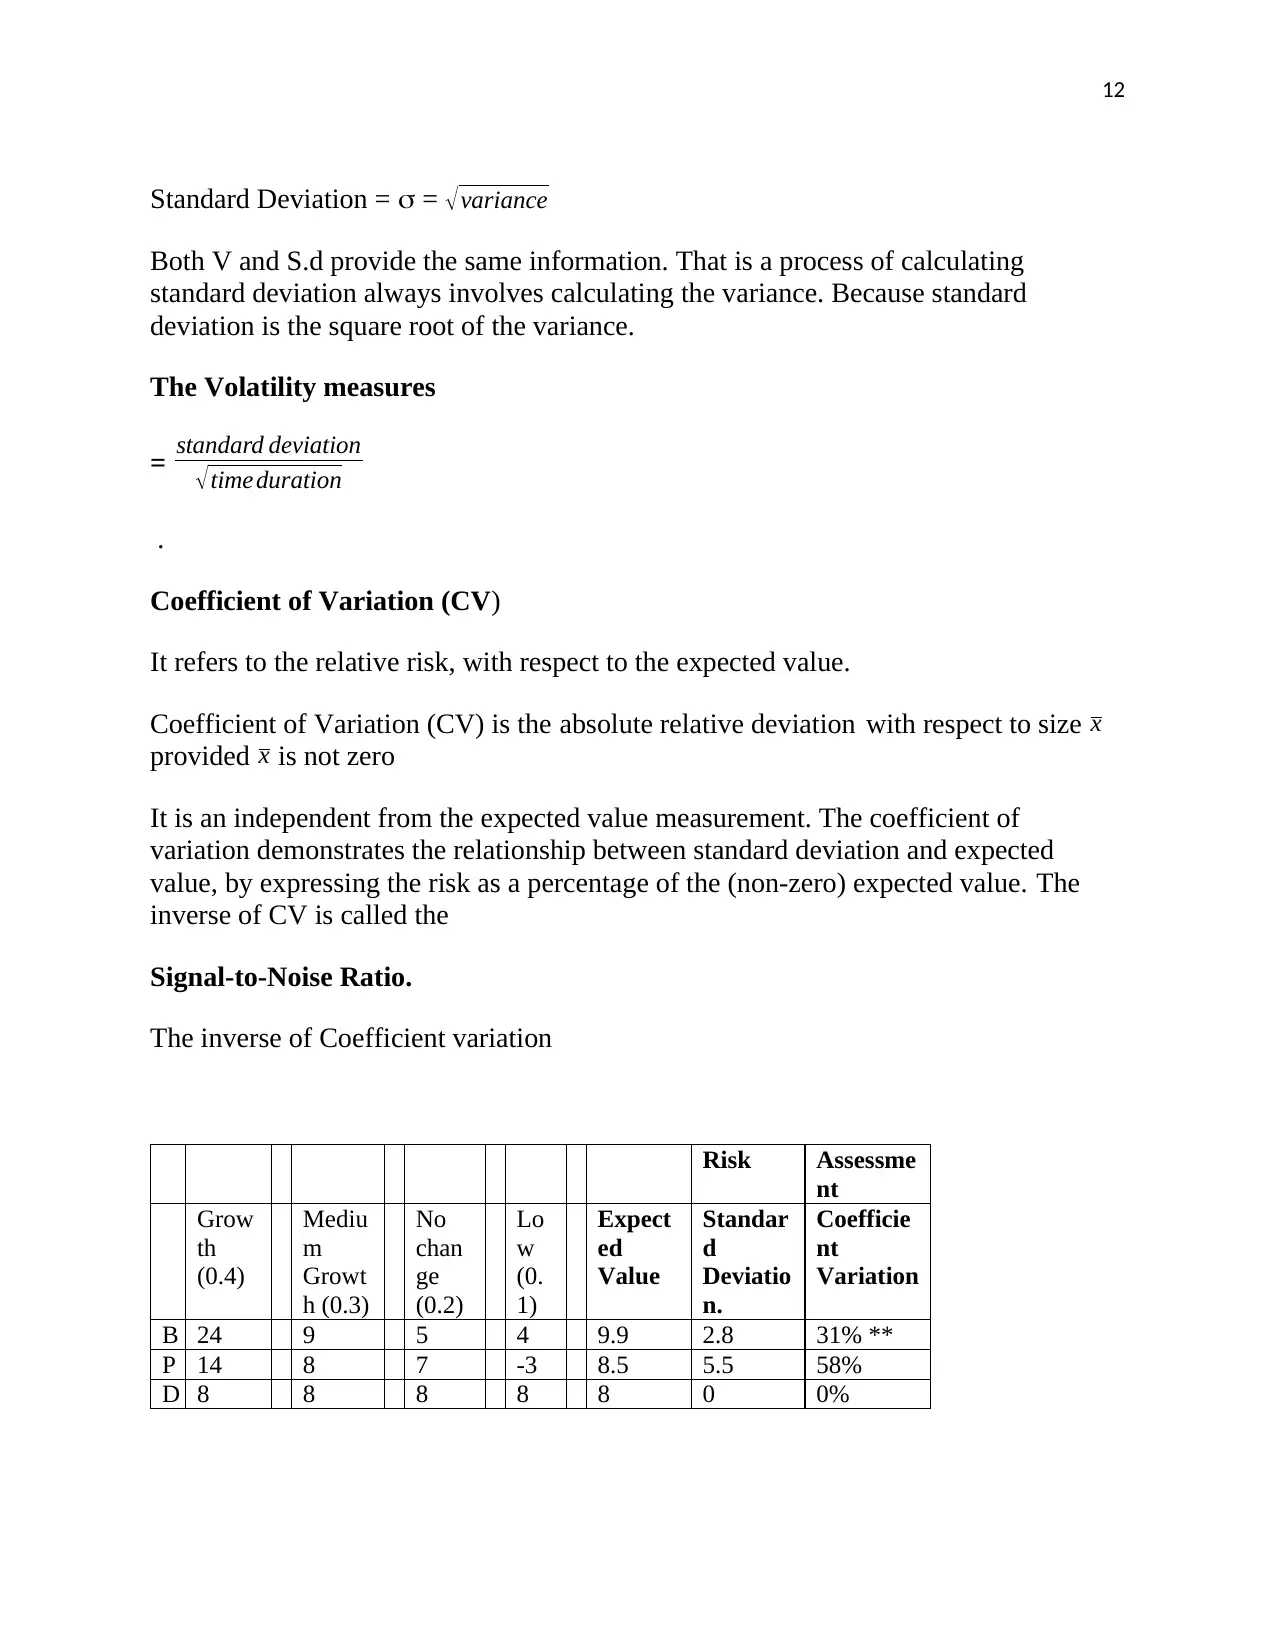
Coefficient of Variation (CV)
It refers to the relative risk, with respect to the expected value.
Coefficient of Variation (CV) is the absolute relative deviation with respect to size x
provided x is not zero
It is an independent from the expected value measurement. The coefficient of
variation demonstrates the relationship between standard deviation and expected
value, by expressing the risk as a percentage of the (non-zero) expected value. The
inverse of CV is called the
Signal-to-Noise Ratio.
The inverse of Coefficient variation
Risk Assessme
nt
Grow
th
(0.4)
Mediu
m
Growt
h (0.3)
No
chan
ge
(0.2)
Lo
w
(0.
1)
Expect
ed
Value
Standar
d
Deviatio
n.
Coefficie
nt
Variation
B 24 9 5 4 9.9 2.8 31% **
P 14 8 7 -3 8.5 5.5 58%
D 8 8 8 8 8 0 0%
Standard Deviation = = √variance
Both V and S.d provide the same information. That is a process of calculating
standard deviation always involves calculating the variance. Because standard
deviation is the square root of the variance.
The Volatility measures
= standard deviation
√timeduration
.
Coefficient of Variation (CV)
It refers to the relative risk, with respect to the expected value.
Coefficient of Variation (CV) is the absolute relative deviation with respect to size x
provided x is not zero
It is an independent from the expected value measurement. The coefficient of
variation demonstrates the relationship between standard deviation and expected
value, by expressing the risk as a percentage of the (non-zero) expected value. The
inverse of CV is called the
Signal-to-Noise Ratio.
The inverse of Coefficient variation
Risk Assessme
nt
Grow
th
(0.4)
Mediu
m
Growt
h (0.3)
No
chan
ge
(0.2)
Lo
w
(0.
1)
Expect
ed
Value
Standar
d
Deviatio
n.
Coefficie
nt
Variation
B 24 9 5 4 9.9 2.8 31% **
P 14 8 7 -3 8.5 5.5 58%
D 8 8 8 8 8 0 0%
⊘ This is a preview!⊘
Do you want full access?
Subscribe today to unlock all pages.
Trusted by 1+ million students worldwide
1 out of 15
Your All-in-One AI-Powered Toolkit for Academic Success.
+13062052269
info@desklib.com
Available 24*7 on WhatsApp / Email
![[object Object]](/_next/static/media/star-bottom.7253800d.svg)
Unlock your academic potential
Copyright © 2020–2026 A2Z Services. All Rights Reserved. Developed and managed by ZUCOL.