Construction Business Strategy and Performance Analysis Report
VerifiedAdded on 2021/01/01
|24
|6713
|166
Report
AI Summary
This report provides a comprehensive analysis of the business strategies and financial performance of two Australian corporations, Mirvac Group and Stockland Group, for Hotel Properties Ltd. The analysis, conducted by a business management consultant, evaluates the companies' capital structure, leverage, liquidity, efficiency, performance measures, and growth potential based on their financial statements from 2013 to 2017. The report examines key financial ratios, including debt-to-equity, equity multiplier, current ratio, fixed asset turnover, total asset turnover, return on total assets, and net profit ratio, to assess each company's financial health and operational effectiveness. The consultant's findings and ratio interpretations are presented to aid in making recommendations regarding potential future collaboration between Hotel Properties Ltd and either Mirvac or Stockland Group, aiming to strengthen the company's presence in the South East Asia and Australasia regions. The report concludes with a summary of the findings and recommendations for collaboration.

Construction Business
Strategy and
Entrepreneurship
Strategy and
Entrepreneurship
Paraphrase This Document
Need a fresh take? Get an instant paraphrase of this document with our AI Paraphraser
Table of Contents
INTRODUCTION...........................................................................................................................1
TASK...............................................................................................................................................1
1. Examine and discuss the overall performance of each corporations......................................1
2 Comparison of the overall performance of the corporations..................................................8
3. Recommendations to Mr. Benson Evans regarding collaboration........................................11
4. Justification for recommendation..........................................................................................12
CONCLUSION..............................................................................................................................13
REFERENCES..............................................................................................................................14
APPENDIX....................................................................................................................................15
INTRODUCTION
Business strategy defined as the long term plans and goals of the organisation and it is
implemented to lead the business towards growth. It takes the business to a powerful competitive
position and financial execution. Business strategies are formed by the management of the
organisation to attain the predetermined goals and objectives (Benavides-Velasco, Quintana-
García and Guzmán-Parra, 2013). Entrepreneurship is the function of leading, running and
launching a business that have long term goals to be achieved. It is the ability of an entrepreneur
to develop a running business or a new business start-up.
This report is based on a comparison of two different corporations, Mirvac group and
Stockland group. Hotel Properties Ltd is one of the leading resort development corporations in
Singapore. It is willing to collaborate with one the corporation from Mirvac and Stockland
group. Business management consultant of Hotel Properties Ltd will examine the overall
performance of these two corporations, it includes Capital structure, leverage, liquidity,
efficiency, performance and growth measures of the corporations. When the examinations is
done, then he will make recommendation according to the above mentioned factors. The
comparisons is based on the ratios and financial statements of the organisation.
TASK
1. Examine and discuss the overall performance of each corporations
Mirvac and Stockland Group are the two Australian corporations whose overall
performance will be evaluated by Business Management Consultant who is appointed by Mr.
Benson Evans ( the chief Operations Officer of Hotel Properties Limited ) so that he decide with
whom he wants to collaborate in future for strengthening its presence and market shares in South
East Asia and Australasia regions. For this evaluation business management consultant compares
both groups overall performance on the basis of last five years financial statement. Consultant
study companies capital structure and leverage. It also measures organisations liquidity,
efficiency, profitability position and their growth potentials.
a. Capital structure and leverage measures: Company's debt and equity combines to
form its capital structure. Organisation overall operations and development are finance by
several sources of funds which measure its leverage position (Brush, 2013). Mirvac and
1
⊘ This is a preview!⊘
Do you want full access?
Subscribe today to unlock all pages.
Trusted by 1+ million students worldwide
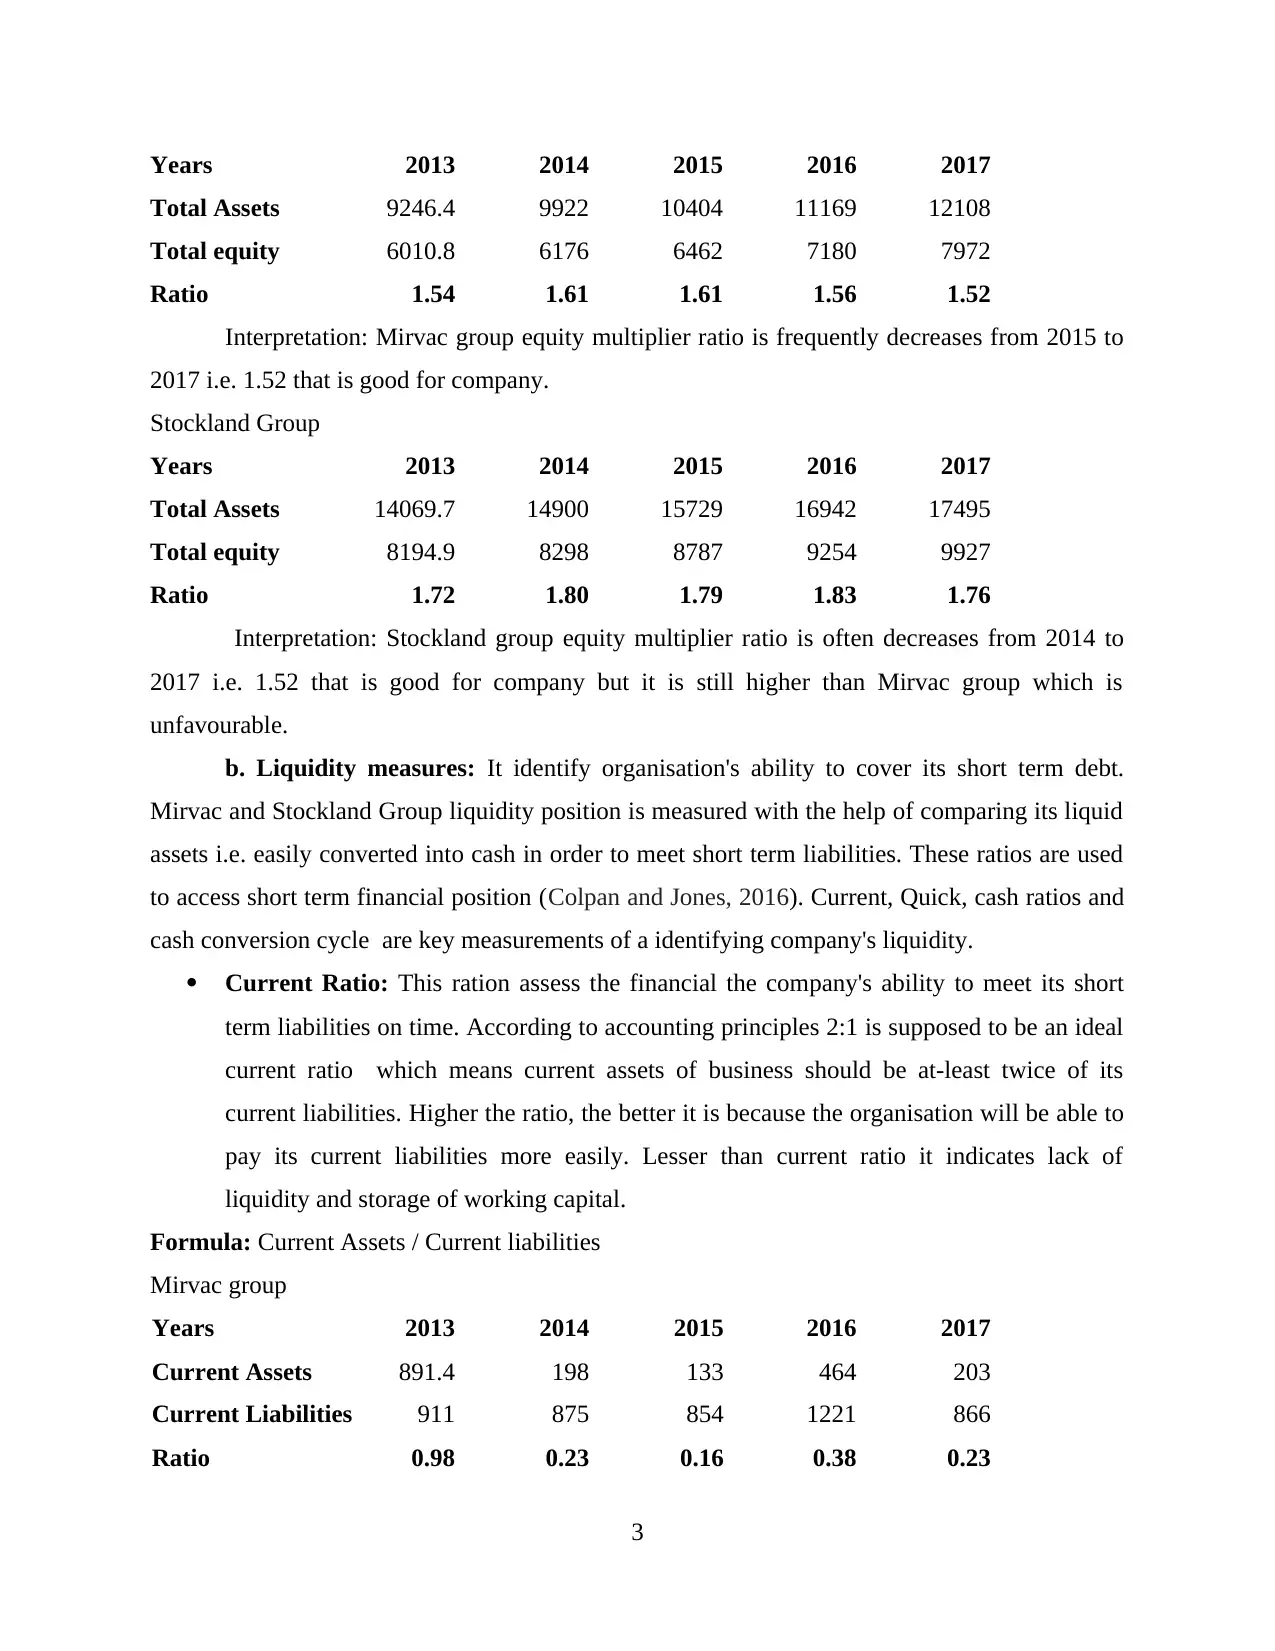
Stockland Group capital structures consist of long & short term borrowings, capital leases,
payables and accrued expenses, other liabilities, stockholder's equity.
Debt to Equity and Equity multiplier ratios are measured for calculating company's
capital structure. Higher leverage ratio refers to assertive capital structure which implies
company is using more debt than equity to finance its assets and lower leverage ratio means a
non-progressive capital structure where company finance assets with more equity than debt.
Debt to Equity Ratio: This ratio covers company's Financial leverage that indicates
amount of debt it is using to finance its assets related to the amount of shareholder's
equity (Bucheli and Wadhwani, 2014).
Below calculations are done on the basis of companies financial statements which are
attached in Appendix.
Formula: Total Debt / Total Equity
Mirvac group
Years 2013 2014 2015 2016 2017
Total debts 3235.6 3746 3941 3989 4136
Total equity 6010.8 6176 6462 7180 7972
Ratio 0.54 0.61 0.61 0.56 0.52
Interpretation: Mirvac group debt to equity ratio is lower than last year i.e. 0.52 which
shows company's favourable capital structure.
Stockland Group
Years 2013 2014 2015 2016 2017
Total debts 5874.8 6602 6942 7688 7568
Total equity 8194.9 8298 8787 9254 9927
Ratio 0.72 0.80 0.79 0.83 0.76
Interpretation: Stockland group debt to equity ratio is also lower than last year i.e. 0.76
but it is more than Mirvac group which is not considered as good capital structure.
Equity Multiplier: This ratio is also used to measure financial leverage of company
which is calculated by dividing total assets by total equity. It indicates the portion of
company's assets which are financed by equity (Burns, 2016).
Formula: Total Assets / Total Equity
Mirvac group
2
Paraphrase This Document
Need a fresh take? Get an instant paraphrase of this document with our AI Paraphraser
Years 2013 2014 2015 2016 2017
Total Assets 9246.4 9922 10404 11169 12108
Total equity 6010.8 6176 6462 7180 7972
Ratio 1.54 1.61 1.61 1.56 1.52
Interpretation: Mirvac group equity multiplier ratio is frequently decreases from 2015 to
2017 i.e. 1.52 that is good for company.
Stockland Group
Years 2013 2014 2015 2016 2017
Total Assets 14069.7 14900 15729 16942 17495
Total equity 8194.9 8298 8787 9254 9927
Ratio 1.72 1.80 1.79 1.83 1.76
Interpretation: Stockland group equity multiplier ratio is often decreases from 2014 to
2017 i.e. 1.52 that is good for company but it is still higher than Mirvac group which is
unfavourable.
b. Liquidity measures: It identify organisation's ability to cover its short term debt.
Mirvac and Stockland Group liquidity position is measured with the help of comparing its liquid
assets i.e. easily converted into cash in order to meet short term liabilities. These ratios are used
to access short term financial position (Colpan and Jones, 2016). Current, Quick, cash ratios and
cash conversion cycle are key measurements of a identifying company's liquidity.
Current Ratio: This ration assess the financial the company's ability to meet its short
term liabilities on time. According to accounting principles 2:1 is supposed to be an ideal
current ratio which means current assets of business should be at-least twice of its
current liabilities. Higher the ratio, the better it is because the organisation will be able to
pay its current liabilities more easily. Lesser than current ratio it indicates lack of
liquidity and storage of working capital.
Formula: Current Assets / Current liabilities
Mirvac group
Years 2013 2014 2015 2016 2017
Current Assets 891.4 198 133 464 203
Current Liabilities 911 875 854 1221 866
Ratio 0.98 0.23 0.16 0.38 0.23
3
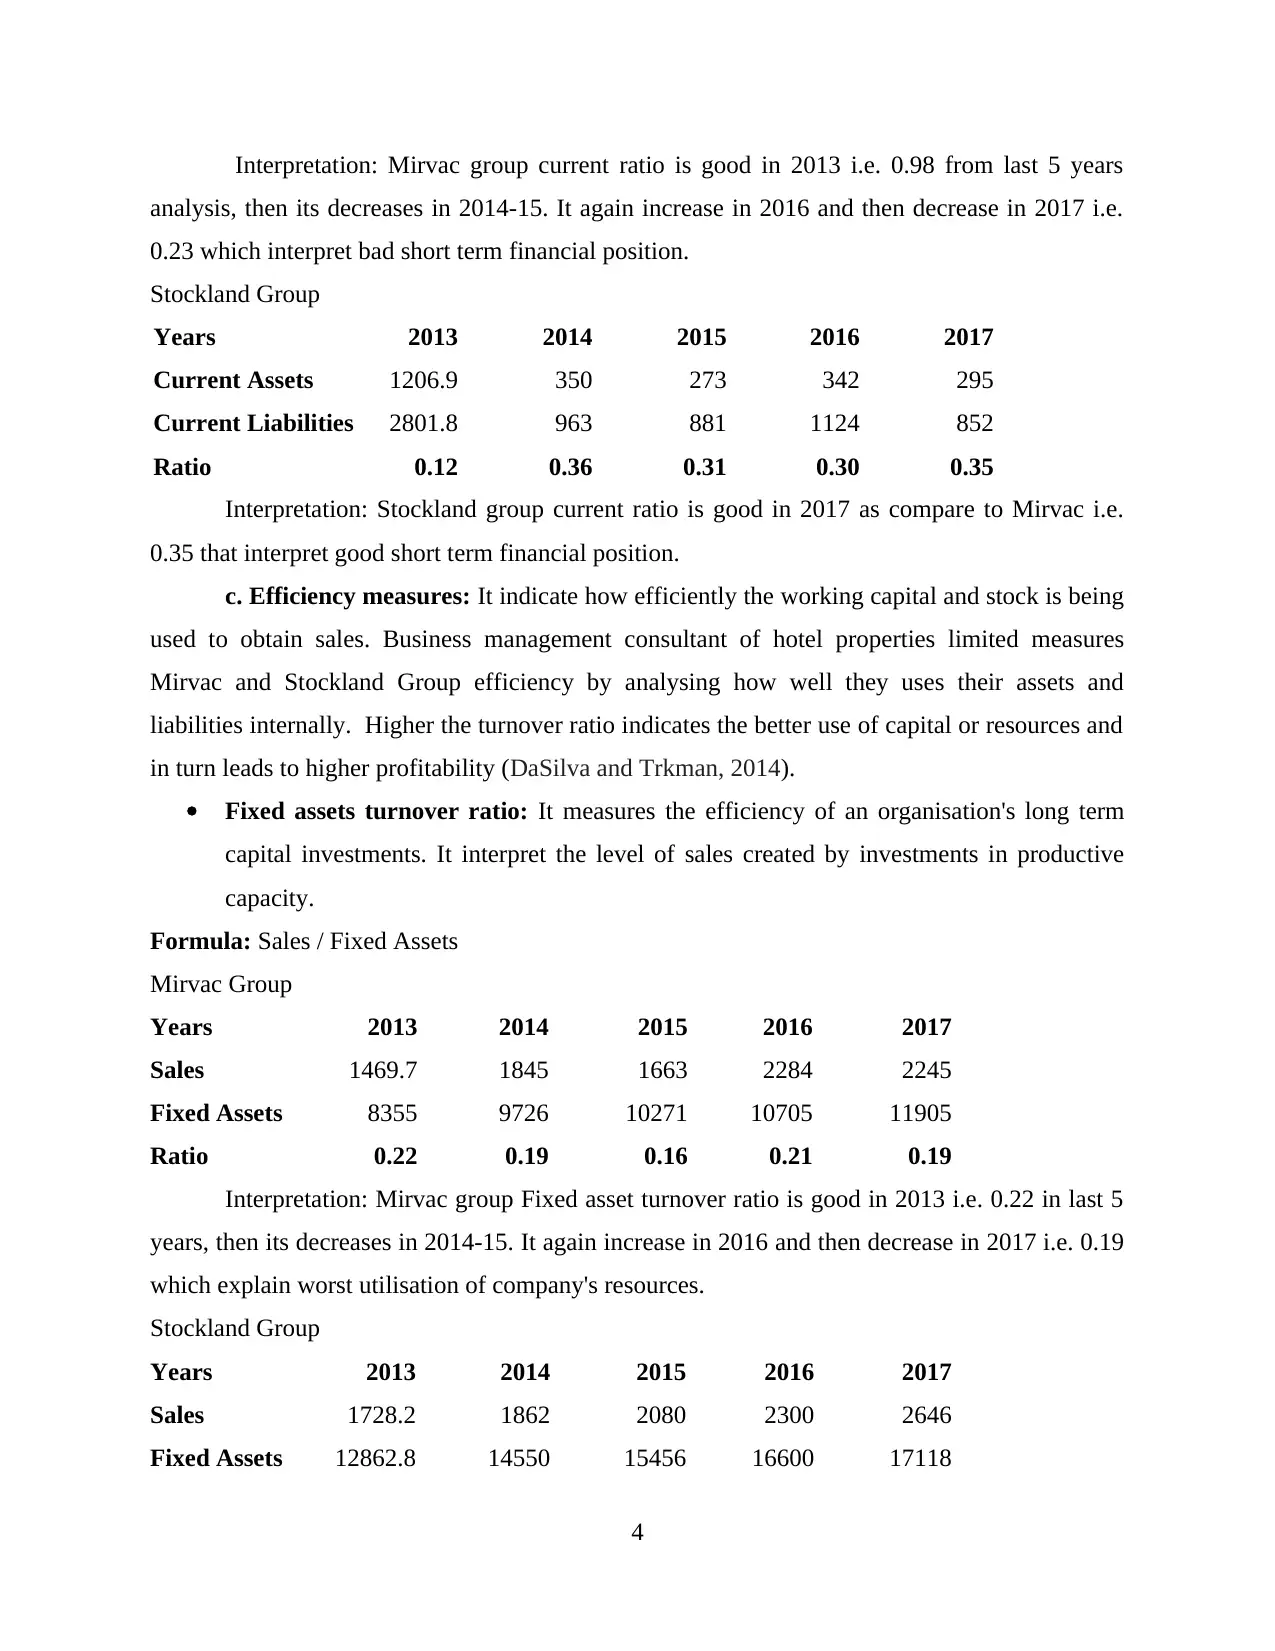
Interpretation: Mirvac group current ratio is good in 2013 i.e. 0.98 from last 5 years
analysis, then its decreases in 2014-15. It again increase in 2016 and then decrease in 2017 i.e.
0.23 which interpret bad short term financial position.
Stockland Group
Years 2013 2014 2015 2016 2017
Current Assets 1206.9 350 273 342 295
Current Liabilities 2801.8 963 881 1124 852
Ratio 0.12 0.36 0.31 0.30 0.35
Interpretation: Stockland group current ratio is good in 2017 as compare to Mirvac i.e.
0.35 that interpret good short term financial position.
c. Efficiency measures: It indicate how efficiently the working capital and stock is being
used to obtain sales. Business management consultant of hotel properties limited measures
Mirvac and Stockland Group efficiency by analysing how well they uses their assets and
liabilities internally. Higher the turnover ratio indicates the better use of capital or resources and
in turn leads to higher profitability (DaSilva and Trkman, 2014).
Fixed assets turnover ratio: It measures the efficiency of an organisation's long term
capital investments. It interpret the level of sales created by investments in productive
capacity.
Formula: Sales / Fixed Assets
Mirvac Group
Years 2013 2014 2015 2016 2017
Sales 1469.7 1845 1663 2284 2245
Fixed Assets 8355 9726 10271 10705 11905
Ratio 0.22 0.19 0.16 0.21 0.19
Interpretation: Mirvac group Fixed asset turnover ratio is good in 2013 i.e. 0.22 in last 5
years, then its decreases in 2014-15. It again increase in 2016 and then decrease in 2017 i.e. 0.19
which explain worst utilisation of company's resources.
Stockland Group
Years 2013 2014 2015 2016 2017
Sales 1728.2 1862 2080 2300 2646
Fixed Assets 12862.8 14550 15456 16600 17118
4
⊘ This is a preview!⊘
Do you want full access?
Subscribe today to unlock all pages.
Trusted by 1+ million students worldwide
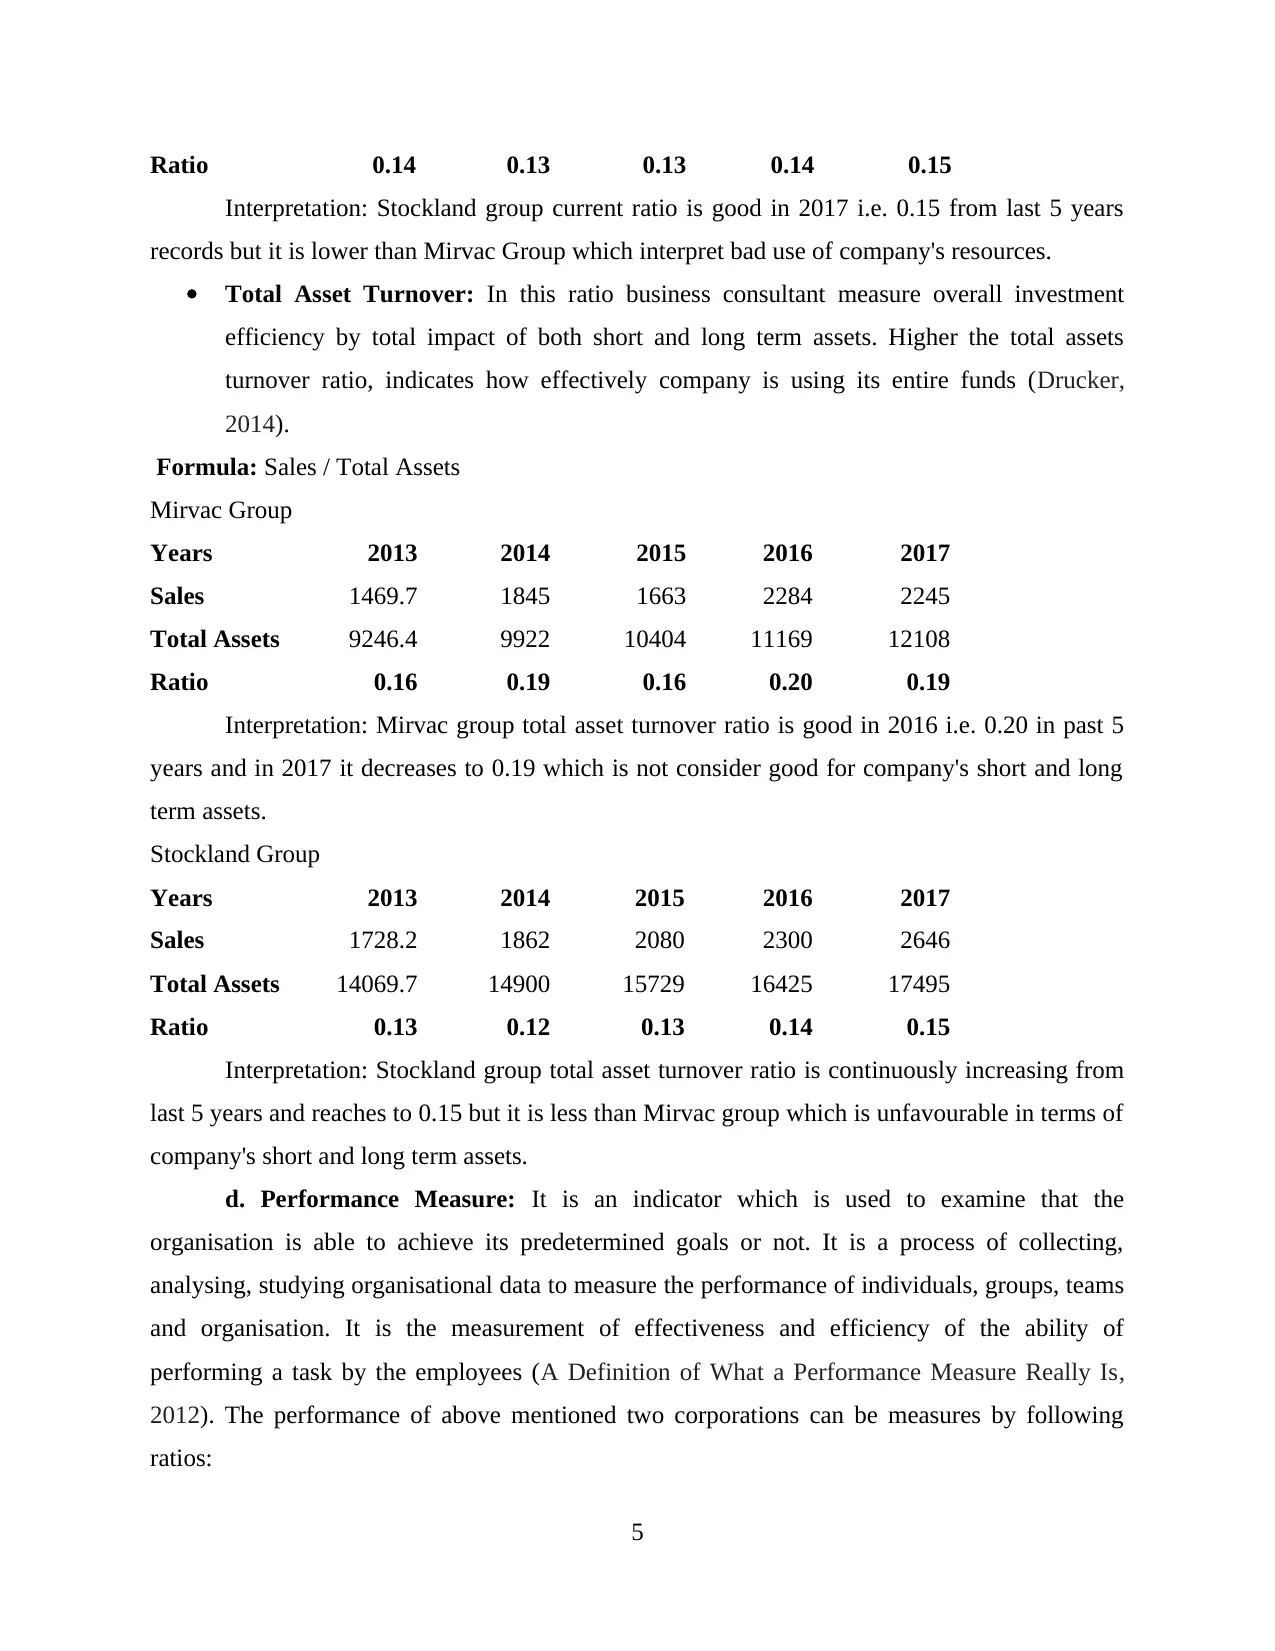
Ratio 0.14 0.13 0.13 0.14 0.15
Interpretation: Stockland group current ratio is good in 2017 i.e. 0.15 from last 5 years
records but it is lower than Mirvac Group which interpret bad use of company's resources.
Total Asset Turnover: In this ratio business consultant measure overall investment
efficiency by total impact of both short and long term assets. Higher the total assets
turnover ratio, indicates how effectively company is using its entire funds (Drucker,
2014).
Formula: Sales / Total Assets
Mirvac Group
Years 2013 2014 2015 2016 2017
Sales 1469.7 1845 1663 2284 2245
Total Assets 9246.4 9922 10404 11169 12108
Ratio 0.16 0.19 0.16 0.20 0.19
Interpretation: Mirvac group total asset turnover ratio is good in 2016 i.e. 0.20 in past 5
years and in 2017 it decreases to 0.19 which is not consider good for company's short and long
term assets.
Stockland Group
Years 2013 2014 2015 2016 2017
Sales 1728.2 1862 2080 2300 2646
Total Assets 14069.7 14900 15729 16425 17495
Ratio 0.13 0.12 0.13 0.14 0.15
Interpretation: Stockland group total asset turnover ratio is continuously increasing from
last 5 years and reaches to 0.15 but it is less than Mirvac group which is unfavourable in terms of
company's short and long term assets.
d. Performance Measure: It is an indicator which is used to examine that the
organisation is able to achieve its predetermined goals or not. It is a process of collecting,
analysing, studying organisational data to measure the performance of individuals, groups, teams
and organisation. It is the measurement of effectiveness and efficiency of the ability of
performing a task by the employees (A Definition of What a Performance Measure Really Is,
2012). The performance of above mentioned two corporations can be measures by following
ratios:
5
Paraphrase This Document
Need a fresh take? Get an instant paraphrase of this document with our AI Paraphraser
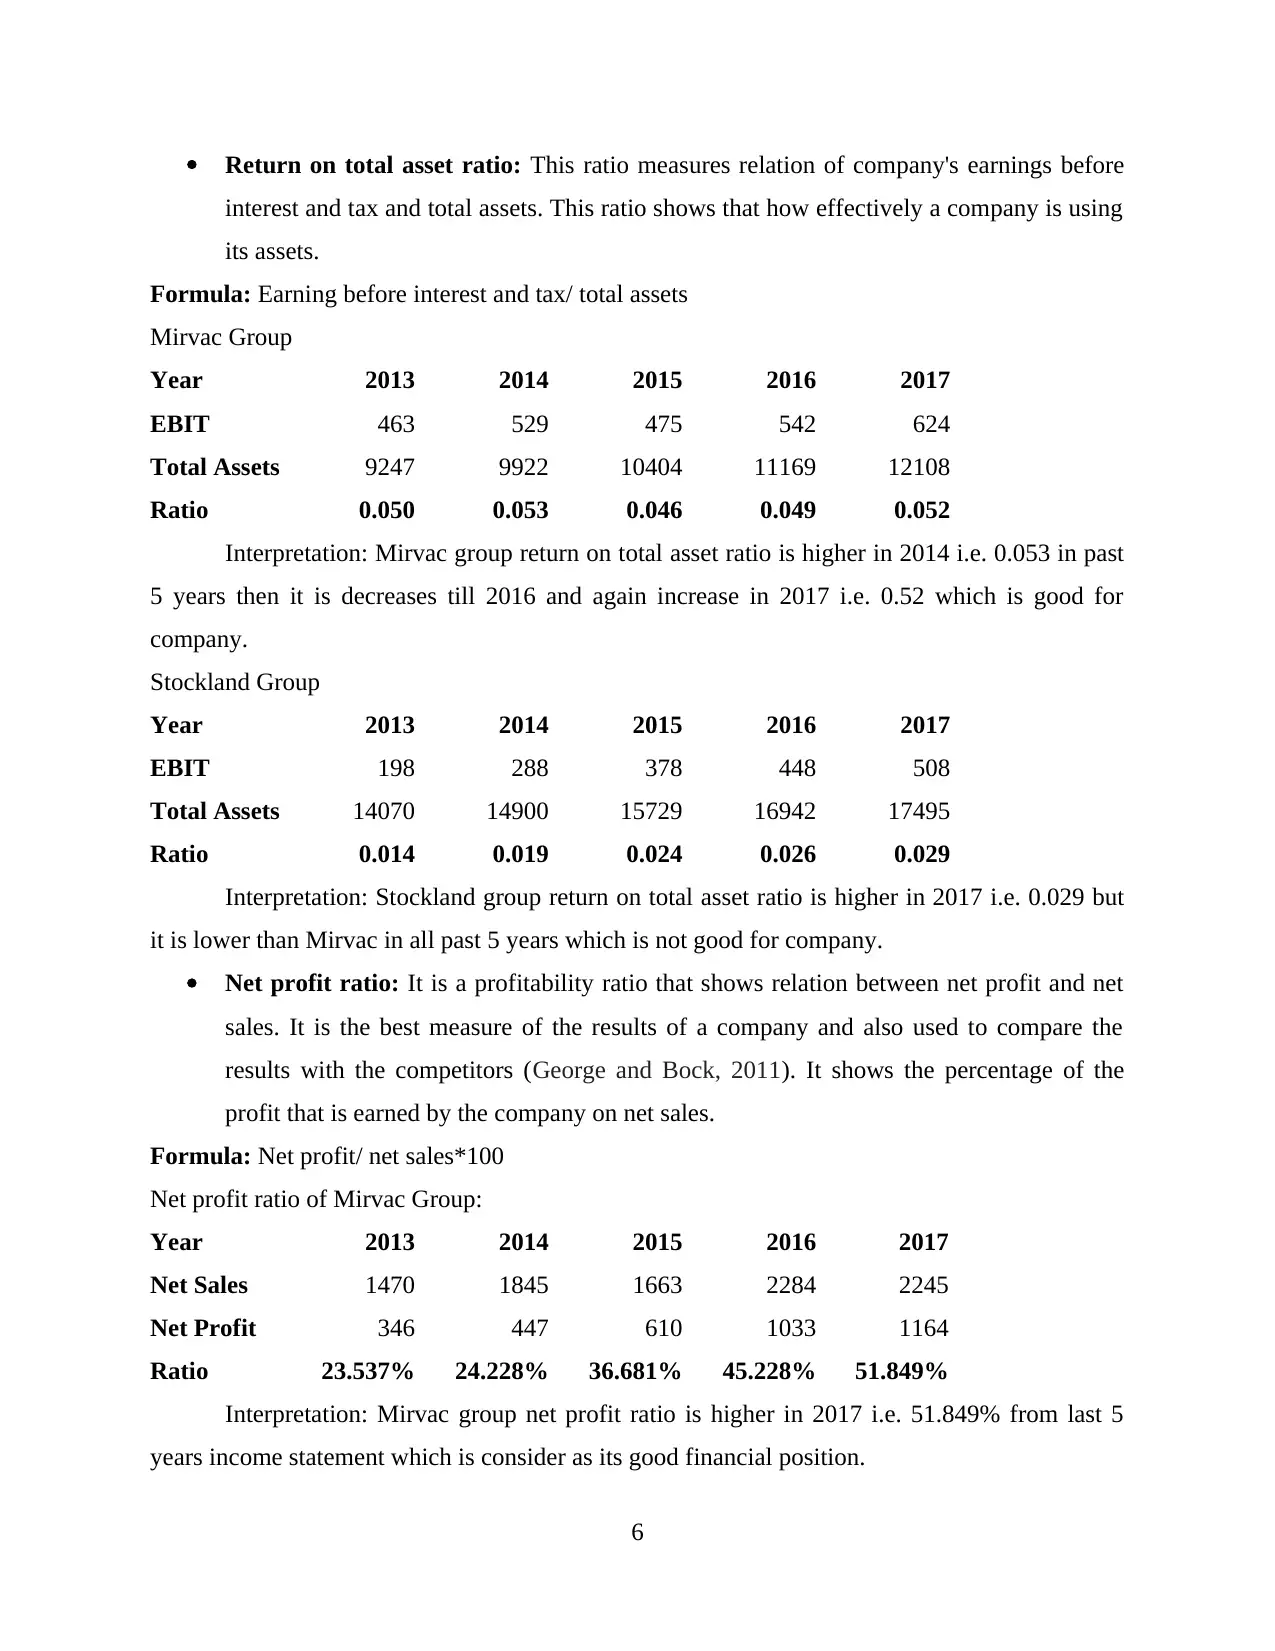
Return on total asset ratio: This ratio measures relation of company's earnings before
interest and tax and total assets. This ratio shows that how effectively a company is using
its assets.
Formula: Earning before interest and tax/ total assets
Mirvac Group
Year 2013 2014 2015 2016 2017
EBIT 463 529 475 542 624
Total Assets 9247 9922 10404 11169 12108
Ratio 0.050 0.053 0.046 0.049 0.052
Interpretation: Mirvac group return on total asset ratio is higher in 2014 i.e. 0.053 in past
5 years then it is decreases till 2016 and again increase in 2017 i.e. 0.52 which is good for
company.
Stockland Group
Year 2013 2014 2015 2016 2017
EBIT 198 288 378 448 508
Total Assets 14070 14900 15729 16942 17495
Ratio 0.014 0.019 0.024 0.026 0.029
Interpretation: Stockland group return on total asset ratio is higher in 2017 i.e. 0.029 but
it is lower than Mirvac in all past 5 years which is not good for company.
Net profit ratio: It is a profitability ratio that shows relation between net profit and net
sales. It is the best measure of the results of a company and also used to compare the
results with the competitors (George and Bock, 2011). It shows the percentage of the
profit that is earned by the company on net sales.
Formula: Net profit/ net sales*100
Net profit ratio of Mirvac Group:
Year 2013 2014 2015 2016 2017
Net Sales 1470 1845 1663 2284 2245
Net Profit 346 447 610 1033 1164
Ratio 23.537% 24.228% 36.681% 45.228% 51.849%
Interpretation: Mirvac group net profit ratio is higher in 2017 i.e. 51.849% from last 5
years income statement which is consider as its good financial position.
6
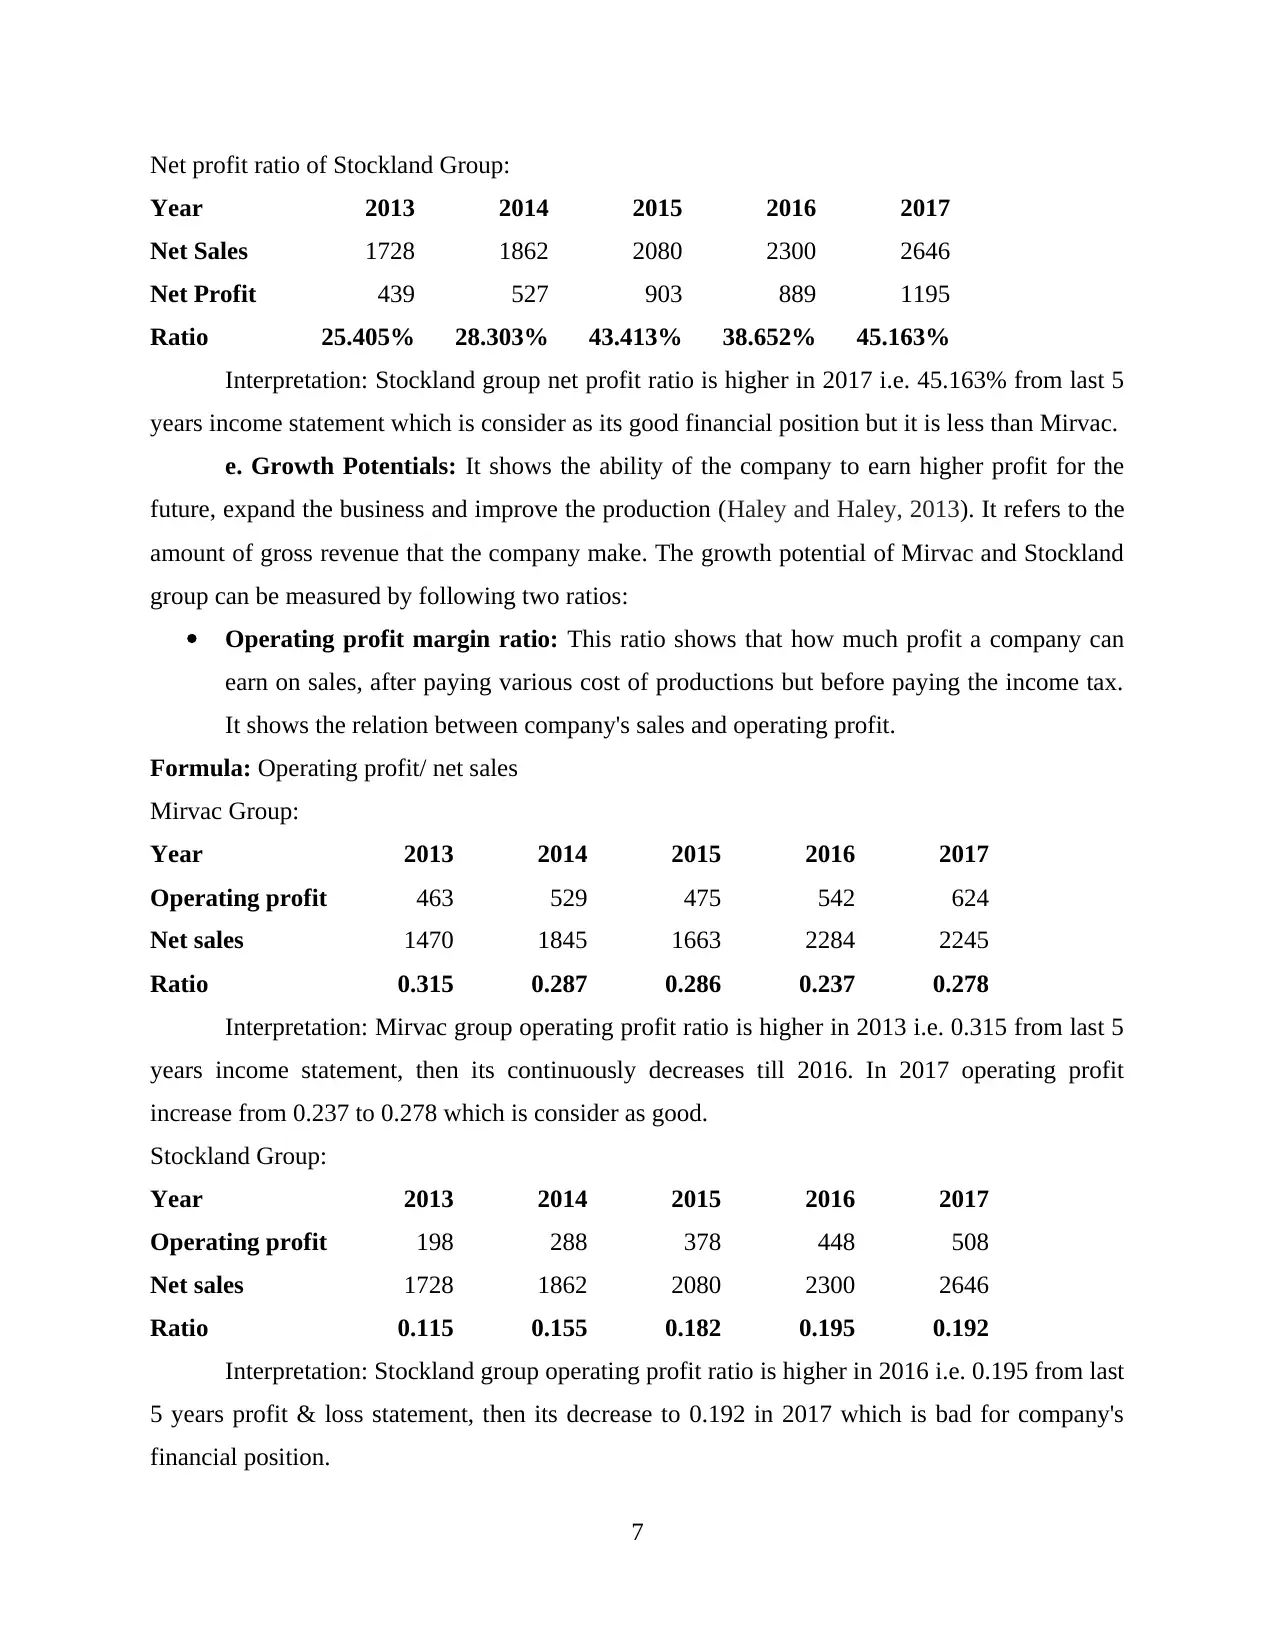
Net profit ratio of Stockland Group:
Year 2013 2014 2015 2016 2017
Net Sales 1728 1862 2080 2300 2646
Net Profit 439 527 903 889 1195
Ratio 25.405% 28.303% 43.413% 38.652% 45.163%
Interpretation: Stockland group net profit ratio is higher in 2017 i.e. 45.163% from last 5
years income statement which is consider as its good financial position but it is less than Mirvac.
e. Growth Potentials: It shows the ability of the company to earn higher profit for the
future, expand the business and improve the production (Haley and Haley, 2013). It refers to the
amount of gross revenue that the company make. The growth potential of Mirvac and Stockland
group can be measured by following two ratios:
Operating profit margin ratio: This ratio shows that how much profit a company can
earn on sales, after paying various cost of productions but before paying the income tax.
It shows the relation between company's sales and operating profit.
Formula: Operating profit/ net sales
Mirvac Group:
Year 2013 2014 2015 2016 2017
Operating profit 463 529 475 542 624
Net sales 1470 1845 1663 2284 2245
Ratio 0.315 0.287 0.286 0.237 0.278
Interpretation: Mirvac group operating profit ratio is higher in 2013 i.e. 0.315 from last 5
years income statement, then its continuously decreases till 2016. In 2017 operating profit
increase from 0.237 to 0.278 which is consider as good.
Stockland Group:
Year 2013 2014 2015 2016 2017
Operating profit 198 288 378 448 508
Net sales 1728 1862 2080 2300 2646
Ratio 0.115 0.155 0.182 0.195 0.192
Interpretation: Stockland group operating profit ratio is higher in 2016 i.e. 0.195 from last
5 years profit & loss statement, then its decrease to 0.192 in 2017 which is bad for company's
financial position.
7
Year 2013 2014 2015 2016 2017
Net Sales 1728 1862 2080 2300 2646
Net Profit 439 527 903 889 1195
Ratio 25.405% 28.303% 43.413% 38.652% 45.163%
Interpretation: Stockland group net profit ratio is higher in 2017 i.e. 45.163% from last 5
years income statement which is consider as its good financial position but it is less than Mirvac.
e. Growth Potentials: It shows the ability of the company to earn higher profit for the
future, expand the business and improve the production (Haley and Haley, 2013). It refers to the
amount of gross revenue that the company make. The growth potential of Mirvac and Stockland
group can be measured by following two ratios:
Operating profit margin ratio: This ratio shows that how much profit a company can
earn on sales, after paying various cost of productions but before paying the income tax.
It shows the relation between company's sales and operating profit.
Formula: Operating profit/ net sales
Mirvac Group:
Year 2013 2014 2015 2016 2017
Operating profit 463 529 475 542 624
Net sales 1470 1845 1663 2284 2245
Ratio 0.315 0.287 0.286 0.237 0.278
Interpretation: Mirvac group operating profit ratio is higher in 2013 i.e. 0.315 from last 5
years income statement, then its continuously decreases till 2016. In 2017 operating profit
increase from 0.237 to 0.278 which is consider as good.
Stockland Group:
Year 2013 2014 2015 2016 2017
Operating profit 198 288 378 448 508
Net sales 1728 1862 2080 2300 2646
Ratio 0.115 0.155 0.182 0.195 0.192
Interpretation: Stockland group operating profit ratio is higher in 2016 i.e. 0.195 from last
5 years profit & loss statement, then its decrease to 0.192 in 2017 which is bad for company's
financial position.
7
⊘ This is a preview!⊘
Do you want full access?
Subscribe today to unlock all pages.
Trusted by 1+ million students worldwide
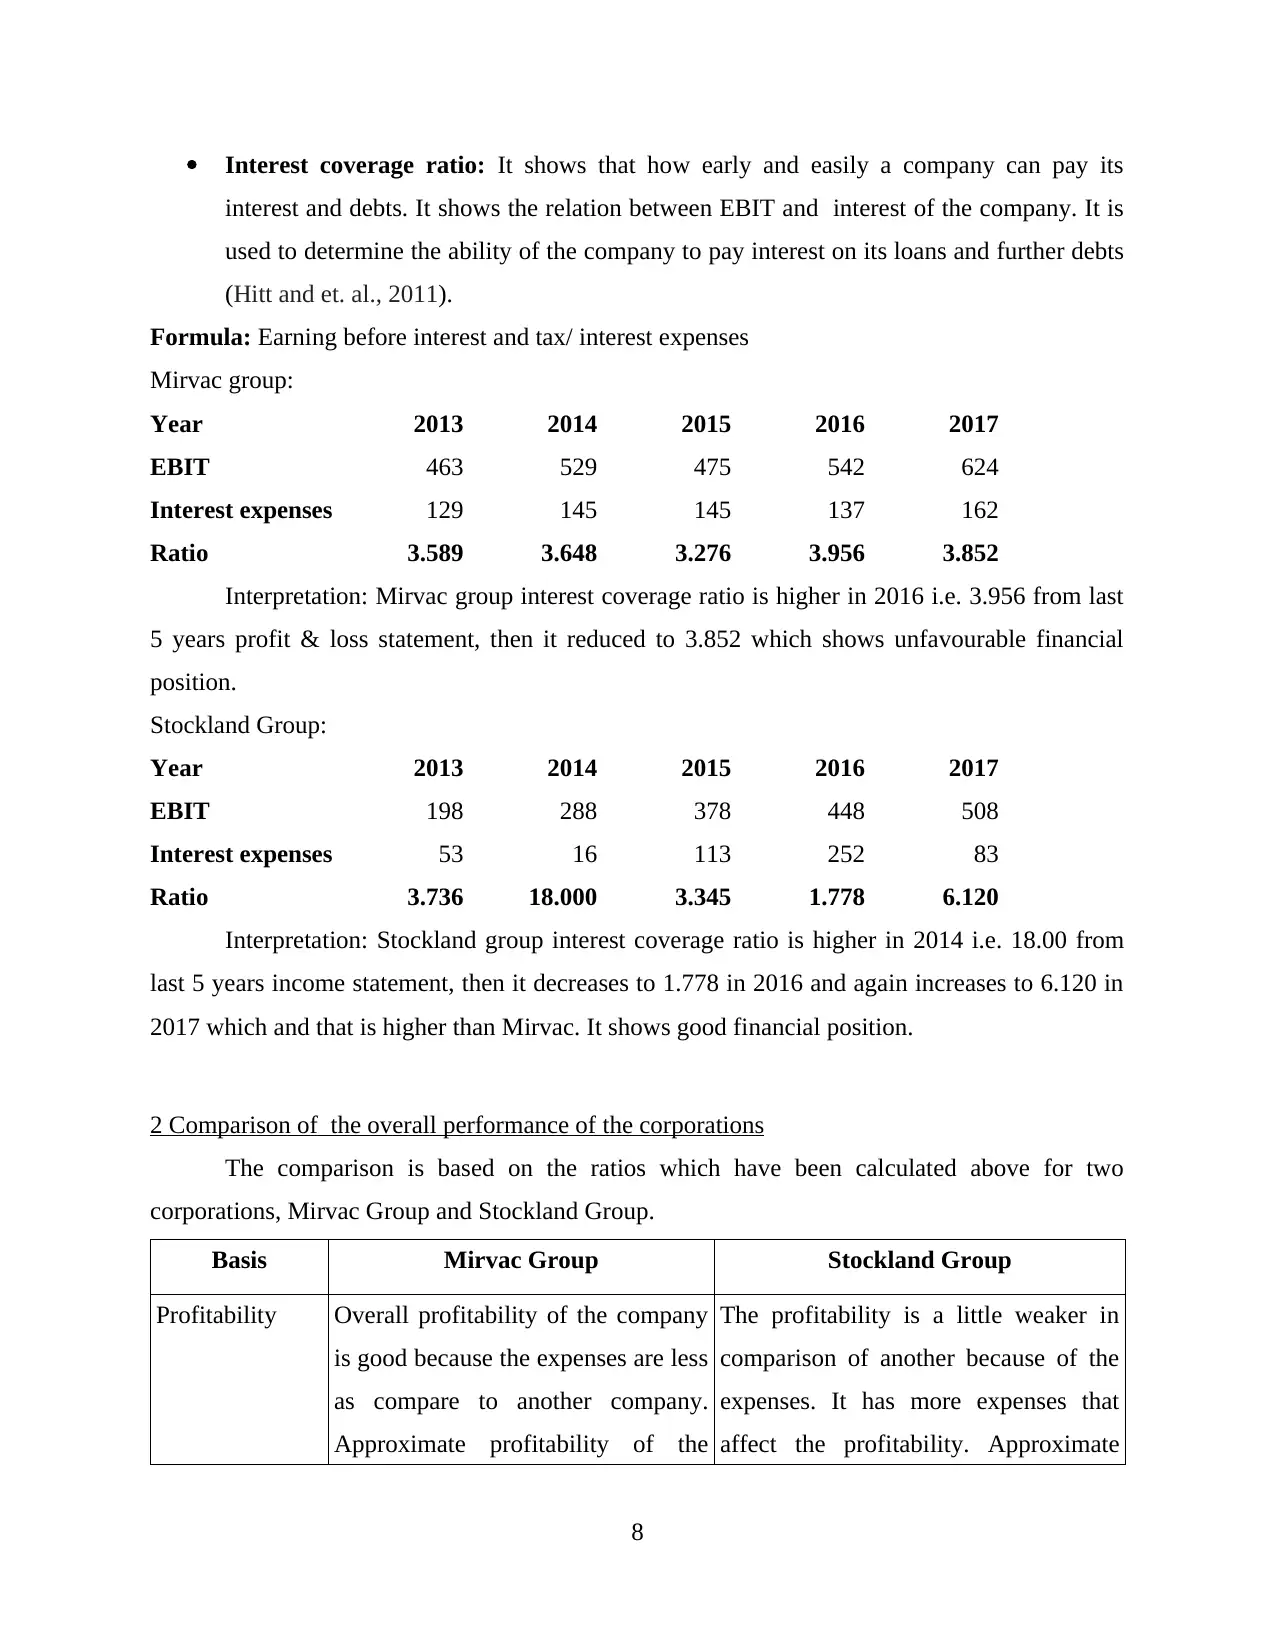
Interest coverage ratio: It shows that how early and easily a company can pay its
interest and debts. It shows the relation between EBIT and interest of the company. It is
used to determine the ability of the company to pay interest on its loans and further debts
(Hitt and et. al., 2011).
Formula: Earning before interest and tax/ interest expenses
Mirvac group:
Year 2013 2014 2015 2016 2017
EBIT 463 529 475 542 624
Interest expenses 129 145 145 137 162
Ratio 3.589 3.648 3.276 3.956 3.852
Interpretation: Mirvac group interest coverage ratio is higher in 2016 i.e. 3.956 from last
5 years profit & loss statement, then it reduced to 3.852 which shows unfavourable financial
position.
Stockland Group:
Year 2013 2014 2015 2016 2017
EBIT 198 288 378 448 508
Interest expenses 53 16 113 252 83
Ratio 3.736 18.000 3.345 1.778 6.120
Interpretation: Stockland group interest coverage ratio is higher in 2014 i.e. 18.00 from
last 5 years income statement, then it decreases to 1.778 in 2016 and again increases to 6.120 in
2017 which and that is higher than Mirvac. It shows good financial position.
2 Comparison of the overall performance of the corporations
The comparison is based on the ratios which have been calculated above for two
corporations, Mirvac Group and Stockland Group.
Basis Mirvac Group Stockland Group
Profitability Overall profitability of the company
is good because the expenses are less
as compare to another company.
Approximate profitability of the
The profitability is a little weaker in
comparison of another because of the
expenses. It has more expenses that
affect the profitability. Approximate
8
Paraphrase This Document
Need a fresh take? Get an instant paraphrase of this document with our AI Paraphraser
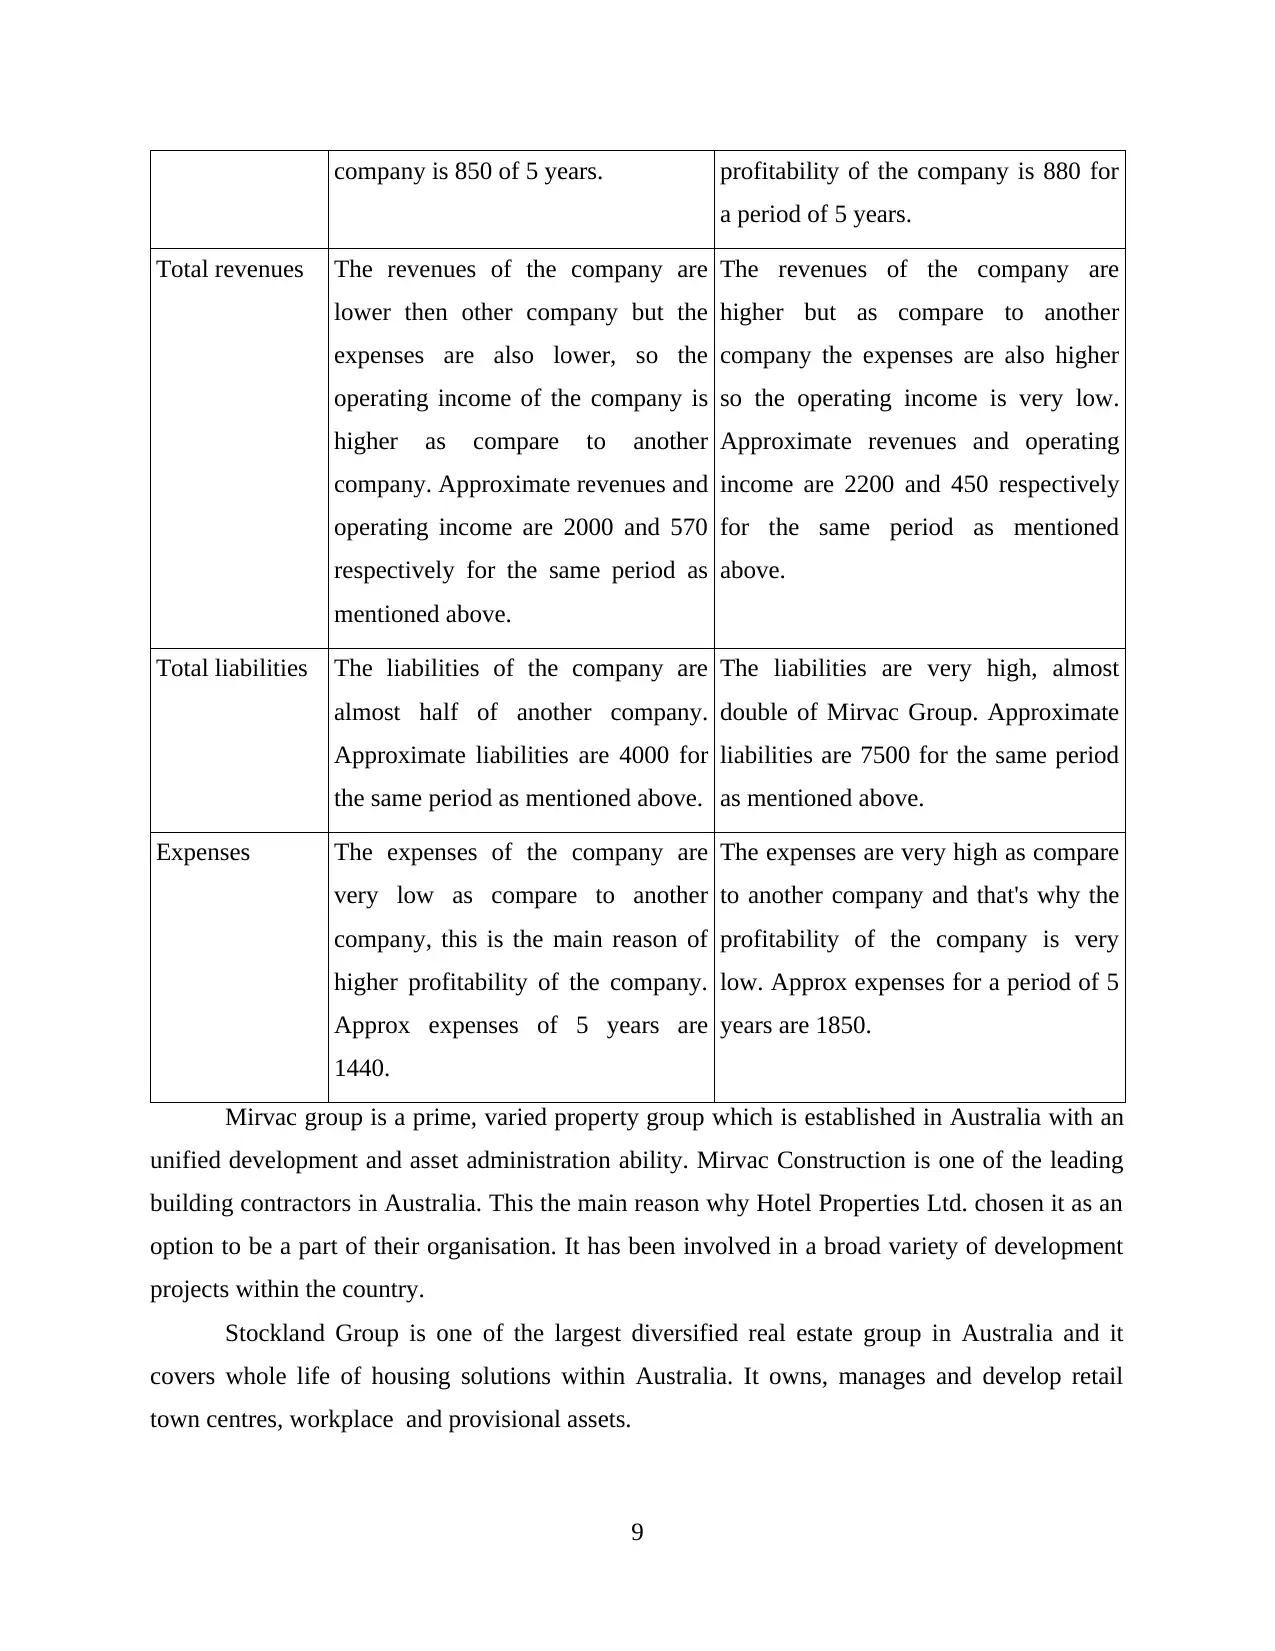
company is 850 of 5 years. profitability of the company is 880 for
a period of 5 years.
Total revenues The revenues of the company are
lower then other company but the
expenses are also lower, so the
operating income of the company is
higher as compare to another
company. Approximate revenues and
operating income are 2000 and 570
respectively for the same period as
mentioned above.
The revenues of the company are
higher but as compare to another
company the expenses are also higher
so the operating income is very low.
Approximate revenues and operating
income are 2200 and 450 respectively
for the same period as mentioned
above.
Total liabilities The liabilities of the company are
almost half of another company.
Approximate liabilities are 4000 for
the same period as mentioned above.
The liabilities are very high, almost
double of Mirvac Group. Approximate
liabilities are 7500 for the same period
as mentioned above.
Expenses The expenses of the company are
very low as compare to another
company, this is the main reason of
higher profitability of the company.
Approx expenses of 5 years are
1440.
The expenses are very high as compare
to another company and that's why the
profitability of the company is very
low. Approx expenses for a period of 5
years are 1850.
Mirvac group is a prime, varied property group which is established in Australia with an
unified development and asset administration ability. Mirvac Construction is one of the leading
building contractors in Australia. This the main reason why Hotel Properties Ltd. chosen it as an
option to be a part of their organisation. It has been involved in a broad variety of development
projects within the country.
Stockland Group is one of the largest diversified real estate group in Australia and it
covers whole life of housing solutions within Australia. It owns, manages and develop retail
town centres, workplace and provisional assets.
9
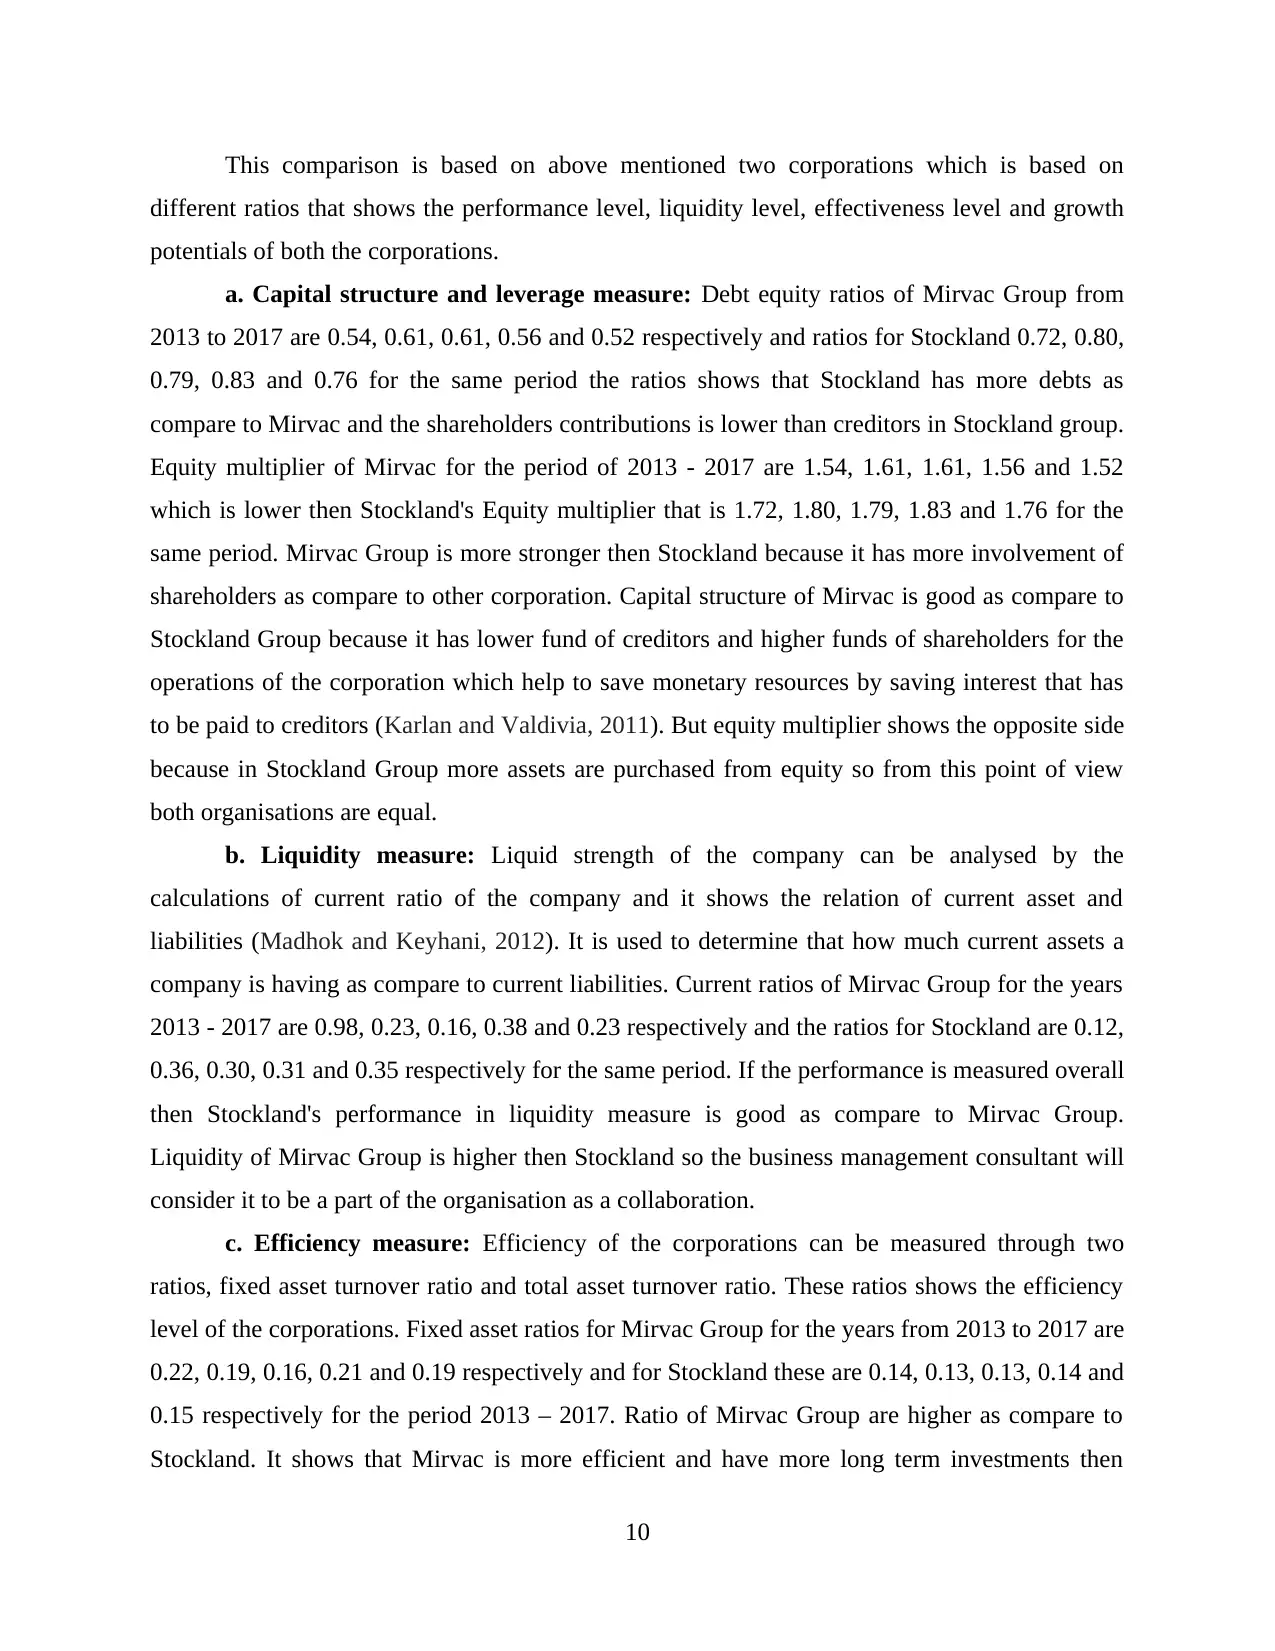
This comparison is based on above mentioned two corporations which is based on
different ratios that shows the performance level, liquidity level, effectiveness level and growth
potentials of both the corporations.
a. Capital structure and leverage measure: Debt equity ratios of Mirvac Group from
2013 to 2017 are 0.54, 0.61, 0.61, 0.56 and 0.52 respectively and ratios for Stockland 0.72, 0.80,
0.79, 0.83 and 0.76 for the same period the ratios shows that Stockland has more debts as
compare to Mirvac and the shareholders contributions is lower than creditors in Stockland group.
Equity multiplier of Mirvac for the period of 2013 - 2017 are 1.54, 1.61, 1.61, 1.56 and 1.52
which is lower then Stockland's Equity multiplier that is 1.72, 1.80, 1.79, 1.83 and 1.76 for the
same period. Mirvac Group is more stronger then Stockland because it has more involvement of
shareholders as compare to other corporation. Capital structure of Mirvac is good as compare to
Stockland Group because it has lower fund of creditors and higher funds of shareholders for the
operations of the corporation which help to save monetary resources by saving interest that has
to be paid to creditors (Karlan and Valdivia, 2011). But equity multiplier shows the opposite side
because in Stockland Group more assets are purchased from equity so from this point of view
both organisations are equal.
b. Liquidity measure: Liquid strength of the company can be analysed by the
calculations of current ratio of the company and it shows the relation of current asset and
liabilities (Madhok and Keyhani, 2012). It is used to determine that how much current assets a
company is having as compare to current liabilities. Current ratios of Mirvac Group for the years
2013 - 2017 are 0.98, 0.23, 0.16, 0.38 and 0.23 respectively and the ratios for Stockland are 0.12,
0.36, 0.30, 0.31 and 0.35 respectively for the same period. If the performance is measured overall
then Stockland's performance in liquidity measure is good as compare to Mirvac Group.
Liquidity of Mirvac Group is higher then Stockland so the business management consultant will
consider it to be a part of the organisation as a collaboration.
c. Efficiency measure: Efficiency of the corporations can be measured through two
ratios, fixed asset turnover ratio and total asset turnover ratio. These ratios shows the efficiency
level of the corporations. Fixed asset ratios for Mirvac Group for the years from 2013 to 2017 are
0.22, 0.19, 0.16, 0.21 and 0.19 respectively and for Stockland these are 0.14, 0.13, 0.13, 0.14 and
0.15 respectively for the period 2013 – 2017. Ratio of Mirvac Group are higher as compare to
Stockland. It shows that Mirvac is more efficient and have more long term investments then
10
⊘ This is a preview!⊘
Do you want full access?
Subscribe today to unlock all pages.
Trusted by 1+ million students worldwide
1 out of 24
Related Documents


Your All-in-One AI-Powered Toolkit for Academic Success.
+13062052269
info@desklib.com
Available 24*7 on WhatsApp / Email
![[object Object]](/_next/static/media/star-bottom.7253800d.svg)
Unlock your academic potential
Copyright © 2020–2026 A2Z Services. All Rights Reserved. Developed and managed by ZUCOL.