Statistical Analysis of Stock Prices for Three Construction Companies
VerifiedAdded on 2023/01/23
|21
|4452
|48
Project
AI Summary
This project provides a statistical analysis of stock prices for three selected construction companies: DLF Limited, Hindustan Construction Company (HCC), and Gammon India Limited. The study utilizes historical data from January 1, 1998, to May 10th, 2019, to analyze stock price behavior. The research employs various financial estimation and forecasting techniques, including descriptive statistics (mean, median, standard deviation, and coefficient of variance), beta index to determine risk and volatility, relative strength index (RSI) to understand trends, money flow index (MFI) to examine price movement, and simple moving average (SMA) for forecasting price fluctuations. The analysis aims to provide insights into the industrial strength of the stocks, current market trends, and associated risks, assisting CEOs and potential investors in making informed decisions. The project includes data modeling, provisioning, and mining, with a comparative assessment of stock price dynamics over a 20-year period. The findings reveal fluctuations in stock prices, with varying degrees of decline and volatility among the three companies. The study also highlights the importance of statistical tools in evaluating stock performance and understanding the impact of economic and non-economic factors on stock returns.

Running head: STOCK ANALYSIS 1
Statistical Analysis of Stock Prices for Three Selected Construction Companies
Student Name
Institution
Statistical Analysis of Stock Prices for Three Selected Construction Companies
Student Name
Institution
Paraphrase This Document
Need a fresh take? Get an instant paraphrase of this document with our AI Paraphraser
STOCK ANALYSIS 2
Task 1: Introduction and Background Information
Construction is one of the most capital intensive industries in the world. In construction,
timely and successful completion of a construction project is dependent on capital availability to
a company (Ibrahim 2010). Many construction companies access capital for their projects
differently from different sources and institutions using different methods. Stock marketing is
one of the many ways construction companies access capital by releasing shares (Theodoridou,
Papadopoulos & Hegger, 2011). In stock marketing, the companies sell shares to raise money
and establish their brand in the market. Moreover, the companies earn confidence for new
projects from potential investors by selling shares.
A company’s stock price is a reflection of its financial performance in terms of capital
value. However, both macroeconomic and microeconomic factors affect the returns of stocks in
financial markets. Allocation of resources to the most viable and profitable investment
opportunity calls for the understanding of stock price behavior in the market. Appropriate
analysis and interpretation of stock returns give investors a cutting edge in making accurate
managerial and investment decisions (Jasiniak, 2018). Stock returns fluctuations are dependent
on economic and non-economic factors. The selection of the right investment option in the right
market is the basis of success for every investor. Additionally, political, economic, company’s
financial status, the risk levels and returns involved in shares, and the state of the industry
determines the choice of investment by investors.
Thus, the study of stock market price fluctuations is essential in understanding the stock
market price. Statistical techniques are valuable tools in the evaluation of stock performance.
The research focusses on the analysis and interpretation of stock prices of three construction
companies namely; DLF limited, Hindustan Construction Company (HCC), and Gammon India
STOCK ANALYSIS 3
Limited (Gammon). The aim of the current study is conducting a market analysis of stock
behavior of three selected construction companies using historical data from secondary sources.
The research study employs financial estimation and forecasting techniques such as beta index,
simple moving average, money flow index, and relative strength index. Such analysis of stock
behaviors assist the CEOs of respective companies and the potential investors in determining the
industrial strength of stocks and understanding the current trends and risks involved with stock
trading hence making appropriate and accurate decisions before buying and selling of shares in
the market. The core objective of this study is the analysis of historical prices and conducting a
comparative appraisal of stock prices for the three companies in the construction industry with
five goals:
i) Use descriptive statistics to understand the characteristics of stock prices for the
selected companies
ii) Use the beta index to determine the risk and volatility of stock prices
iii) Use the relative strength index technique to understand the current trends and
strength of stock prices for the selected stocks in the construction industry
iv) Use the money flow index technique to examine the movement of stock prices
v) Use simple moving average forecasting method to analyze the periodic stock prices
fluctuations
Task 2: Data Modelling and Provisioning
Task 3: Data Mining
Data Sources
This study aims at analyzing the equity share price movement in three Bombay Stock
Exchange (BSE) listed construction companies using simple statistical analysis. The selection
⊘ This is a preview!⊘
Do you want full access?
Subscribe today to unlock all pages.
Trusted by 1+ million students worldwide
STOCK ANALYSIS 4
criteria for the three companies were based on market capitalization and the minimum age of
thirty years of the company operation and the company reputation of handling large
infrastructural projects. The secondary data used for analysis comprised of daily closing stock
prices from 1st January 1998 to May 10th, 2019.
Statistical Tools
The statistical tools used in this study ranged from simple descriptive statistics to even
more advanced statistical indices to interpret the financial soundness of various construction
companies.
Descriptive statistics:
In the study, the descriptive statistics include the mean, median, standard deviation and
coefficient of variance. A Coefficient of variance gives a required insight and help to understand
the essential characteristics of stocks (Wang, Fan & Men, 2008).
The Simple moving average (SMA)
The simple moving average is a basic forecasting technique which indicates the average
value of a time series of high frequency such as closing, opening, high and low-security prices of
a company. The high volatile nature of the stock market makes these variables of high rate. The
simple moving average is one of the key trend lines drawn to show the variable average per time
in a time series plot. The simple moving average smoothens the trend line and converts time
series into low frequency. Smoothed data is easier to interpret the time series trend. In stock
markets analysis, the value of moving average price fluctuates with slight changes in security
prices (Kothari, 2001). Moreover, when the moving average price exceeds the daily chart price, a
signal for either buying or selling a stock is generated.
Money Flow Index
Paraphrase This Document
Need a fresh take? Get an instant paraphrase of this document with our AI Paraphraser

STOCK ANALYSIS 5
Money flow index robustly indicates the strength of money inflows and outflow of security.
Money flow index indicates the strength and weaknesses of a trend.
Relative Strength Index (RSI)
RSI is a financial index which compares stocks magnitude gain to the magnitude of
losses. The RSI values range from 0 to 100. The value of RSI is marked high and low when its
values are over 70 (overbought) and below 30(oversold) respectively. Similarly, RSI designated
to as extremely high and low when its values are above 80 and below 20. RSI provides signals
that tell an investor to buy when security is oversold and to sell when it is overbought (Chandra,
2000).
Beta Index
Beta index of a firm refers to the sensitivity of its share price with respect to a benchmark
index such as NSE or BSE. Even though the beta is a measure of a risk, its value highly depends
on the duration of a period taken into account in its computation. Moreover, there are various
methods of beta computation, which may portray a different picture. For this research study, the
beta index will be calculated using the formula:
β = covariance ( pi, Pbm)/variance (Pbm)
Where pi is the price of a security “i” and Pbm is the price of the benchmark index (BSE index)
Covariance measures the simultaneous movement of two stocks (Investopedia.com, 2019). The
value of covariance can either be positive or negative. A positive covariance value indicates that
the stocks increase and decrease together with a price increase or decrease respectively.
In contrast, a negative covariance value indicates that stocks move in opposite directions
with an increase or decrease in stock prices. On the other hand, variance reports the stock
movement in relation to the mean. For example, the variance is a measure of the volatility of
STOCK ANALYSIS 6
stocks price over a specific period while covariance is used to estimate the relationship between
movements of two different stocks. The beta index value of a benchmark is considered to be one;
thus any value beta value which greater than one is considered that the security price of a
company is more volatile than the market itself. Thus, a company with a beta of greater than one
will tend to amplify market movements in either a positive or negative direction. It means a
company with a high beta index may offer higher returns during a specific period, but that comes
along with higher risk caused by volatility.
Task 4: Research
The comparative assessment of the stock price dynamics of the three construction companies
was analyzed statistically for the period of 20 years (Jan 1998 – May 2019) and presented.
Analysis of basic Characteristics
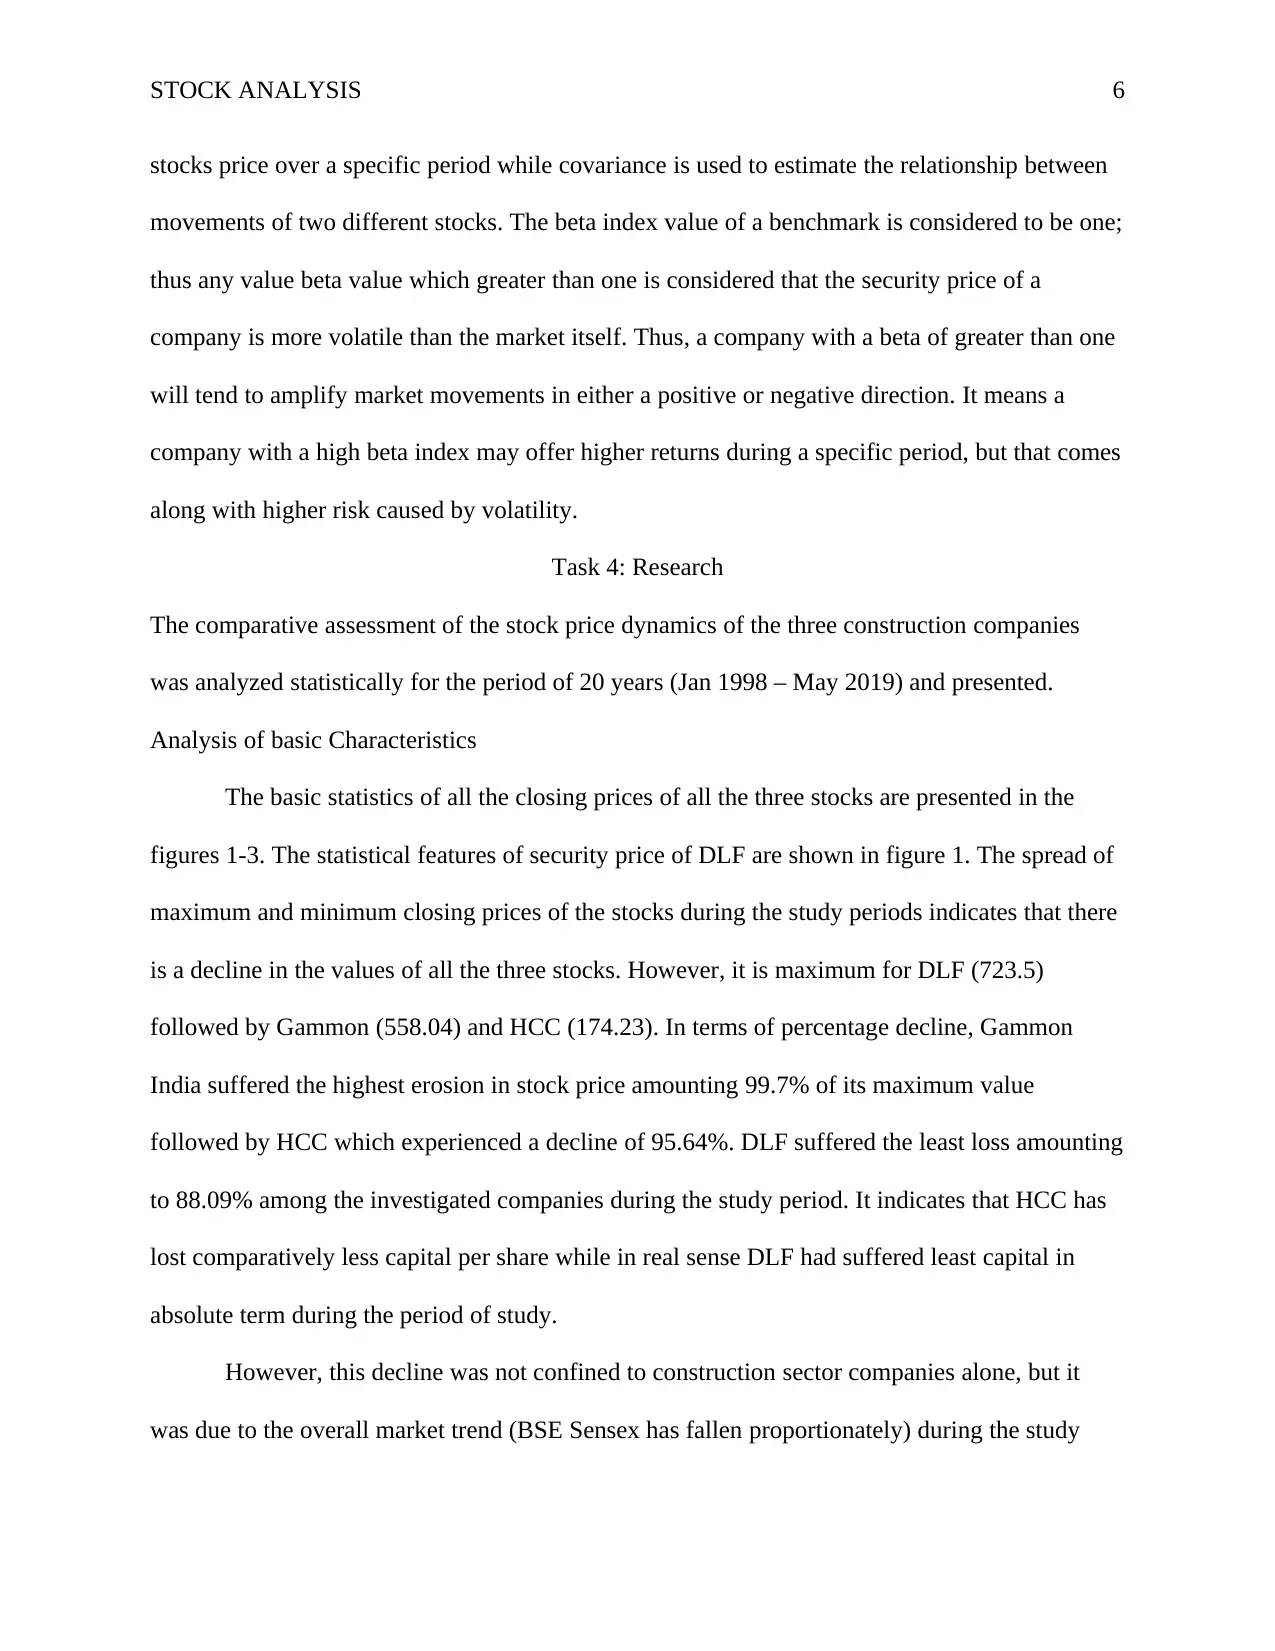
The basic statistics of all the closing prices of all the three stocks are presented in the
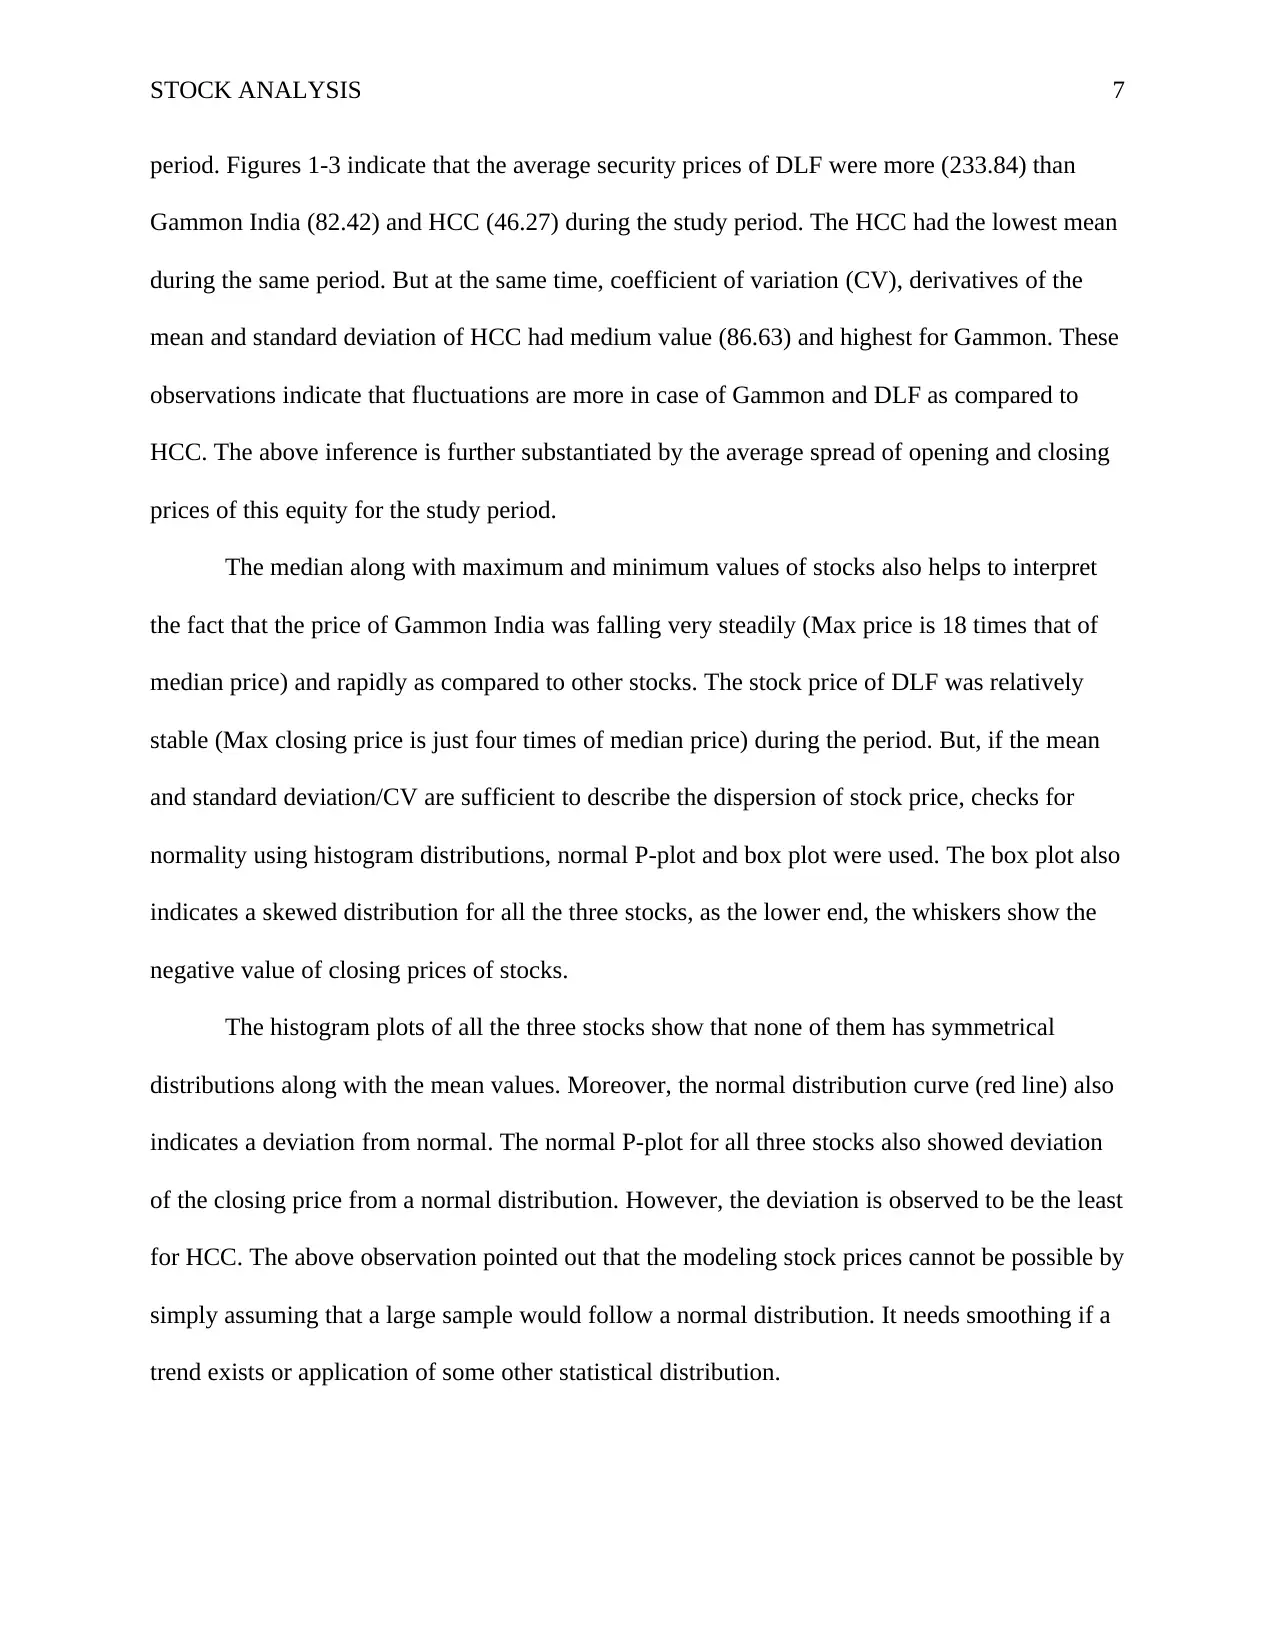
figures 1-3. The statistical features of security price of DLF are shown in figure 1. The spread of
maximum and minimum closing prices of the stocks during the study periods indicates that there
is a decline in the values of all the three stocks. However, it is maximum for DLF (723.5)
followed by Gammon (558.04) and HCC (174.23). In terms of percentage decline, Gammon
India suffered the highest erosion in stock price amounting 99.7% of its maximum value
followed by HCC which experienced a decline of 95.64%. DLF suffered the least loss amounting
to 88.09% among the investigated companies during the study period. It indicates that HCC has
lost comparatively less capital per share while in real sense DLF had suffered least capital in
absolute term during the period of study.
However, this decline was not confined to construction sector companies alone, but it
was due to the overall market trend (BSE Sensex has fallen proportionately) during the study
stocks price over a specific period while covariance is used to estimate the relationship between
movements of two different stocks. The beta index value of a benchmark is considered to be one;
thus any value beta value which greater than one is considered that the security price of a
company is more volatile than the market itself. Thus, a company with a beta of greater than one
will tend to amplify market movements in either a positive or negative direction. It means a
company with a high beta index may offer higher returns during a specific period, but that comes
along with higher risk caused by volatility.
Task 4: Research
The comparative assessment of the stock price dynamics of the three construction companies
was analyzed statistically for the period of 20 years (Jan 1998 – May 2019) and presented.
Analysis of basic Characteristics
The basic statistics of all the closing prices of all the three stocks are presented in the
figures 1-3. The statistical features of security price of DLF are shown in figure 1. The spread of
maximum and minimum closing prices of the stocks during the study periods indicates that there
is a decline in the values of all the three stocks. However, it is maximum for DLF (723.5)
followed by Gammon (558.04) and HCC (174.23). In terms of percentage decline, Gammon
India suffered the highest erosion in stock price amounting 99.7% of its maximum value
followed by HCC which experienced a decline of 95.64%. DLF suffered the least loss amounting
to 88.09% among the investigated companies during the study period. It indicates that HCC has
lost comparatively less capital per share while in real sense DLF had suffered least capital in
absolute term during the period of study.
However, this decline was not confined to construction sector companies alone, but it
was due to the overall market trend (BSE Sensex has fallen proportionately) during the study
⊘ This is a preview!⊘
Do you want full access?
Subscribe today to unlock all pages.
Trusted by 1+ million students worldwide
STOCK ANALYSIS 7
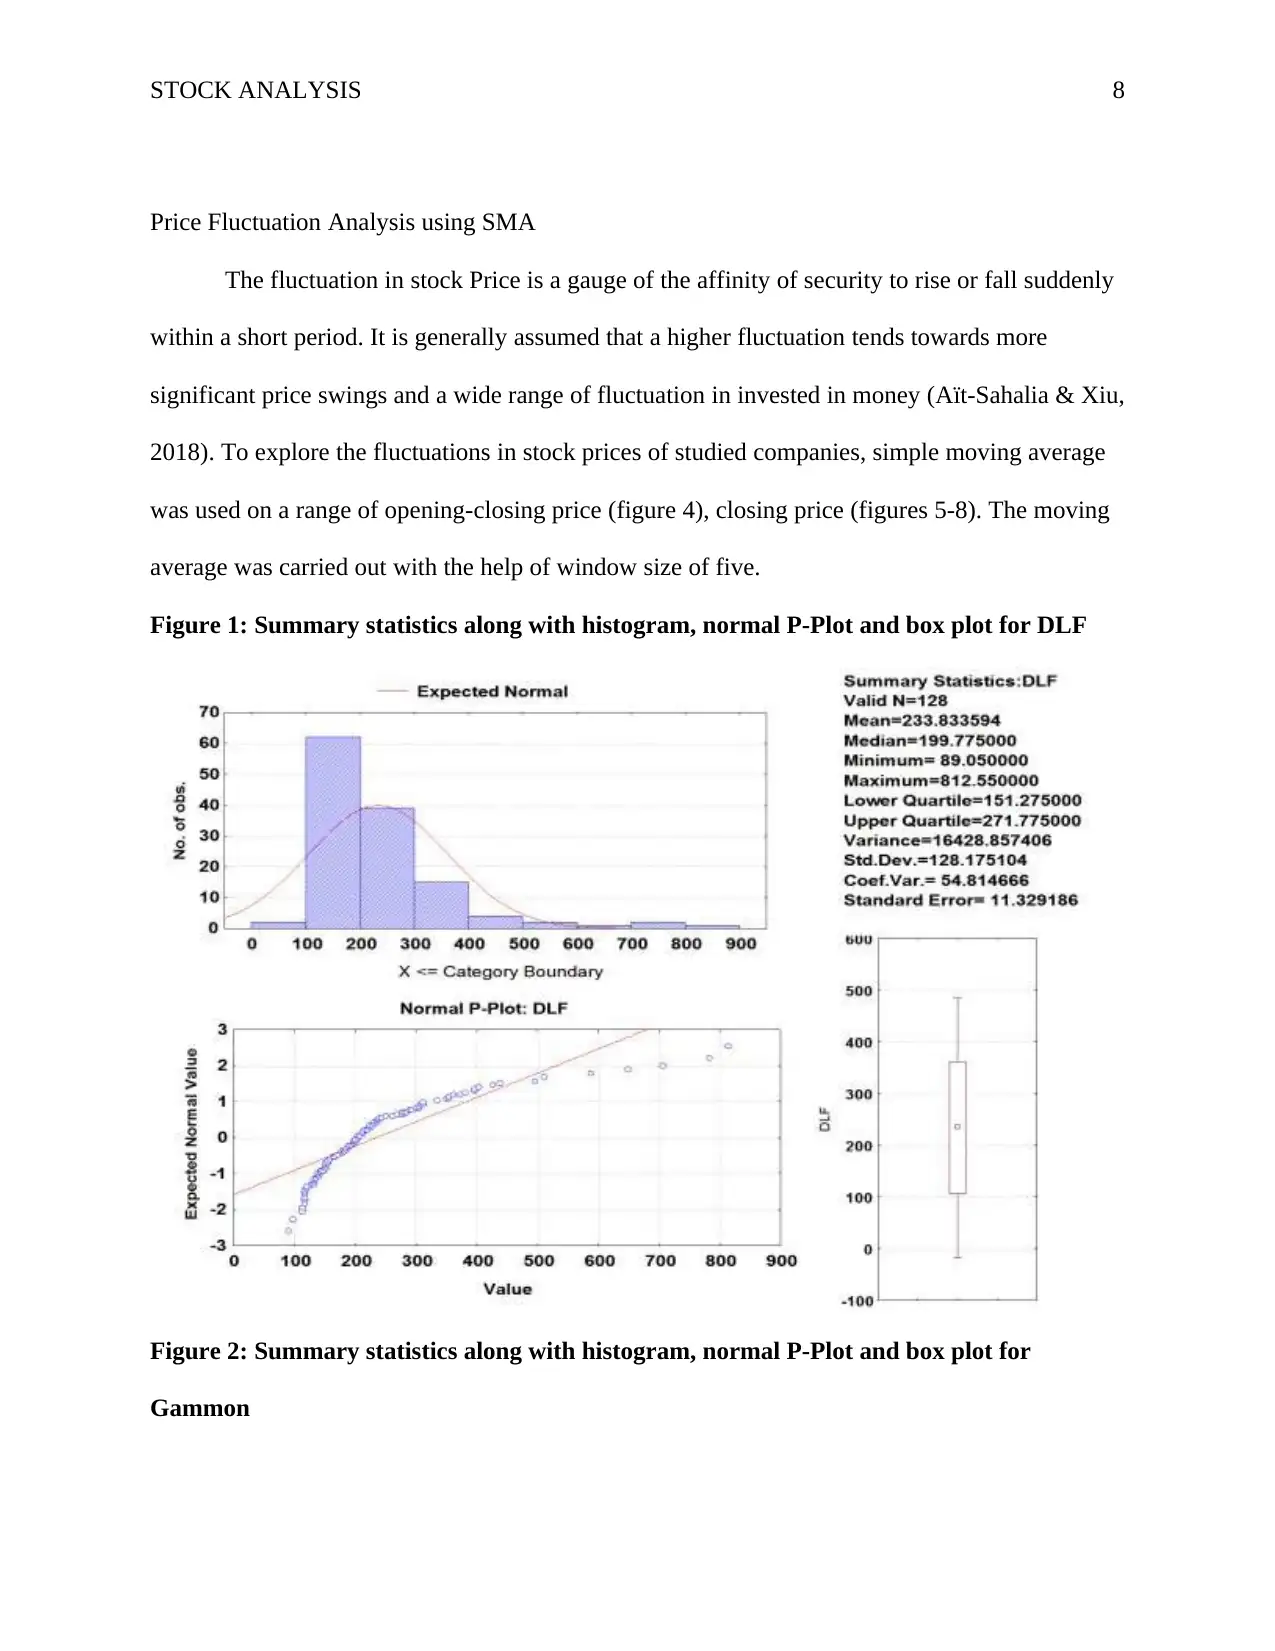
period. Figures 1-3 indicate that the average security prices of DLF were more (233.84) than
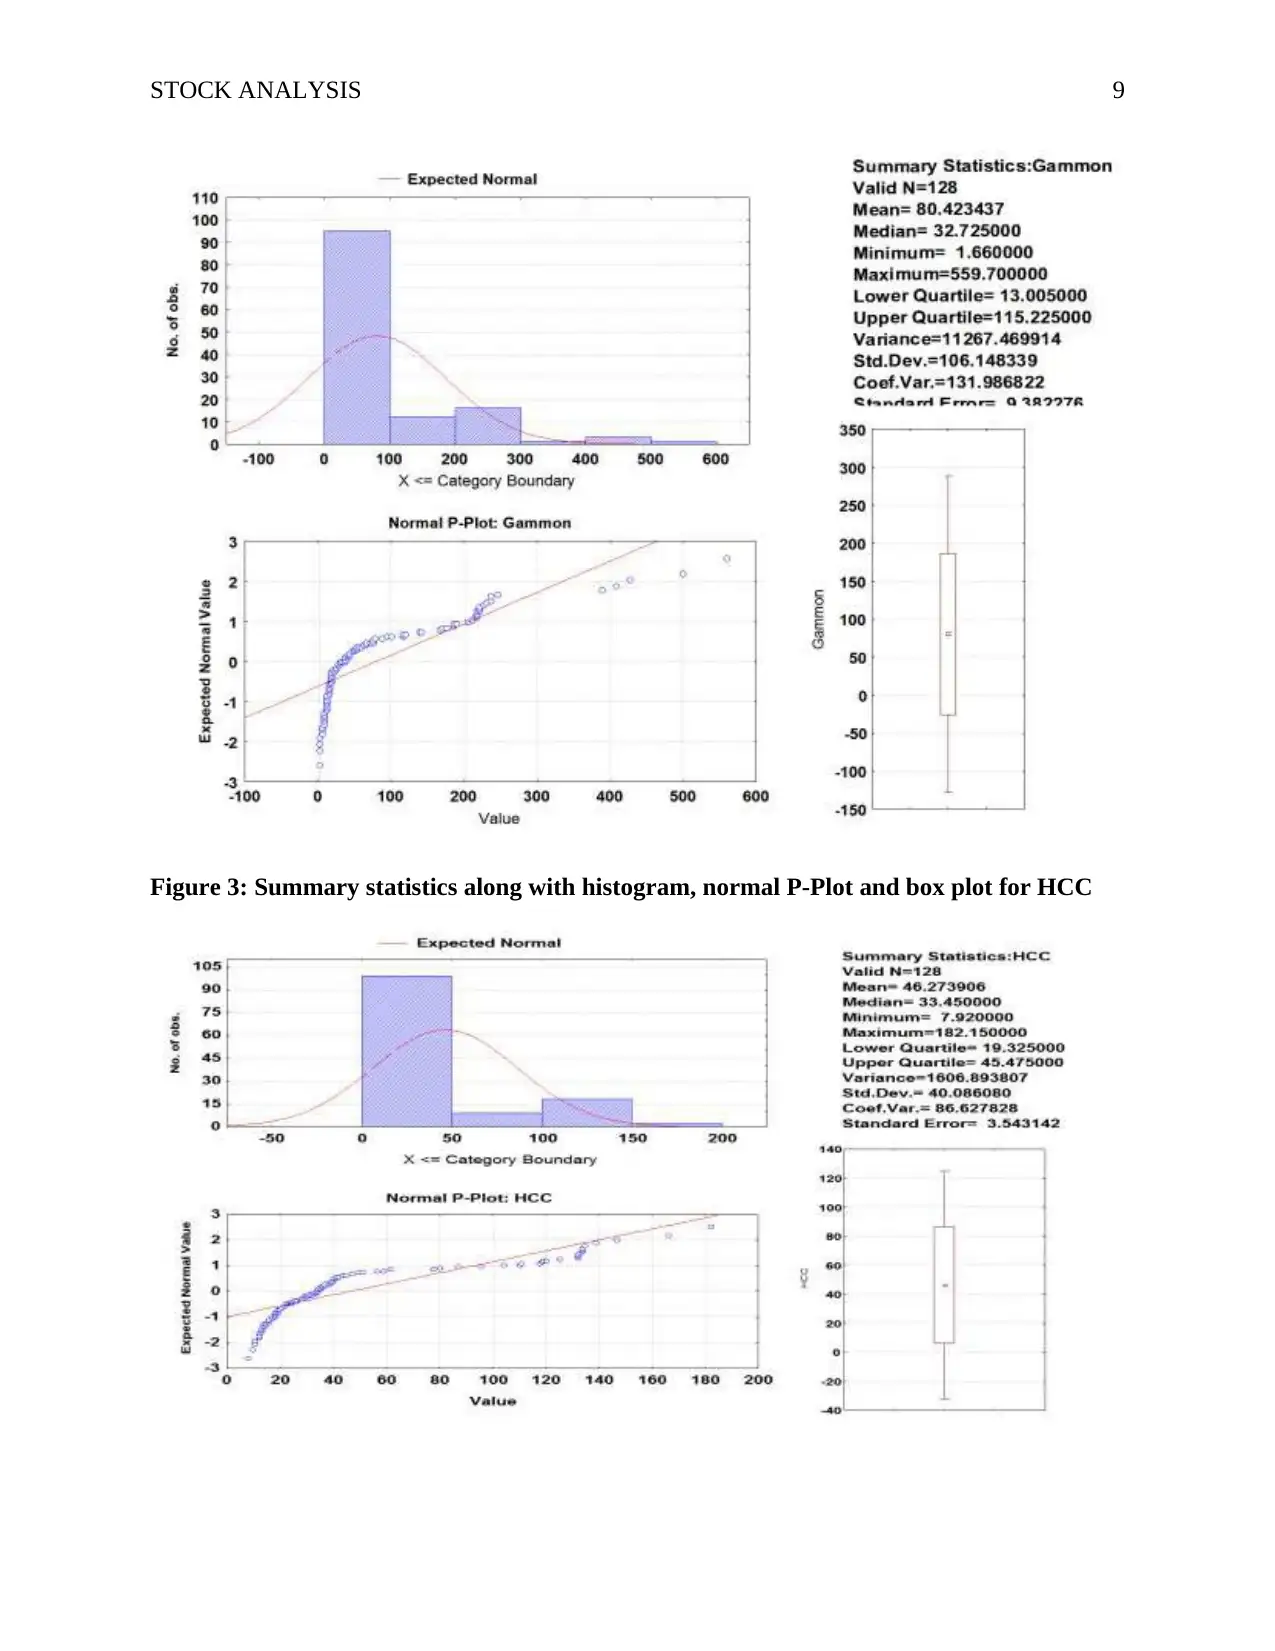
Gammon India (82.42) and HCC (46.27) during the study period. The HCC had the lowest mean
during the same period. But at the same time, coefficient of variation (CV), derivatives of the
mean and standard deviation of HCC had medium value (86.63) and highest for Gammon. These
observations indicate that fluctuations are more in case of Gammon and DLF as compared to
HCC. The above inference is further substantiated by the average spread of opening and closing
prices of this equity for the study period.
The median along with maximum and minimum values of stocks also helps to interpret
the fact that the price of Gammon India was falling very steadily (Max price is 18 times that of
median price) and rapidly as compared to other stocks. The stock price of DLF was relatively
stable (Max closing price is just four times of median price) during the period. But, if the mean
and standard deviation/CV are sufficient to describe the dispersion of stock price, checks for
normality using histogram distributions, normal P-plot and box plot were used. The box plot also
indicates a skewed distribution for all the three stocks, as the lower end, the whiskers show the
negative value of closing prices of stocks.
The histogram plots of all the three stocks show that none of them has symmetrical
distributions along with the mean values. Moreover, the normal distribution curve (red line) also
indicates a deviation from normal. The normal P-plot for all three stocks also showed deviation
of the closing price from a normal distribution. However, the deviation is observed to be the least
for HCC. The above observation pointed out that the modeling stock prices cannot be possible by
simply assuming that a large sample would follow a normal distribution. It needs smoothing if a
trend exists or application of some other statistical distribution.
period. Figures 1-3 indicate that the average security prices of DLF were more (233.84) than
Gammon India (82.42) and HCC (46.27) during the study period. The HCC had the lowest mean
during the same period. But at the same time, coefficient of variation (CV), derivatives of the
mean and standard deviation of HCC had medium value (86.63) and highest for Gammon. These
observations indicate that fluctuations are more in case of Gammon and DLF as compared to
HCC. The above inference is further substantiated by the average spread of opening and closing
prices of this equity for the study period.
The median along with maximum and minimum values of stocks also helps to interpret
the fact that the price of Gammon India was falling very steadily (Max price is 18 times that of
median price) and rapidly as compared to other stocks. The stock price of DLF was relatively
stable (Max closing price is just four times of median price) during the period. But, if the mean
and standard deviation/CV are sufficient to describe the dispersion of stock price, checks for
normality using histogram distributions, normal P-plot and box plot were used. The box plot also
indicates a skewed distribution for all the three stocks, as the lower end, the whiskers show the
negative value of closing prices of stocks.
The histogram plots of all the three stocks show that none of them has symmetrical
distributions along with the mean values. Moreover, the normal distribution curve (red line) also
indicates a deviation from normal. The normal P-plot for all three stocks also showed deviation
of the closing price from a normal distribution. However, the deviation is observed to be the least
for HCC. The above observation pointed out that the modeling stock prices cannot be possible by
simply assuming that a large sample would follow a normal distribution. It needs smoothing if a
trend exists or application of some other statistical distribution.
Paraphrase This Document
Need a fresh take? Get an instant paraphrase of this document with our AI Paraphraser
STOCK ANALYSIS 8
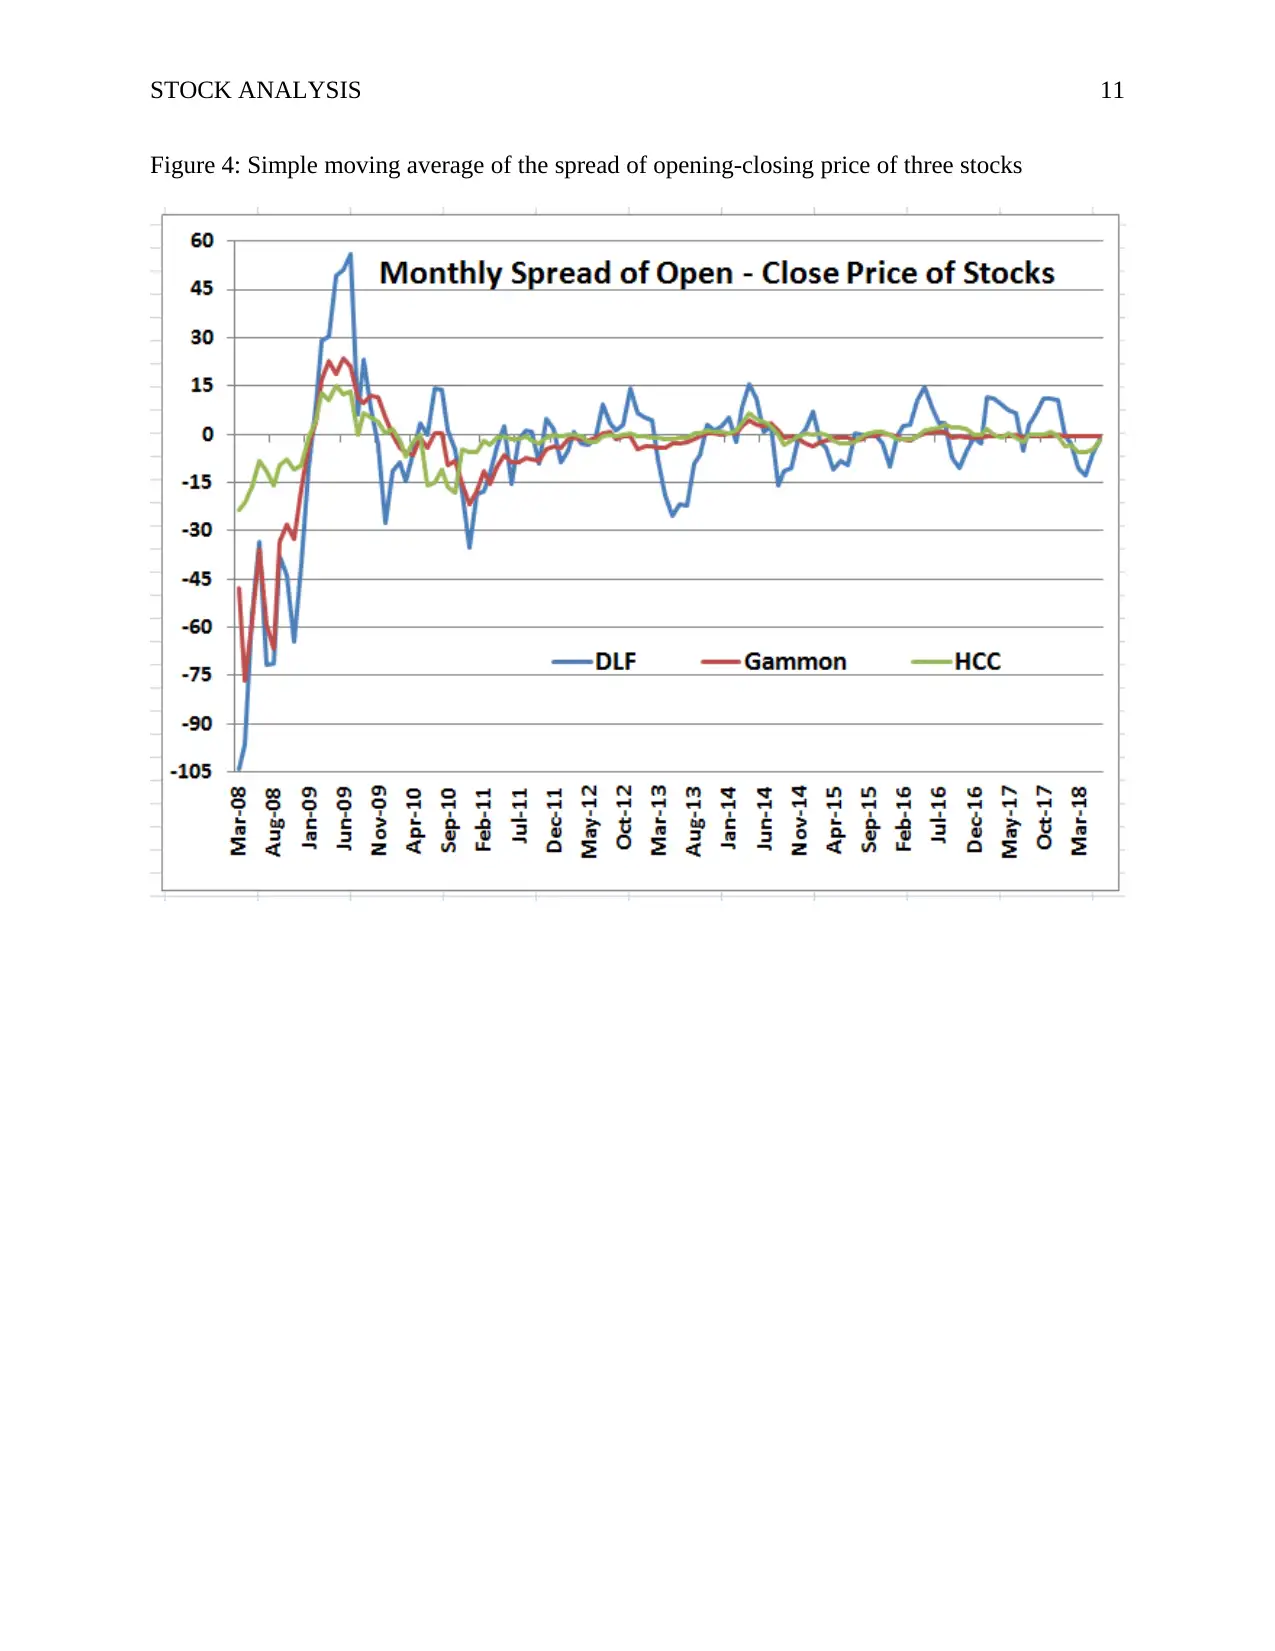
Price Fluctuation Analysis using SMA
The fluctuation in stock Price is a gauge of the affinity of security to rise or fall suddenly
within a short period. It is generally assumed that a higher fluctuation tends towards more
significant price swings and a wide range of fluctuation in invested in money (Aït-Sahalia & Xiu,
2018). To explore the fluctuations in stock prices of studied companies, simple moving average
was used on a range of opening-closing price (figure 4), closing price (figures 5-8). The moving
average was carried out with the help of window size of five.
Figure 1: Summary statistics along with histogram, normal P-Plot and box plot for DLF
Figure 2: Summary statistics along with histogram, normal P-Plot and box plot for
Gammon
STOCK ANALYSIS 9
Figure 3: Summary statistics along with histogram, normal P-Plot and box plot for HCC
Figure 3: Summary statistics along with histogram, normal P-Plot and box plot for HCC
⊘ This is a preview!⊘
Do you want full access?
Subscribe today to unlock all pages.
Trusted by 1+ million students worldwide

STOCK ANALYSIS 10
Figure 4 reveals that the stock price of all the companies experienced different
magnitudes of fluctuations along with the broader market index (BSE Sensex).
Further, the study revealed that the stock of DLF experienced greater fluctuations due to
its comparatively high stock prices. The fluctuations for HCC are low while the stock price of
Gammon witnessed negative values for most of the time during the study period indicating
continuous depreciation of its stock price.
Figure 5 shows the comparative fluctuation in the closing price of stocks of the three
companies during the entire study period. It indicates a general decline in the stock price of the
companies. However, the decline was most severe for Gammon India, as it's stock price was
higher than HCC at the beginning of the study period but after Sep 2013 it's stock price went
below that of HCC. Moreover, at the end of the study period, both DLF and HCC recovered a
little, but there was no sign of recovery for Gammon.
The simple moving average of the monthly closing price and the closing was compared
and presented in figures 6-8. These figures revealed a short term trend in stock prices which in
turn help the investor to decipher short term selling and purchasing of stocks. Figure 6 shows
that the monthly closing price of DLF is found to be higher, though marked with few lower
values, as compared to moving average which indicates the stock is proceeding in an uptrend,
there is a buy or sell signal for an investor. The moving average value is trending at par with the
mean value at the end of the study period indicating a buying signal.
Paraphrase This Document
Need a fresh take? Get an instant paraphrase of this document with our AI Paraphraser
STOCK ANALYSIS 11
Figure 4: Simple moving average of the spread of opening-closing price of three stocks
Figure 4: Simple moving average of the spread of opening-closing price of three stocks
STOCK ANALYSIS 12
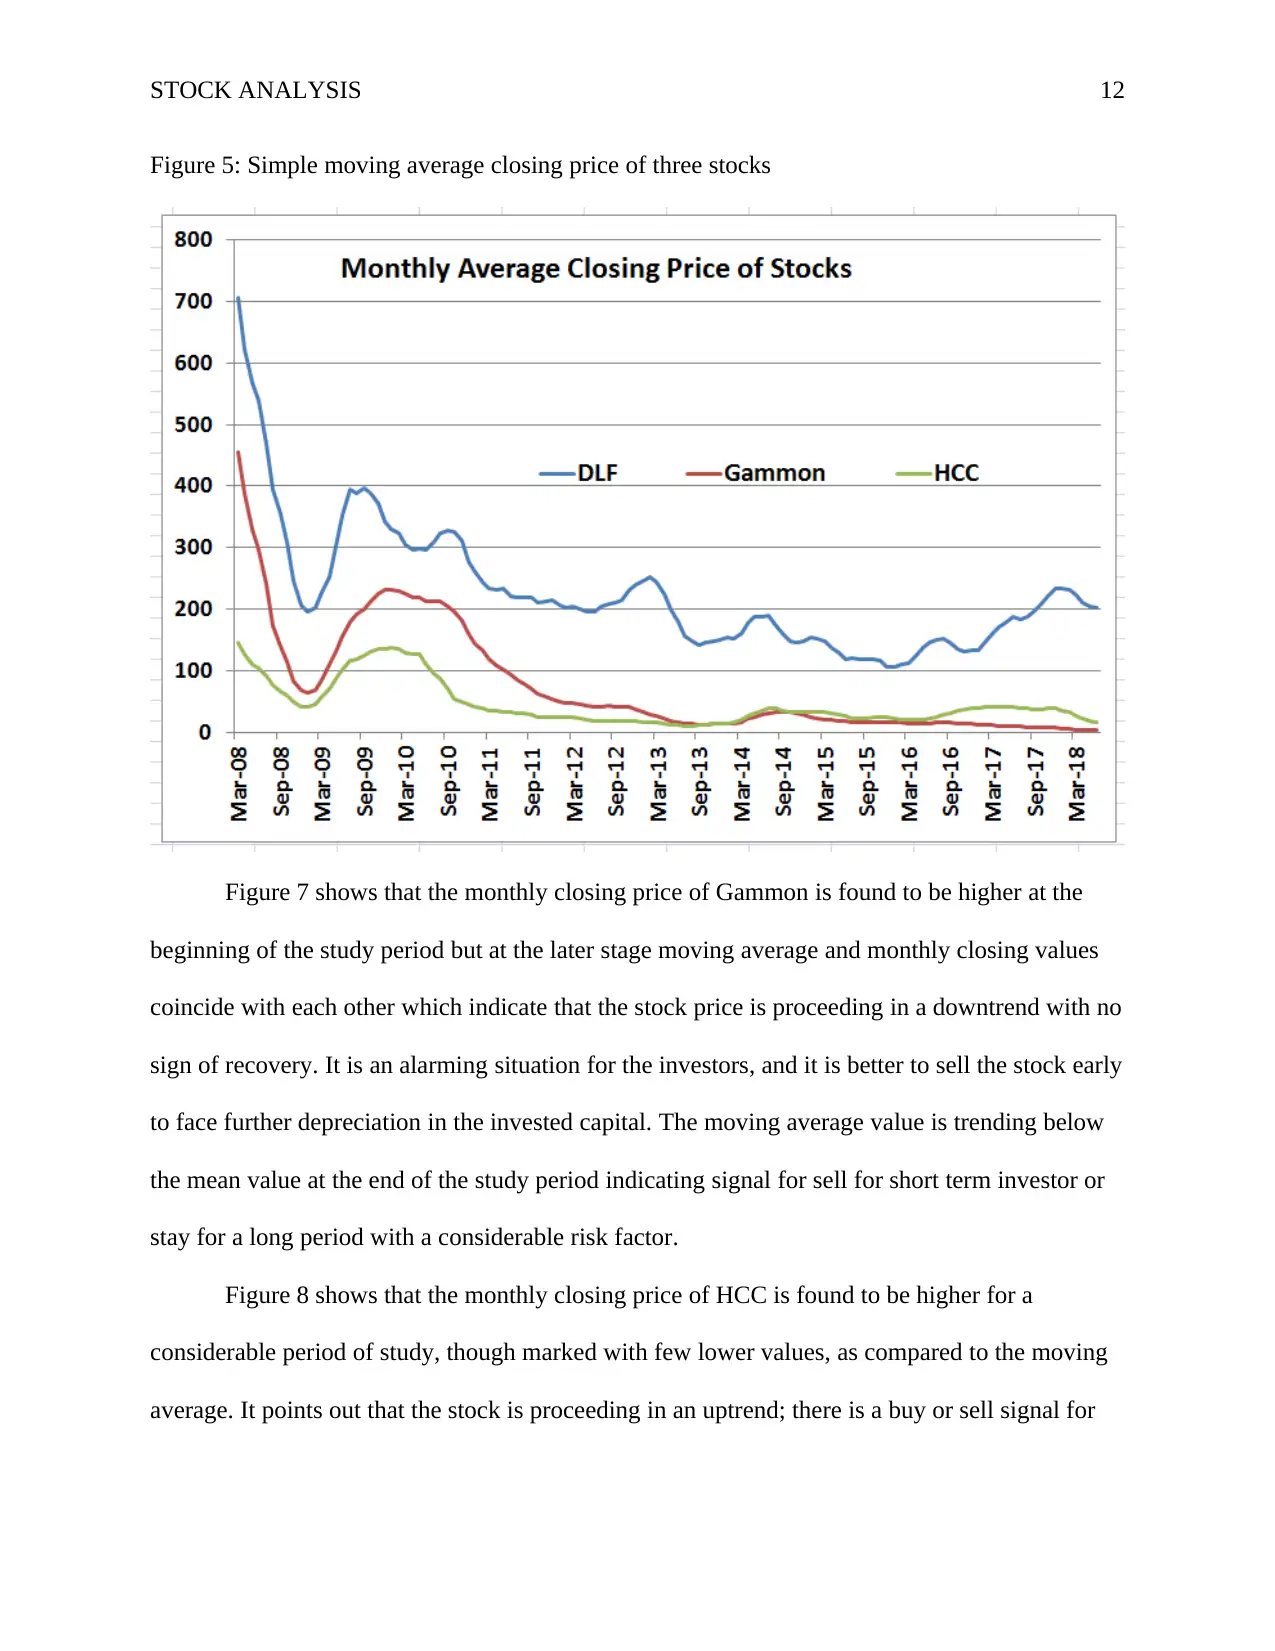
Figure 5: Simple moving average closing price of three stocks
Figure 7 shows that the monthly closing price of Gammon is found to be higher at the
beginning of the study period but at the later stage moving average and monthly closing values
coincide with each other which indicate that the stock price is proceeding in a downtrend with no
sign of recovery. It is an alarming situation for the investors, and it is better to sell the stock early
to face further depreciation in the invested capital. The moving average value is trending below
the mean value at the end of the study period indicating signal for sell for short term investor or
stay for a long period with a considerable risk factor.
Figure 8 shows that the monthly closing price of HCC is found to be higher for a
considerable period of study, though marked with few lower values, as compared to the moving
average. It points out that the stock is proceeding in an uptrend; there is a buy or sell signal for
⊘ This is a preview!⊘
Do you want full access?
Subscribe today to unlock all pages.
Trusted by 1+ million students worldwide
1 out of 21
Related Documents


Your All-in-One AI-Powered Toolkit for Academic Success.
+13062052269
info@desklib.com
Available 24*7 on WhatsApp / Email
![[object Object]](/_next/static/media/star-bottom.7253800d.svg)
Unlock your academic potential
Copyright © 2020–2026 A2Z Services. All Rights Reserved. Developed and managed by ZUCOL.