Mathematics for Construction: Task 2 Assignment Solution - HNC 2019

Verified

Added on  2023/01/07

|29
|3460
|69
Homework Assignment
AI Summary
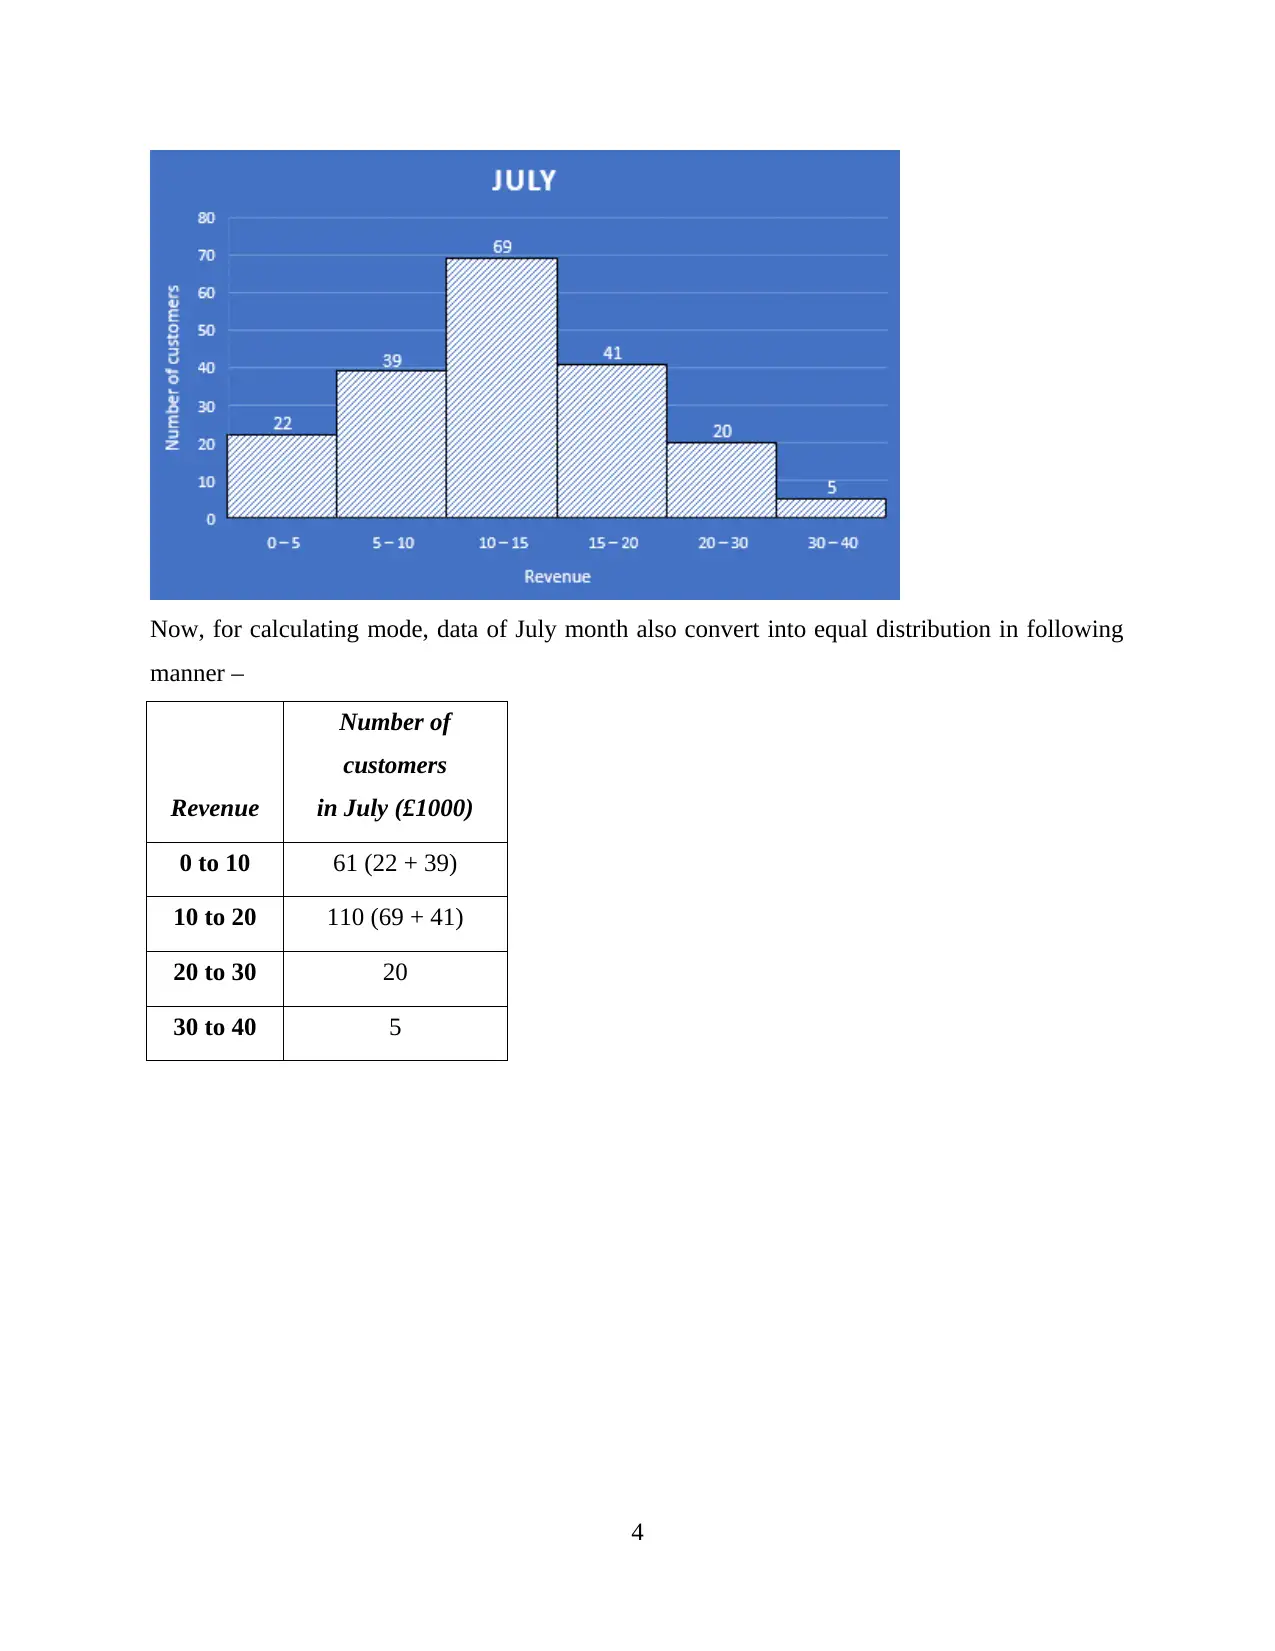
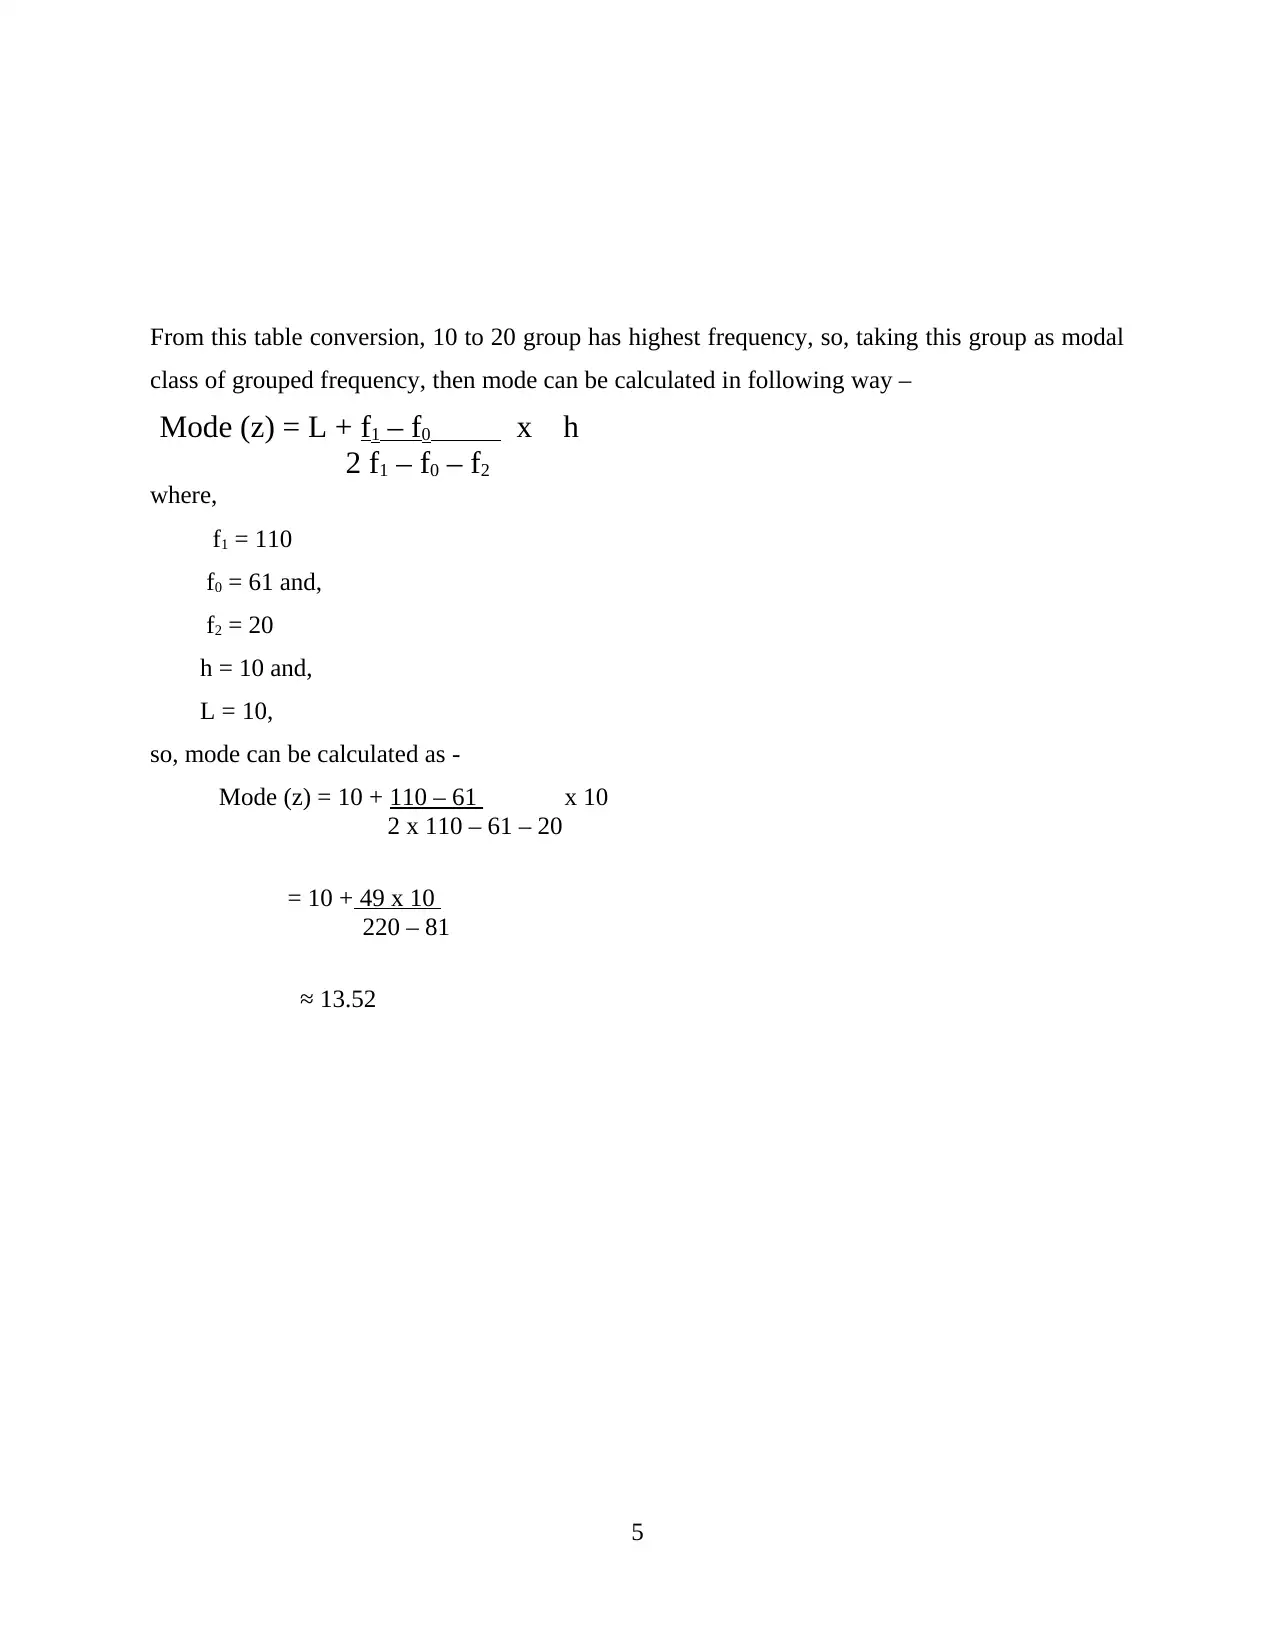
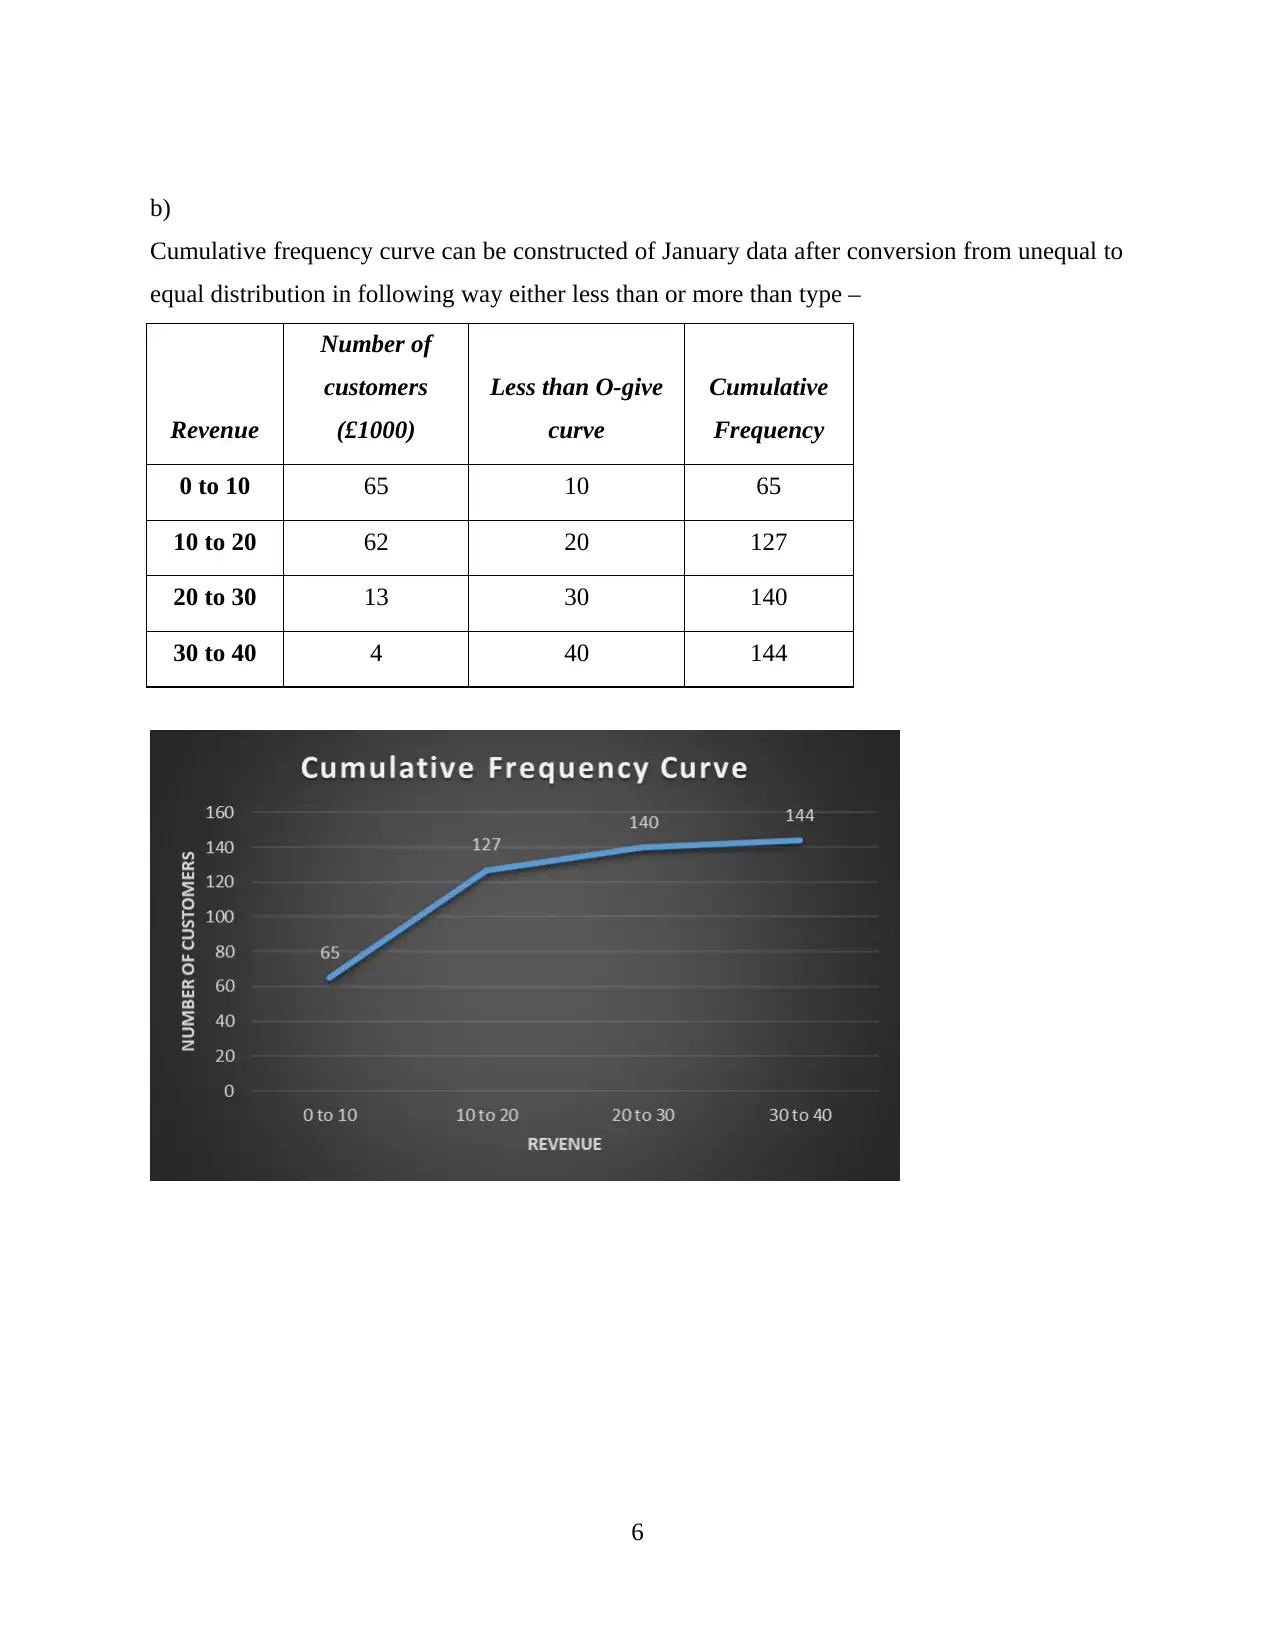
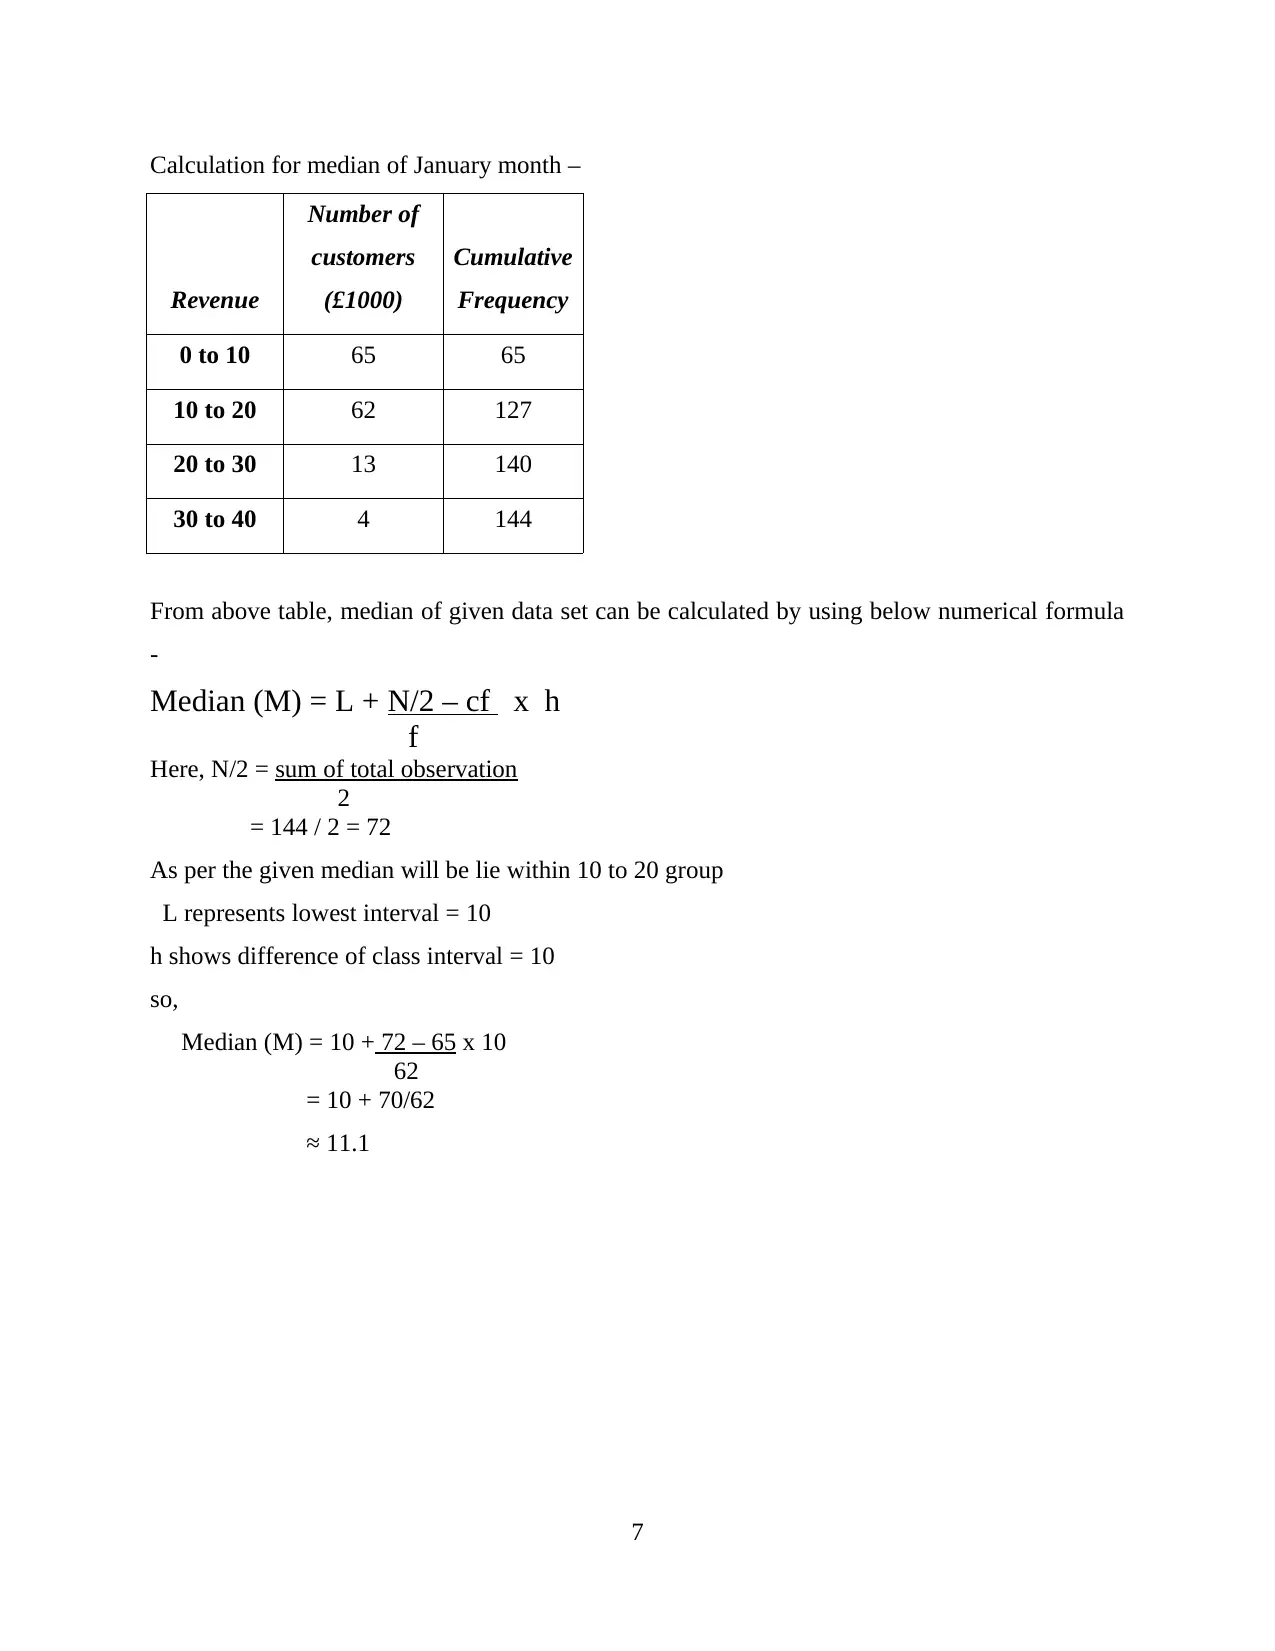
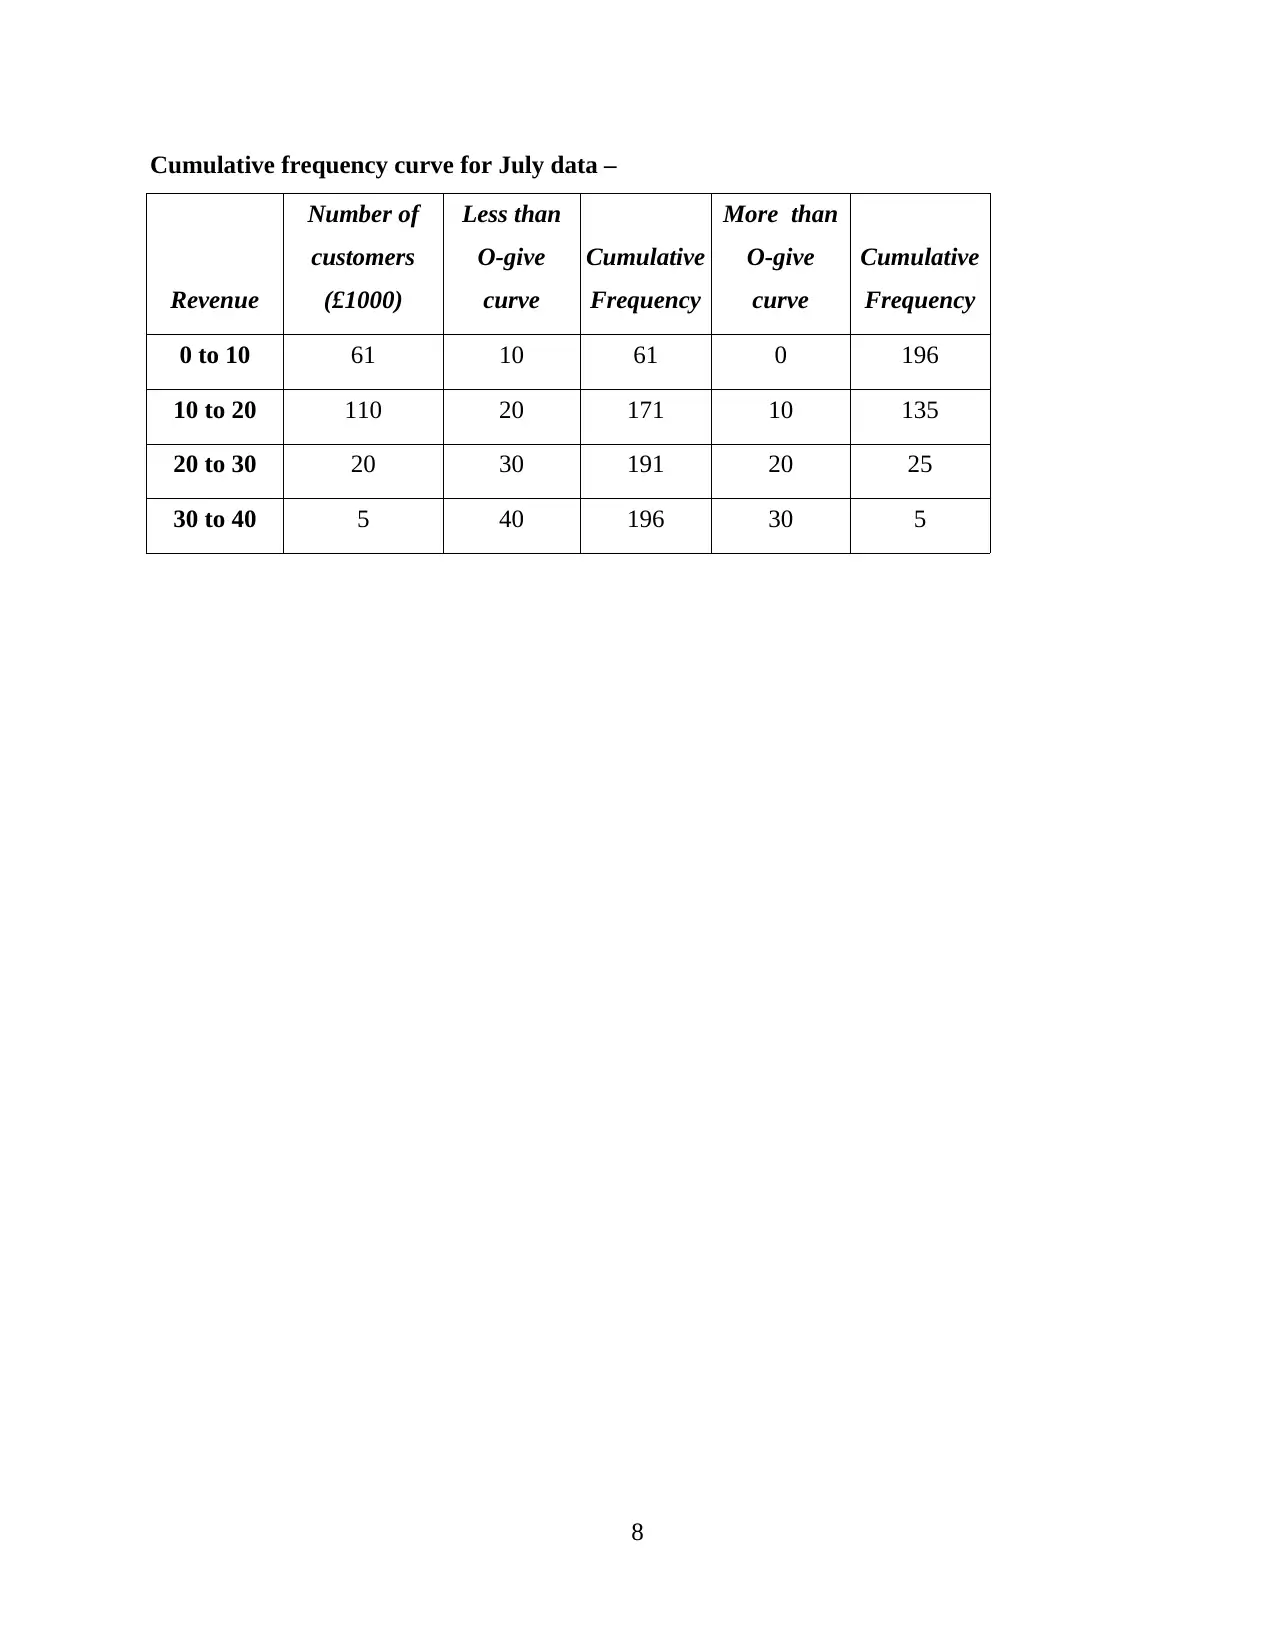
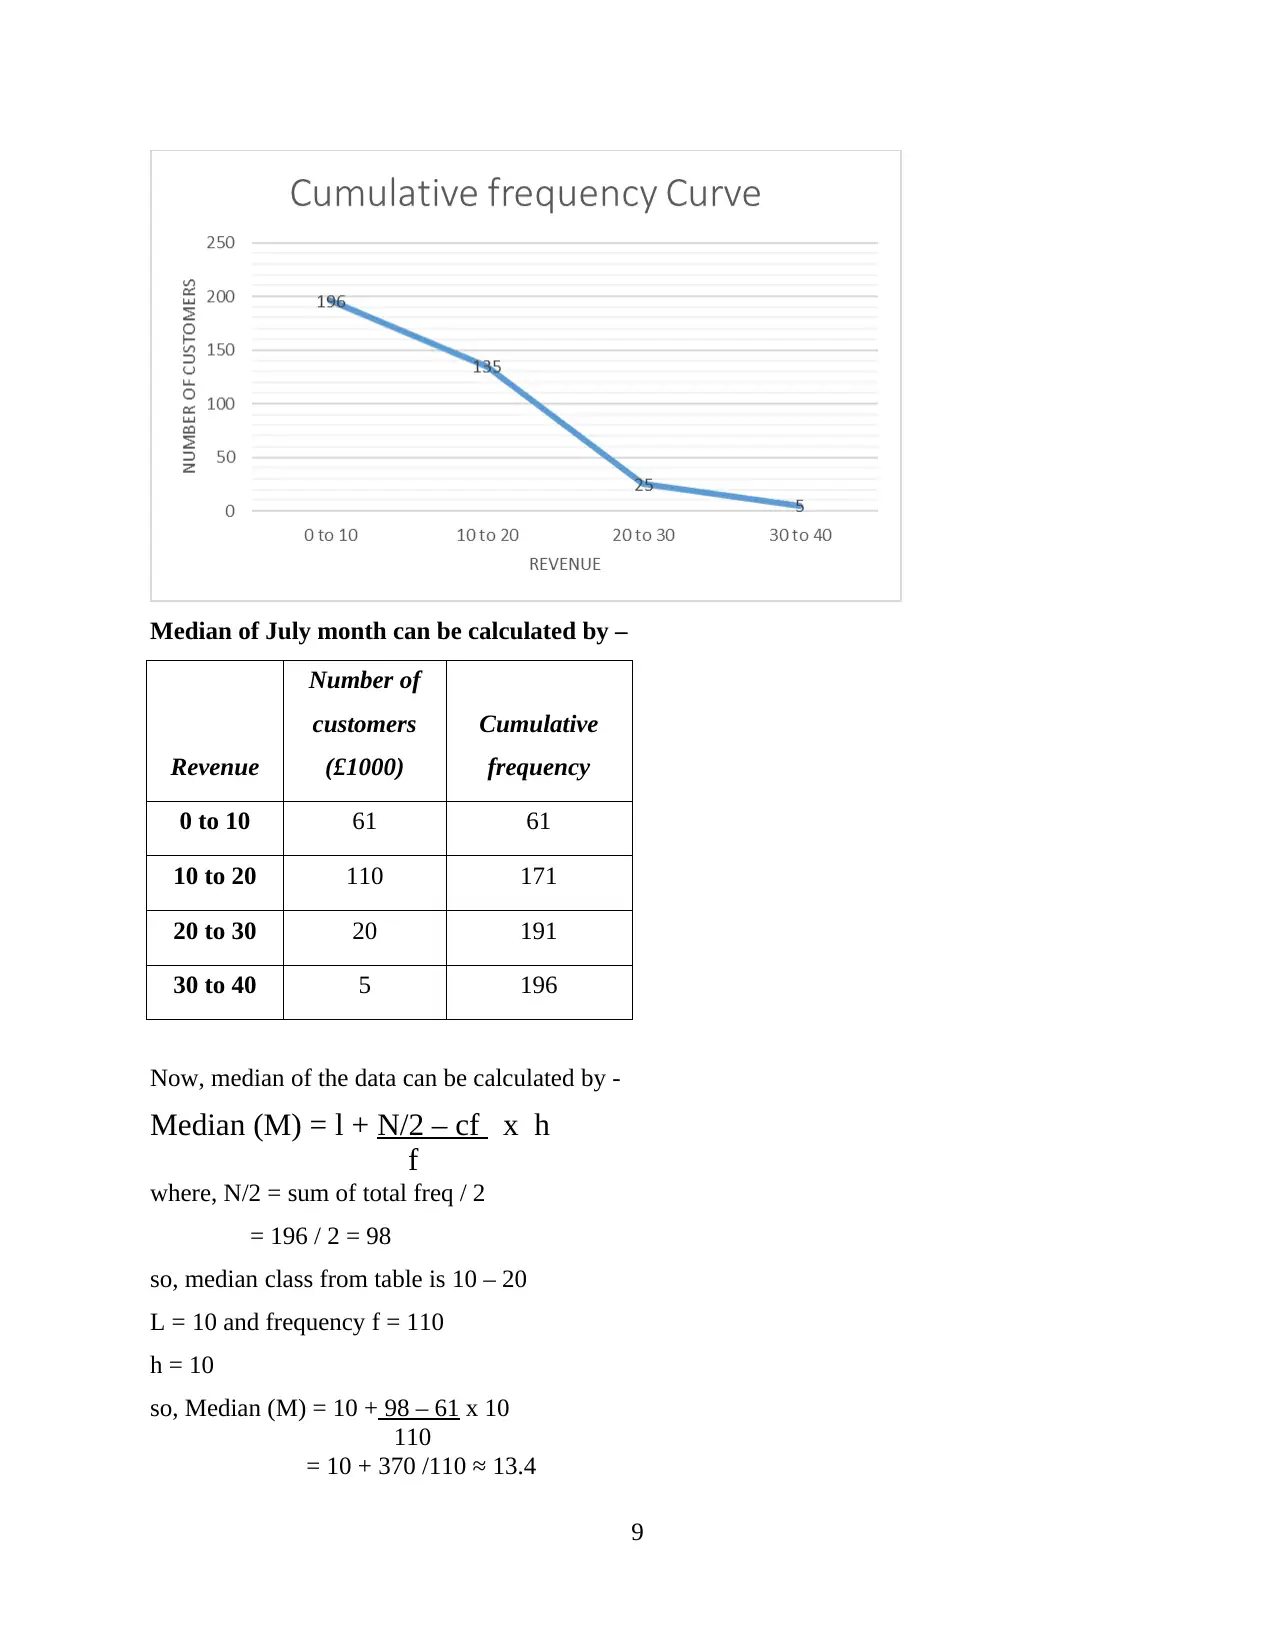
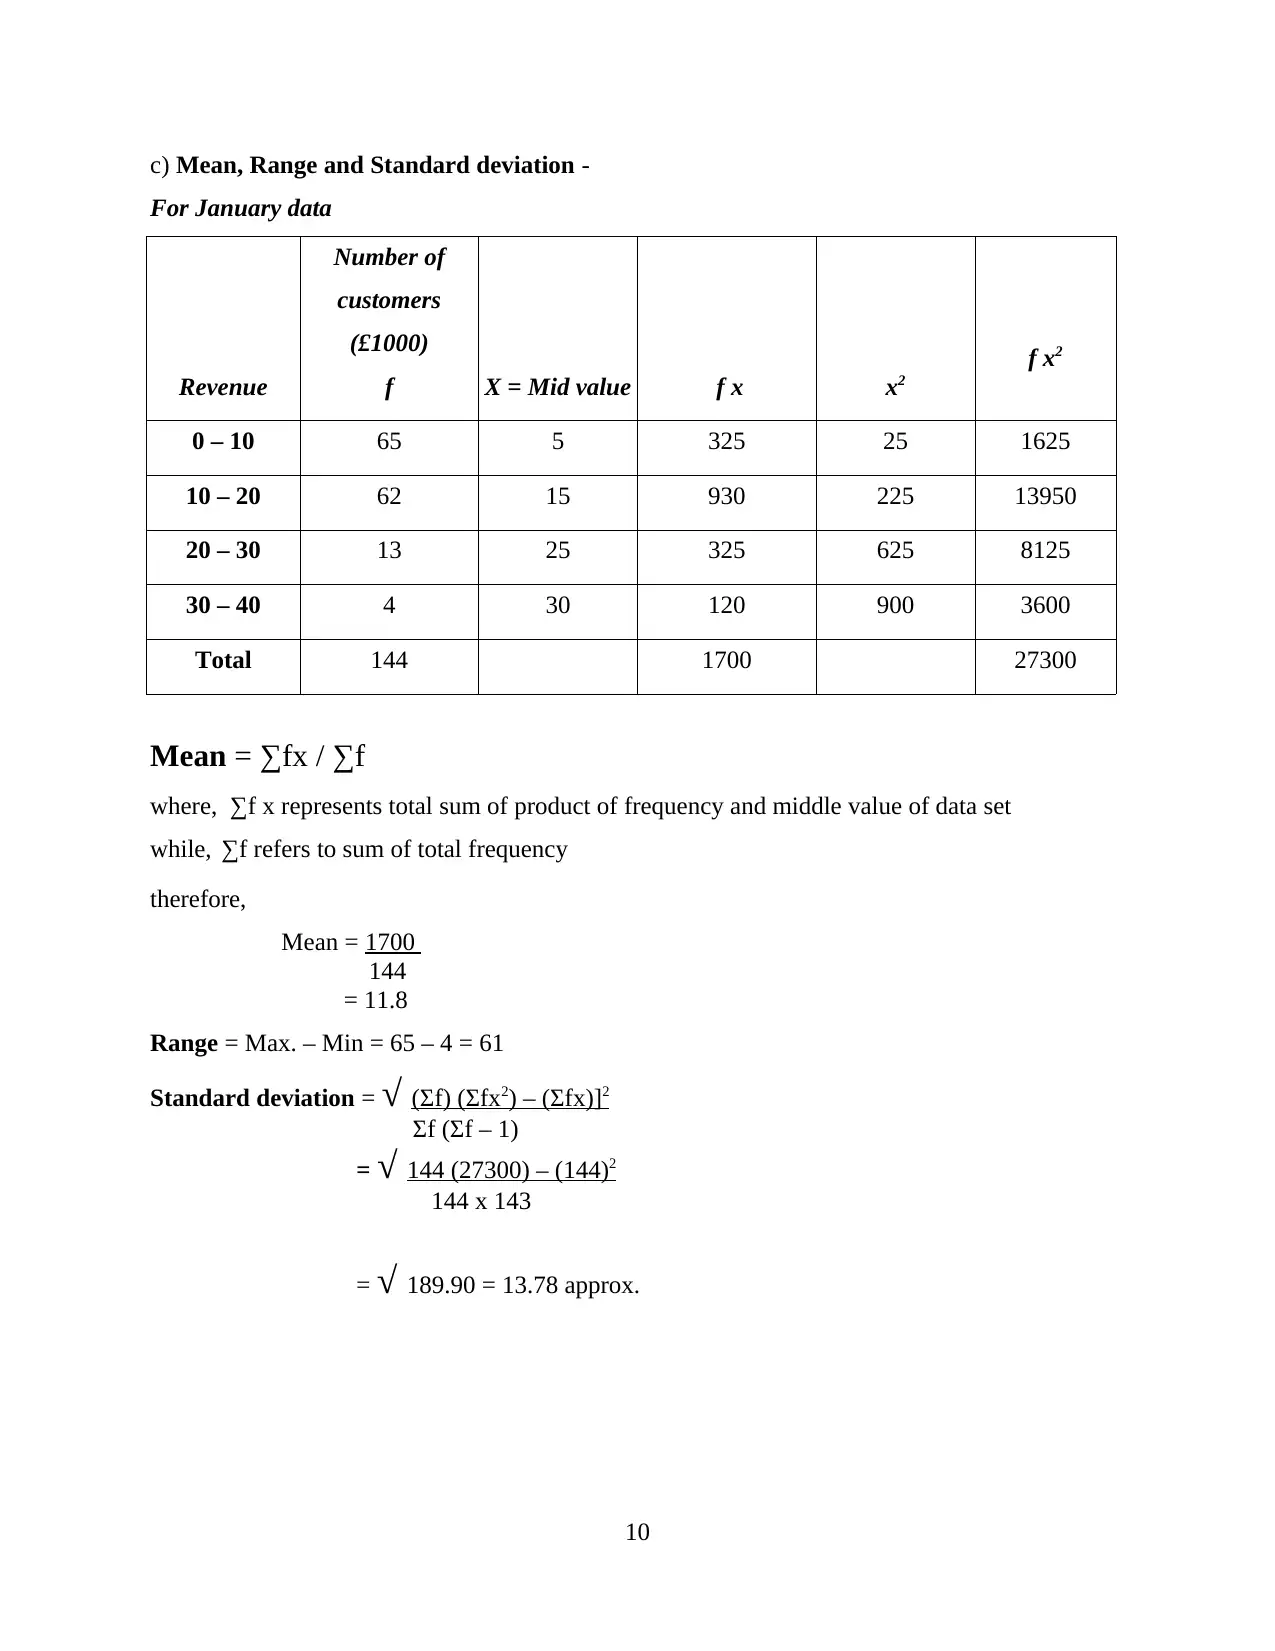
This assignment solution addresses a construction mathematics problem, specifically focusing on statistical analysis of revenue and customer data for a building services company. The solution begins with constructing histograms and calculating the mode for January and July revenue distributions. It then proceeds to determine the median using cumulative frequency curves for both months. Furthermore, the solution calculates the mean, range, and standard deviation for both datasets. The assignment also delves into hypothesis testing, analyzing the life of light bulbs and the mean age of a population. Finally, it tackles wave displacement problems, determining amplitudes, phases, periodic times, frequencies, and time taken by machines, utilizing compound angle formulas to express wave equations.
Document Page
8 Mathematics for Construction
tabler-icon-diamond-filled.svg

Paraphrase This Document

Need a fresh take? Get an instant paraphrase of this document with our AI Paraphraser
Document Page
Document Page
TASK 2
Scenario 1
Revenue
(Class Interval)
Number of customers
(£1000)
January July
0 – 5 27 22
5 – 10 38 39
10 – 15 40 69
15 – 20 22 41
20 – 30 13 20
30 – 40 4 5
Solution
a) Histogram for each January and July distribution can be represented in following way –
Revenue
Number of
customers
in January (£1000)
0 to 5 27
5 to 10 38
10 to 15 40
15 to 20 22
20 to 30 13
30 to 40 4
1
Document Page
Now, to calculate mode, firstly convert the unequal distribution into equal class interval in
following way –
Revenue
Number of
customers
(£1000)
January
0 to 10 65 (27 + 38)
10 to 20 62 (40 + 22)
20 to 30 13
30 to 40 4
From the above table, the highest frequency lies in the group of (0-10), therefore, taking this
class as modal class, mode of data can be calculated by using below formula
Mode (z) = L + f1 – f0 x h
2 f1 – f0 – f2
where, f1 gives highest frequency = 65
f0 lies above highest frequency = 0 and,
f2 lies below highest frequency = 62
2
tabler-icon-diamond-filled.svg

Paraphrase This Document

Need a fresh take? Get an instant paraphrase of this document with our AI Paraphraser
Document Page
h represents difference of class interval = 10 while,
L is the lower interval of modal class = 0,
Therefore, using these values, mode can be calculated as -
Mode (z) = 0 + 65 – 0 x 10
2 x 65 – 0 – 62
= 0 + 65 x 10
130 – 62
9.54
For July month -
Revenue
Number of
customers
in July (£1000)
0 to 5 22
5 to 10 39
10 to 15 69
15 to 20 41
20 to 30 20
30 to 40 5
3
Document Page
Now, for calculating mode, data of July month also convert into equal distribution in following
manner –
Revenue
Number of
customers
in July (£1000)
0 to 10 61 (22 + 39)
10 to 20 110 (69 + 41)
20 to 30 20
30 to 40 5
4
Document Page
From this table conversion, 10 to 20 group has highest frequency, so, taking this group as modal
class of grouped frequency, then mode can be calculated in following way –
Mode (z) = L + f1 – f0 x h
2 f1 – f0 – f2
where,
f1 = 110
f0 = 61 and,
f2 = 20
h = 10 and,
L = 10,
so, mode can be calculated as -
Mode (z) = 10 + 110 – 61 x 10
2 x 110 – 61 – 20
= 10 + 49 x 10
220 – 81
13.52
5
tabler-icon-diamond-filled.svg

Paraphrase This Document

Need a fresh take? Get an instant paraphrase of this document with our AI Paraphraser
Document Page
b)
Cumulative frequency curve can be constructed of January data after conversion from unequal to
equal distribution in following way either less than or more than type –
Revenue
Number of
customers
(£1000)
Less than O-give
curve
Cumulative
Frequency
0 to 10 65 10 65
10 to 20 62 20 127
20 to 30 13 30 140
30 to 40 4 40 144
6
Document Page
Calculation for median of January month –
Revenue
Number of
customers
(£1000)
Cumulative
Frequency
0 to 10 65 65
10 to 20 62 127
20 to 30 13 140
30 to 40 4 144
From above table, median of given data set can be calculated by using below numerical formula
-
Median (M) = L + N/2 – cf x h
f
Here, N/2 = sum of total observation
2
= 144 / 2 = 72
As per the given median will be lie within 10 to 20 group
L represents lowest interval = 10
h shows difference of class interval = 10
so,
Median (M) = 10 + 72 – 65 x 10
62
= 10 + 70/62
11.1
7
Document Page
Cumulative frequency curve for July data –
Revenue
Number of
customers
(£1000)
Less than
O-give
curve
Cumulative
Frequency
More than
O-give
curve
Cumulative
Frequency
0 to 10 61 10 61 0 196
10 to 20 110 20 171 10 135
20 to 30 20 30 191 20 25
30 to 40 5 40 196 30 5
8
tabler-icon-diamond-filled.svg

Paraphrase This Document

Need a fresh take? Get an instant paraphrase of this document with our AI Paraphraser
Document Page
Median of July month can be calculated by –
Revenue
Number of
customers
(£1000)
Cumulative
frequency
0 to 10 61 61
10 to 20 110 171
20 to 30 20 191
30 to 40 5 196
Now, median of the data can be calculated by -
Median (M) = l + N/2 – cf x h
f
where, N/2 = sum of total freq / 2
= 196 / 2 = 98
so, median class from table is 10 – 20
L = 10 and frequency f = 110
h = 10
so, Median (M) = 10 + 98 – 61 x 10
110
= 10 + 370 /110 ≈ 13.4
9
Document Page
c) Mean, Range and Standard deviation -
For January data
Revenue
Number of
customers
(£1000)
f X = Mid value f x x2
f x2
0 – 10 65 5 325 25 1625
10 – 20 62 15 930 225 13950
20 – 30 13 25 325 625 8125
30 – 40 4 30 120 900 3600
Total 144 1700 27300
Mean = fx / f
where, ∑f x represents total sum of product of frequency and middle value of data set
while, ∑f refers to sum of total frequency
therefore,
Mean = 1700
144
= 11.8
Range = Max. – Min = 65 – 4 = 61
Standard deviation = (Σf) (Σfx2) – (Σfx)]2
Σf (Σf – 1)
= 144 (27300) – (144)2
144 x 143
= 189.90 = 13.78 approx.
10
chevron_up_icon
1 out of 29
circle_padding
hide_on_mobile
zoom_out_icon
[object Object]