Business Decision Making Report: Consumer Behavior and Market Analysis
VerifiedAdded on 2023/02/10
|22
|3855
|95
Report
AI Summary
This report delves into the analysis of changing consumer behavior and preferences, examining their impact on businesses, particularly in the context of high street shops and malls. The study employs various data collection techniques, including primary and secondary research methods, such as questionnaires administered to professionals. The report presents a detailed survey methodology and sampling frame, focusing on consumer shopping habits and preferences. The collected data is then analyzed using representative values, measures of dispersion, quartiles, percentiles, and correlation coefficients to draw meaningful conclusions. The findings are visualized through graphs, including a trend line graph analyzing sales and profits. The report culminates in a formal presentation of the findings, providing insights for informed business decision-making and operational adjustments to meet consumer needs and preferences. The study emphasizes the influence of technical changes on consumer behavior and its implications for business strategies.
BUSINESS DECISION
MAKING
MAKING
Paraphrase This Document
Need a fresh take? Get an instant paraphrase of this document with our AI Paraphraser

TABLE OF CONTENTS
INTRODUCTION...........................................................................................................................1
TASK 1............................................................................................................................................1
1.1 Developing plan for data collection.................................................................................1
1.2 Presenting a survey methodology and sampling frame....................................................2
1.3 Designing the questionnaire which helps in acquiring all the information......................3
TASK 2............................................................................................................................................5
2.1 Compressing the gathered information with the help of representative values................5
2.2 Drawing conclusion over surveyed details.......................................................................6
2.3 Implication of measures of dispersion..............................................................................7
2.4 Analysing the quartile, percentile and correlation coefficient..........................................7
TASK 3............................................................................................................................................8
3.1 Presenting the graphs which represents a valid conclusion over presented survey.........8
3.2 Preparing an analysis of sales and profits retain by a business through Trend line graph10
3.3 presenting poster which contains all the findings...........................................................14
3.4 Writing a formal report...................................................................................................15
TASK 4..........................................................................................................................................15
A ..........................................................................................................................................15
B ..........................................................................................................................................16
C ..........................................................................................................................................17
D...........................................................................................................................................17
E............................................................................................................................................18
CONCLUSION..............................................................................................................................18
REFERENCES..............................................................................................................................19
INTRODUCTION
To analyse the changing consumer behaviour and preferences which impacts the
businesses on various segmentation. These are in information which in turn will be effective and
suitable for appropriate decision making. In present report, the main emphasis is payable over
analysing changing behaviour of consumers with shopping through high street shops and malls.
This will be beneficial in terms of making proper analysis over the facts which help in analysing
the convenience level of consumers. It also comprises with various surveys and data collecting
technique which will be measured with the help of representative’s values and measures of
dispersion. There is analysed data will be communicated among the professionals to make
necessary changes into operations as well as plan the business objective which matches to the
consumer needs.
TASK 1
1.1 Developing plan for data collection
The changing environment operations as well as implications of various technologies
which in context with a funnel to the professionals from various businesses as to make necessary
changes in their operational activities. Thus, the report consists of analysing the technical
changes influence consumers buying behaviour. The technical advancement will be effective and
helpful to the business in terms of covering a large number of consumers as well as have fruitful
growth in sales and revenue. On the other side, it will be convenience to the consumers as to
have the satisfactory level of products and services from the retail stores. Therefore, in relation
with analysing the factors which mainly influences the shopping behaviour as well as business
activities which will be analysed through various data collection techniques such as:
Primary data collection:
These are the information which in turn will be effective and adequate for the business
management as well as brings the accurate details relevant with the facts and issues. Thus, it
consists of assorted informant of data gathering such as observing the focus group. Preparing
questionnaires, taking interviews and study over various cases. Therefore, it brings the clear
details and analysis through all the issues (Baker, 2018). However, with the influence of such
techniques and methods of collecting the data will be effective and helpful to determine the
consumer preference, current market trends and fashion stated in the environment. On the basis
1
⊘ This is a preview!⊘
Do you want full access?
Subscribe today to unlock all pages.
Trusted by 1+ million students worldwide
of such collected information the professionals will become able to make necessary changes into
operations. They will be get to known consumer’s wants and demands which will provoke them
in making effective decisions. Therefore, there will be appropriate development of techniques
and operations which in turn have effective impacts over sales and profitability of the
organisation. Similarly, in the present study to analysing the impacts of technical changes into
the operations of retails and small businesses there will be preparation of questionnaires which
will be asked to 30 professionals which in turn make necessary changes into operational
activities of the business. They will correspond their views and ideas which gives the quick
review to the issues faced by the business in the current times.
Secondary data collection:
These are mainly examined the annual reports, assemblage information through internet
sites, articles, blogs as well as research over newspapers articles. Therefore, the use of various
secondary sources of data aggregation which in turn will be influential as to have right
information and details regarding the facts (Ferrell and Fraedrich, 2015). Moreover, this method
will be convenient, suitable and prominent in relation with covering the large areas and gathering
the effective information there can be use of several techniques which in turn has the positive
impacts over preparing the effective plans and forecasts which leads them to manage the
lucrativeness and intensify their product line in the market.
1.2 Presenting a survey methodology and sampling frame
Collecting data and information from different lactations, area and the group of
population there will be consideration of various activities which in turn will be effective and
helpful as to use the right techniques of generating the ideas. (Zsambok and Klein eds., 2014)
Similarly, in relation with collective the effective data and information through market there will
be implication of various techniques and operations to gather the relevant information.
Survey methodology: this a statistical approach which enables the researchers for
analysing the human behaviours. It will have done on mass population, individual unit. This
survey includes preparation of questionnaires and number which in turn helps in improving the
accuracy of outcomes (Popovič and et.al., 2012). Thus, to analyses the shopping behaviour of
consumers on the basis of their preferences for buying the goods and services will be beneficial
to them as to have the most satisfactory outcomes. It comprises with preparation of various
2
Paraphrase This Document
Need a fresh take? Get an instant paraphrase of this document with our AI Paraphraser
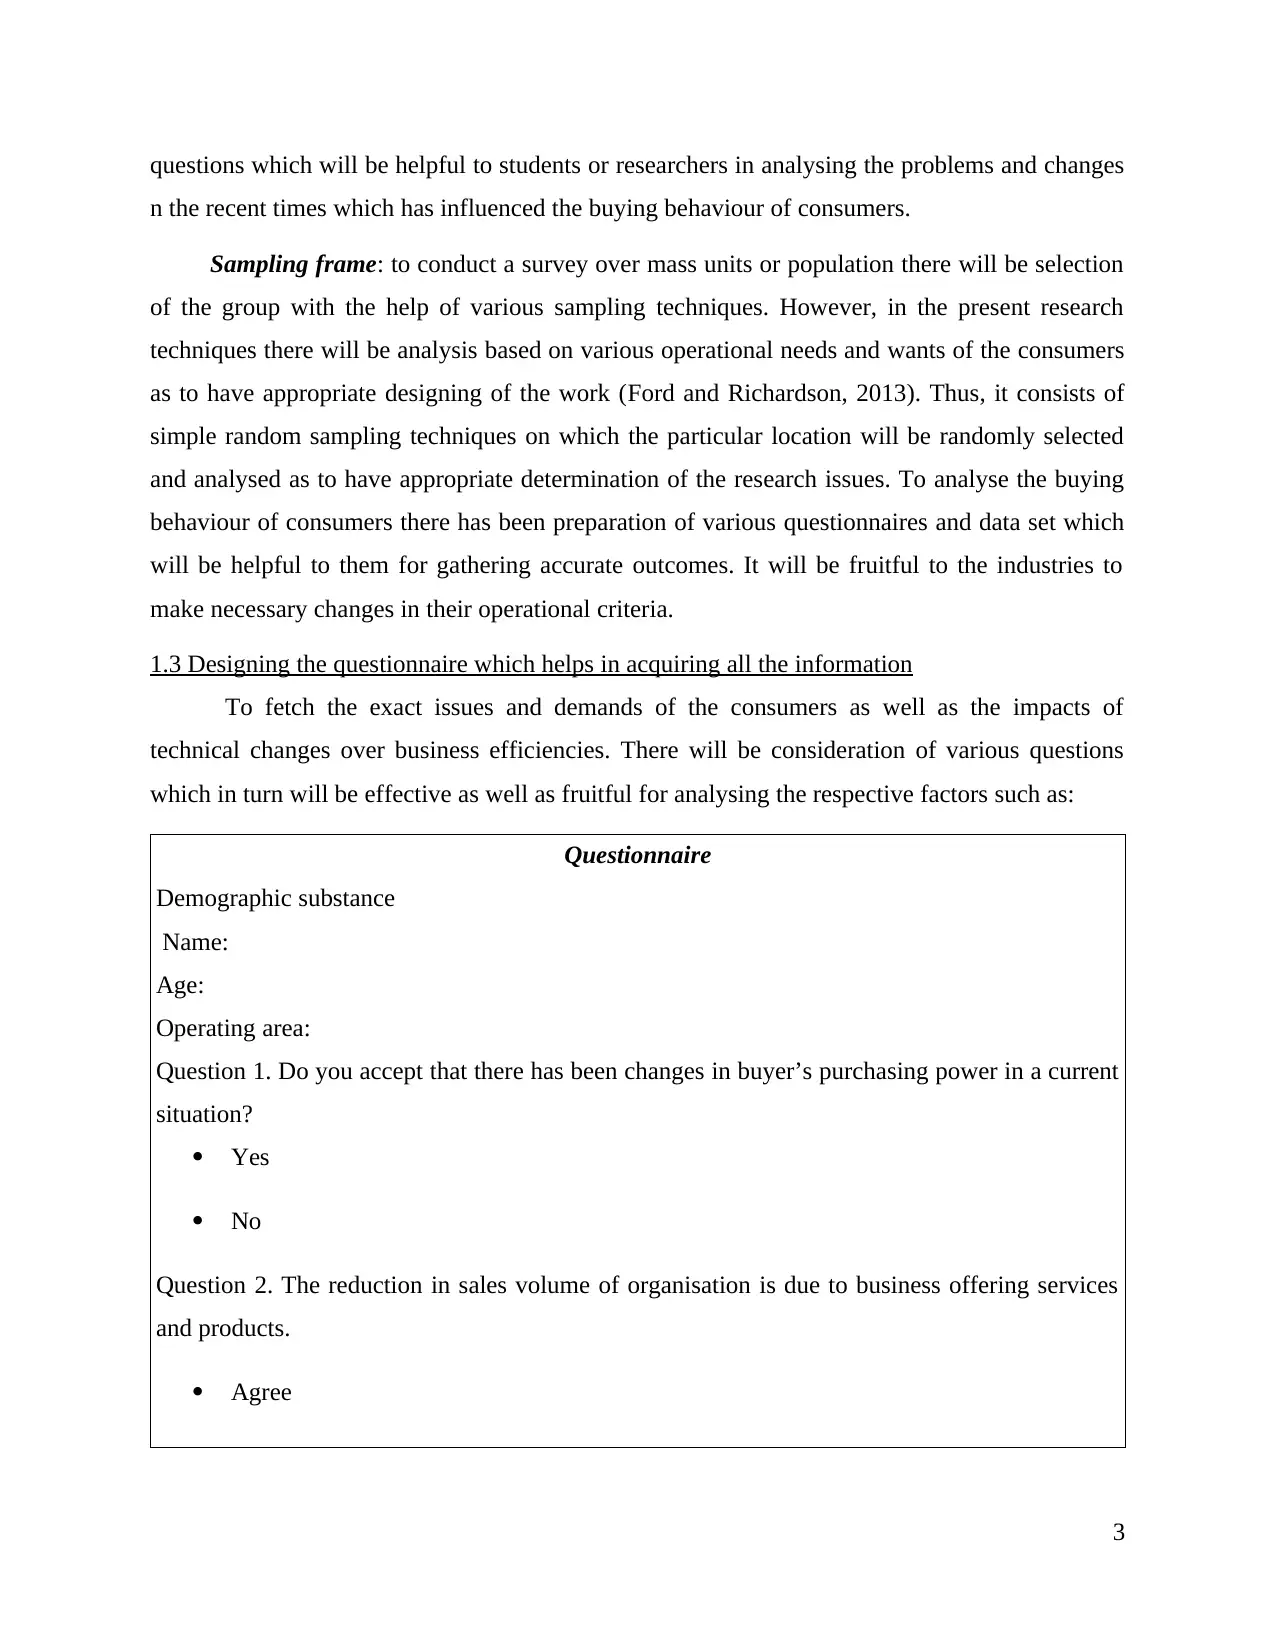
questions which will be helpful to students or researchers in analysing the problems and changes
n the recent times which has influenced the buying behaviour of consumers.
Sampling frame: to conduct a survey over mass units or population there will be selection
of the group with the help of various sampling techniques. However, in the present research
techniques there will be analysis based on various operational needs and wants of the consumers
as to have appropriate designing of the work (Ford and Richardson, 2013). Thus, it consists of
simple random sampling techniques on which the particular location will be randomly selected
and analysed as to have appropriate determination of the research issues. To analyse the buying
behaviour of consumers there has been preparation of various questionnaires and data set which
will be helpful to them for gathering accurate outcomes. It will be fruitful to the industries to
make necessary changes in their operational criteria.
1.3 Designing the questionnaire which helps in acquiring all the information
To fetch the exact issues and demands of the consumers as well as the impacts of
technical changes over business efficiencies. There will be consideration of various questions
which in turn will be effective as well as fruitful for analysing the respective factors such as:
Questionnaire
Demographic substance
Name:
Age:
Operating area:
Question 1. Do you accept that there has been changes in buyer’s purchasing power in a current
situation?
Yes
No
Question 2. The reduction in sales volume of organisation is due to business offering services
and products.
Agree
3
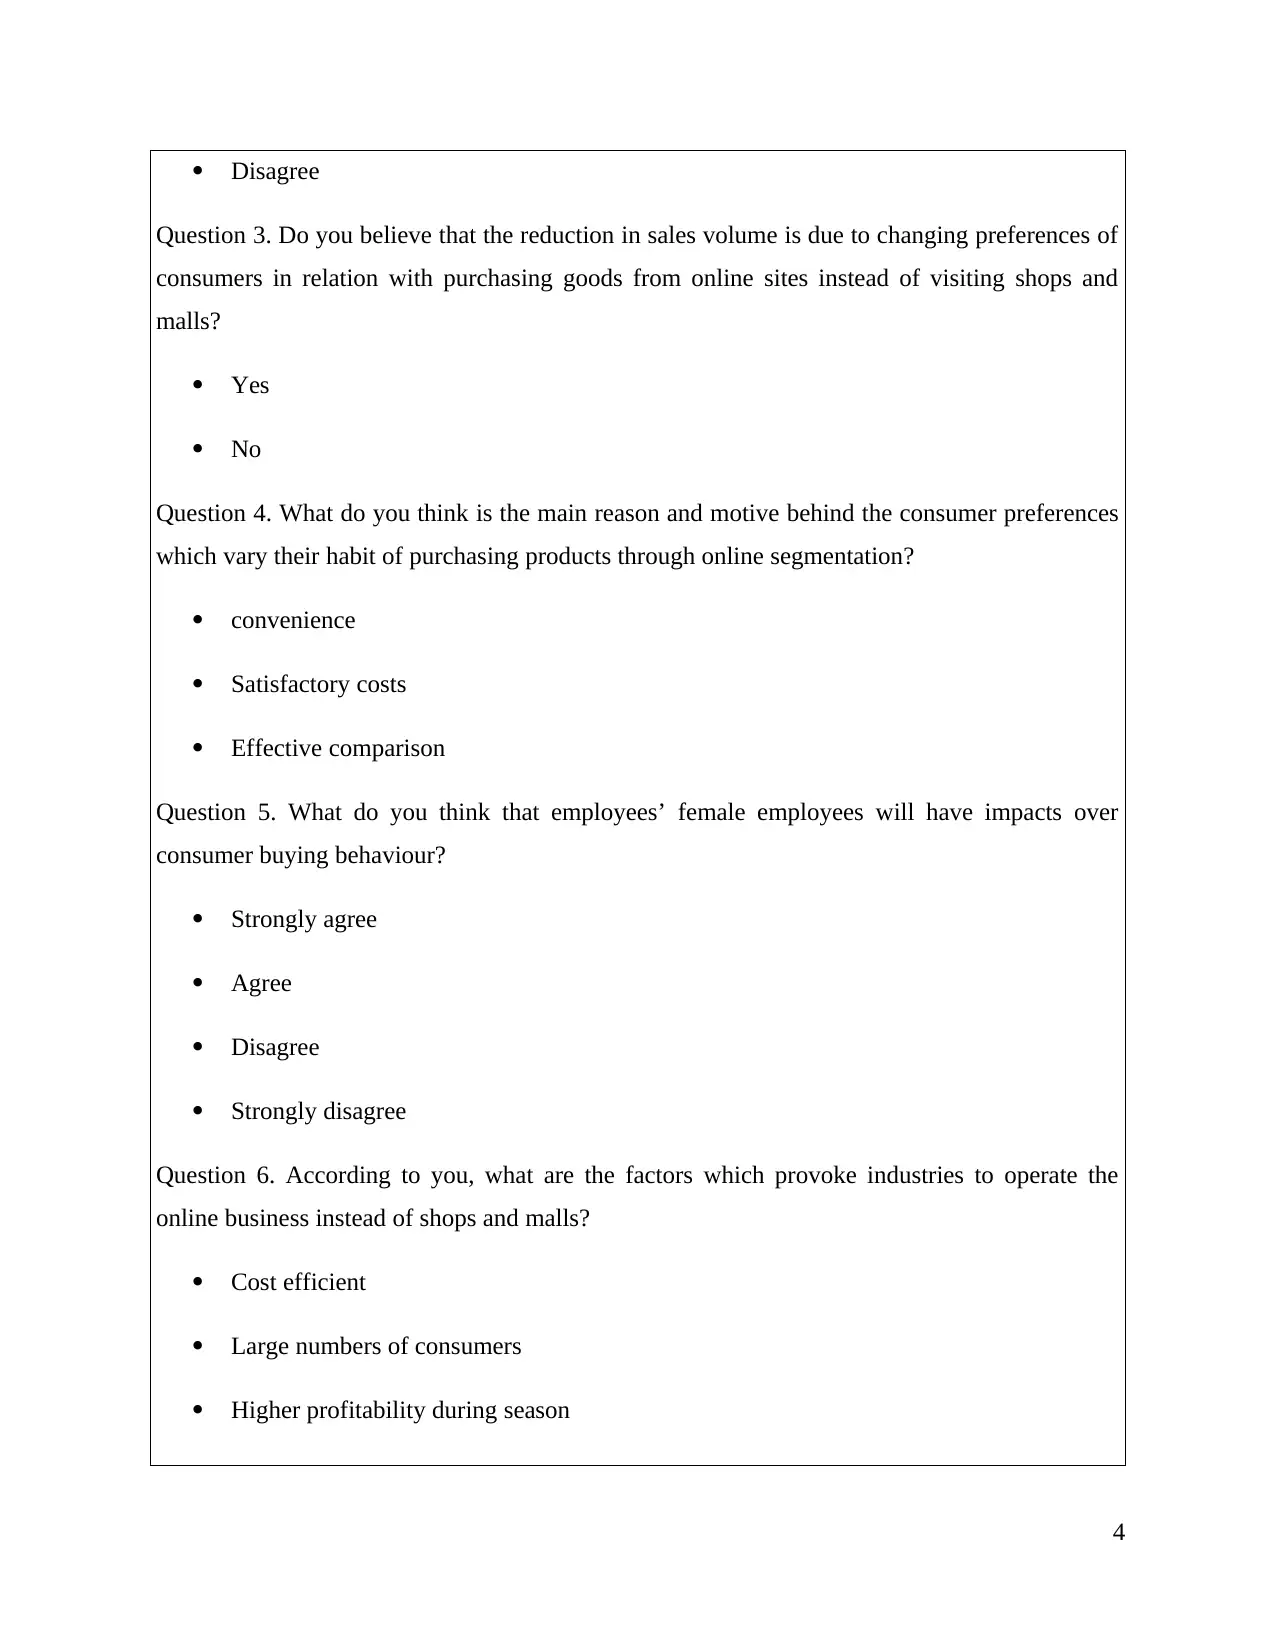
Disagree
Question 3. Do you believe that the reduction in sales volume is due to changing preferences of
consumers in relation with purchasing goods from online sites instead of visiting shops and
malls?
Yes
No
Question 4. What do you think is the main reason and motive behind the consumer preferences
which vary their habit of purchasing products through online segmentation?
convenience
Satisfactory costs
Effective comparison
Question 5. What do you think that employees’ female employees will have impacts over
consumer buying behaviour?
Strongly agree
Agree
Disagree
Strongly disagree
Question 6. According to you, what are the factors which provoke industries to operate the
online business instead of shops and malls?
Cost efficient
Large numbers of consumers
Higher profitability during season
4
⊘ This is a preview!⊘
Do you want full access?
Subscribe today to unlock all pages.
Trusted by 1+ million students worldwide

Effective offers to generate adequate revenue
Question 7. Do you think the consumer buying behaviour will be regulated as on their
understanding, learning or educational level?
Yes
No
TASK 2
2.1 Compressing the gathered information with the help of representative values
Survey outcomes:
Participants Question.2
Question.
4 Question. 6
1 1 2 2
2 1 1 2
3 2 2 3
4 1 1 2
5 2 1 2
6 1 1 4
7 2 3 4
8 1 1 1
9 2 1 1
10 1 3 1
11 2 1 2
12 1 1 2
13 2 1 1
14 1 2 1
15 2 3 1
16 1 1 3
17 2 1 3
18 1 3 4
19 2 3 2
20 1 2 1
21 1 2 1
22 1 1 1
23 1 2 2
24 2 2 4
25 1 2 4
26 1 2 4
27 2 3 3
28 1 3 3
29 1 2 3
5
Paraphrase This Document
Need a fresh take? Get an instant paraphrase of this document with our AI Paraphraser
30 2 2 3
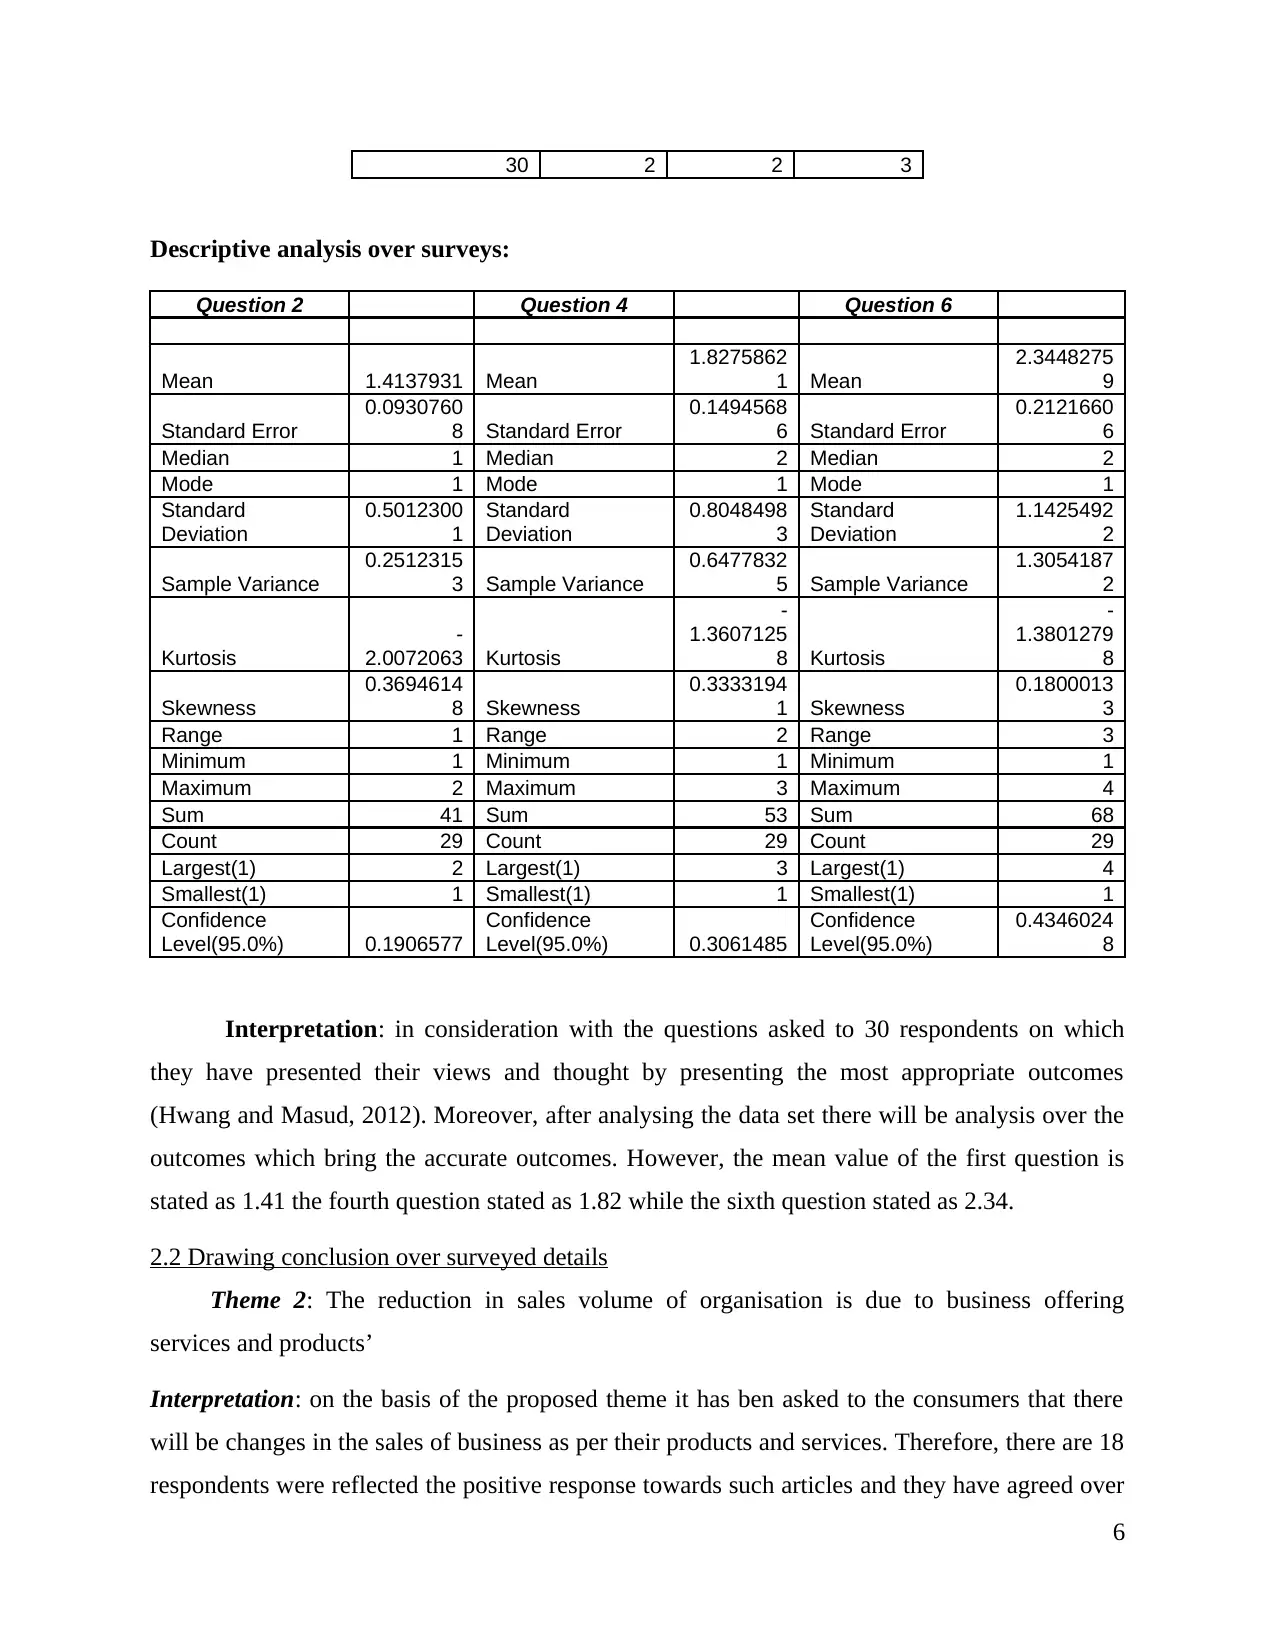
Descriptive analysis over surveys:
Question 2 Question 4 Question 6
Mean 1.4137931 Mean
1.8275862
1 Mean
2.3448275
9
Standard Error
0.0930760
8 Standard Error
0.1494568
6 Standard Error
0.2121660
6
Median 1 Median 2 Median 2
Mode 1 Mode 1 Mode 1
Standard
Deviation
0.5012300
1
Standard
Deviation
0.8048498
3
Standard
Deviation
1.1425492
2
Sample Variance
0.2512315
3 Sample Variance
0.6477832
5 Sample Variance
1.3054187
2
Kurtosis
-
2.0072063 Kurtosis
-
1.3607125
8 Kurtosis
-
1.3801279
8
Skewness
0.3694614
8 Skewness
0.3333194
1 Skewness
0.1800013
3
Range 1 Range 2 Range 3
Minimum 1 Minimum 1 Minimum 1
Maximum 2 Maximum 3 Maximum 4
Sum 41 Sum 53 Sum 68
Count 29 Count 29 Count 29
Largest(1) 2 Largest(1) 3 Largest(1) 4
Smallest(1) 1 Smallest(1) 1 Smallest(1) 1
Confidence
Level(95.0%) 0.1906577
Confidence
Level(95.0%) 0.3061485
Confidence
Level(95.0%)
0.4346024
8
Interpretation: in consideration with the questions asked to 30 respondents on which
they have presented their views and thought by presenting the most appropriate outcomes
(Hwang and Masud, 2012). Moreover, after analysing the data set there will be analysis over the
outcomes which bring the accurate outcomes. However, the mean value of the first question is
stated as 1.41 the fourth question stated as 1.82 while the sixth question stated as 2.34.
2.2 Drawing conclusion over surveyed details
Theme 2: The reduction in sales volume of organisation is due to business offering
services and products’
Interpretation: on the basis of the proposed theme it has ben asked to the consumers that there
will be changes in the sales of business as per their products and services. Therefore, there are 18
respondents were reflected the positive response towards such articles and they have agreed over
6
it. Similarly, 12 individual believes that there is no such influences of the products and services
which will reduce the sales of business (Pettigrew, 2014). Moreover, it can be said that there
have been necessary changes into the operations which brings the clear estimation of the facts
that there will be influences of products and services which were being offered among
consumers
Theme 4: main reason and motive behind the consumer preferences which varies their habit of
purchasing products through online segmentation
Interpretation: In consideration with the above theme it has been asked to the
professionals that the motive behind consumer shopping behaviour through online segmentation.
Therefore, it represents that there are a majorities of response such as 40% in favour of
convenience. 36.67% are in favour of cost efficiencies while 23.33% are in favour of effective
comparison. Moreover, the main reason is convenience of the online sites which bring the
professionals most appropriate gains.
Theme 6: the factors which provokes industries to operate the online business instead of shops
and malls
Interpretation. It has been asked to the consumers that the factors which provokes
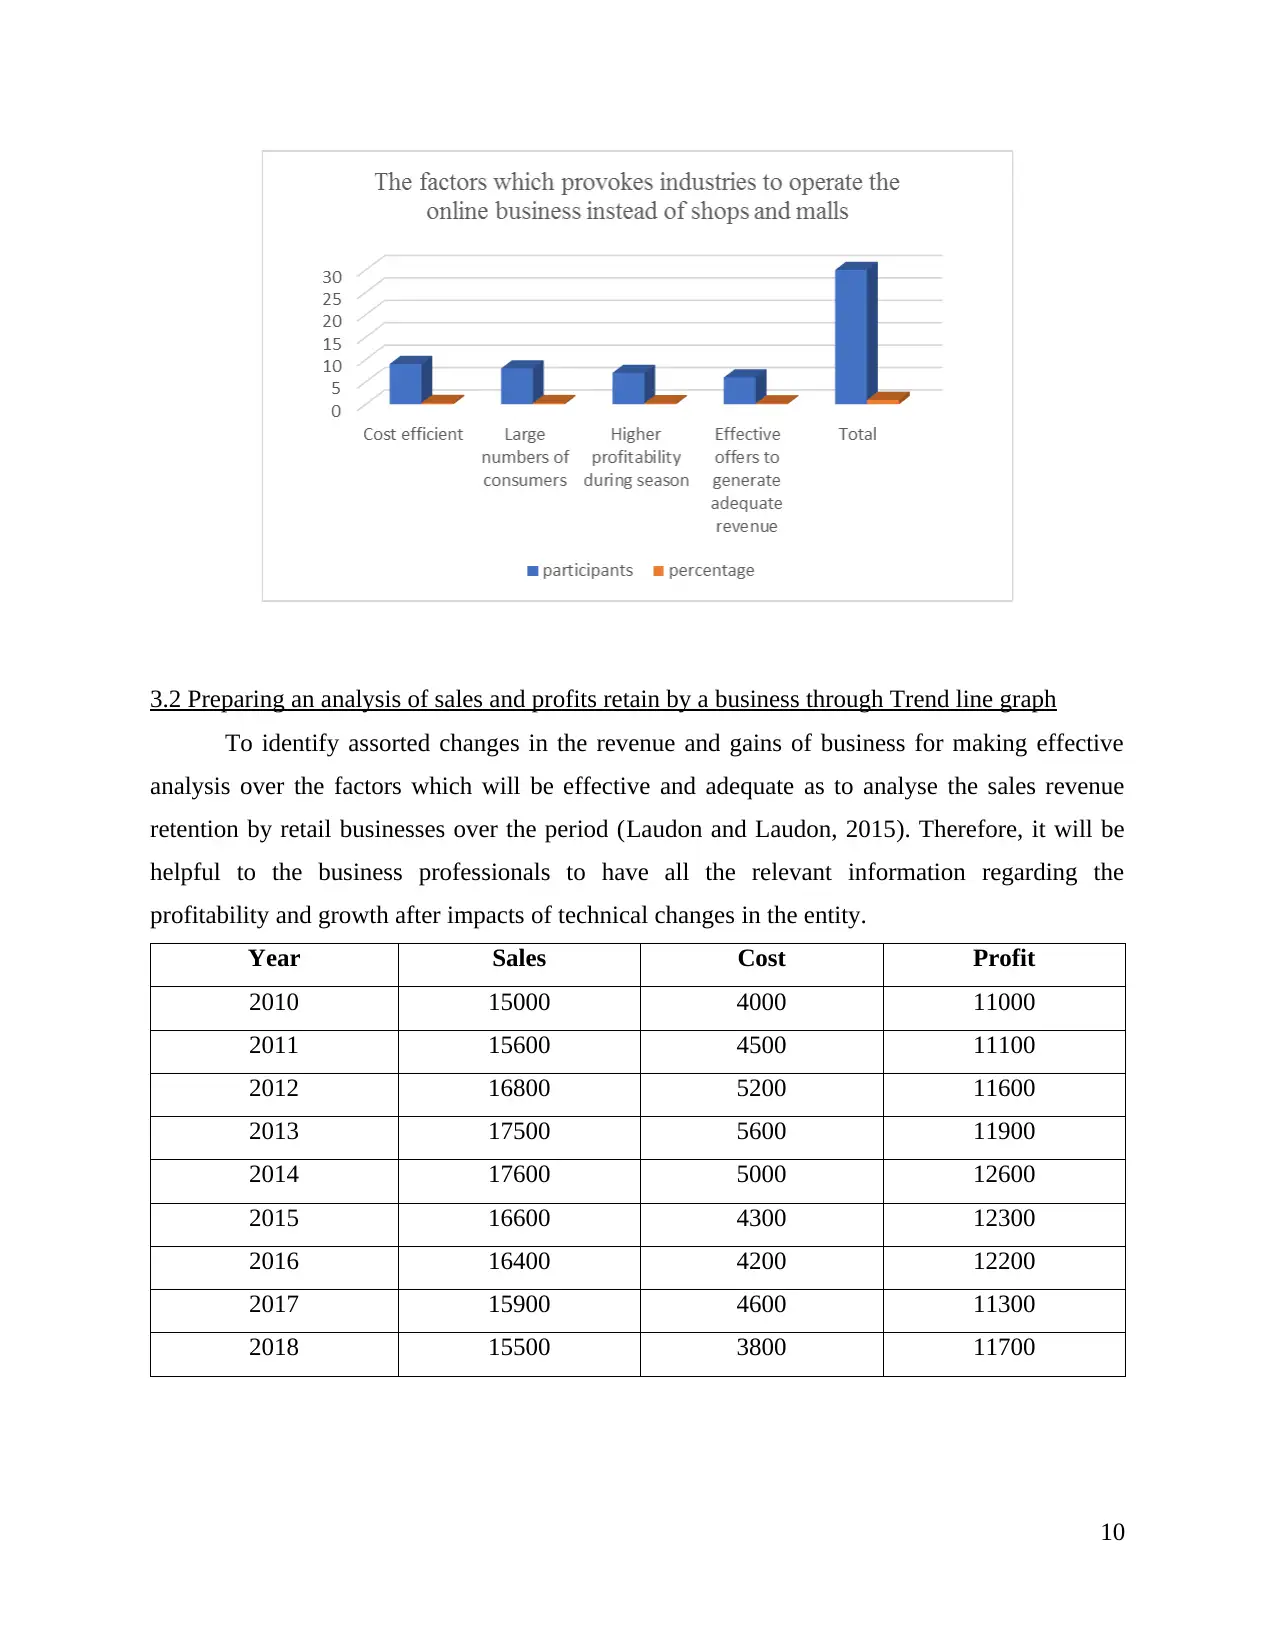
industries to make online operations are mainly associated with the cost efficiency as there are
lower labour rates which in turn will be effective and helpful for generating the appropriate
amount of revenue.
2.3 Implication of measures of dispersion
Interpretation: In relation with analysing the measures of dispersion. In question 2 it
was 0.501, in question 4 it was 0.80 and in question 6 it was 1.14.
2.4 Analysing the quartile, percentile and correlation coefficient
Quartile/percentile:
Correlation:
correlation Question.2 Question. 4
Question.
6
1 1
2 0.09463543 1
2 0.05376158 0.22231168 1
7
which will reduce the sales of business (Pettigrew, 2014). Moreover, it can be said that there
have been necessary changes into the operations which brings the clear estimation of the facts
that there will be influences of products and services which were being offered among
consumers
Theme 4: main reason and motive behind the consumer preferences which varies their habit of
purchasing products through online segmentation
Interpretation: In consideration with the above theme it has been asked to the
professionals that the motive behind consumer shopping behaviour through online segmentation.
Therefore, it represents that there are a majorities of response such as 40% in favour of
convenience. 36.67% are in favour of cost efficiencies while 23.33% are in favour of effective
comparison. Moreover, the main reason is convenience of the online sites which bring the
professionals most appropriate gains.
Theme 6: the factors which provokes industries to operate the online business instead of shops
and malls
Interpretation. It has been asked to the consumers that the factors which provokes
industries to make online operations are mainly associated with the cost efficiency as there are
lower labour rates which in turn will be effective and helpful for generating the appropriate
amount of revenue.
2.3 Implication of measures of dispersion
Interpretation: In relation with analysing the measures of dispersion. In question 2 it
was 0.501, in question 4 it was 0.80 and in question 6 it was 1.14.
2.4 Analysing the quartile, percentile and correlation coefficient
Quartile/percentile:
Correlation:
correlation Question.2 Question. 4
Question.
6
1 1
2 0.09463543 1
2 0.05376158 0.22231168 1
7
⊘ This is a preview!⊘
Do you want full access?
Subscribe today to unlock all pages.
Trusted by 1+ million students worldwide
TASK 3
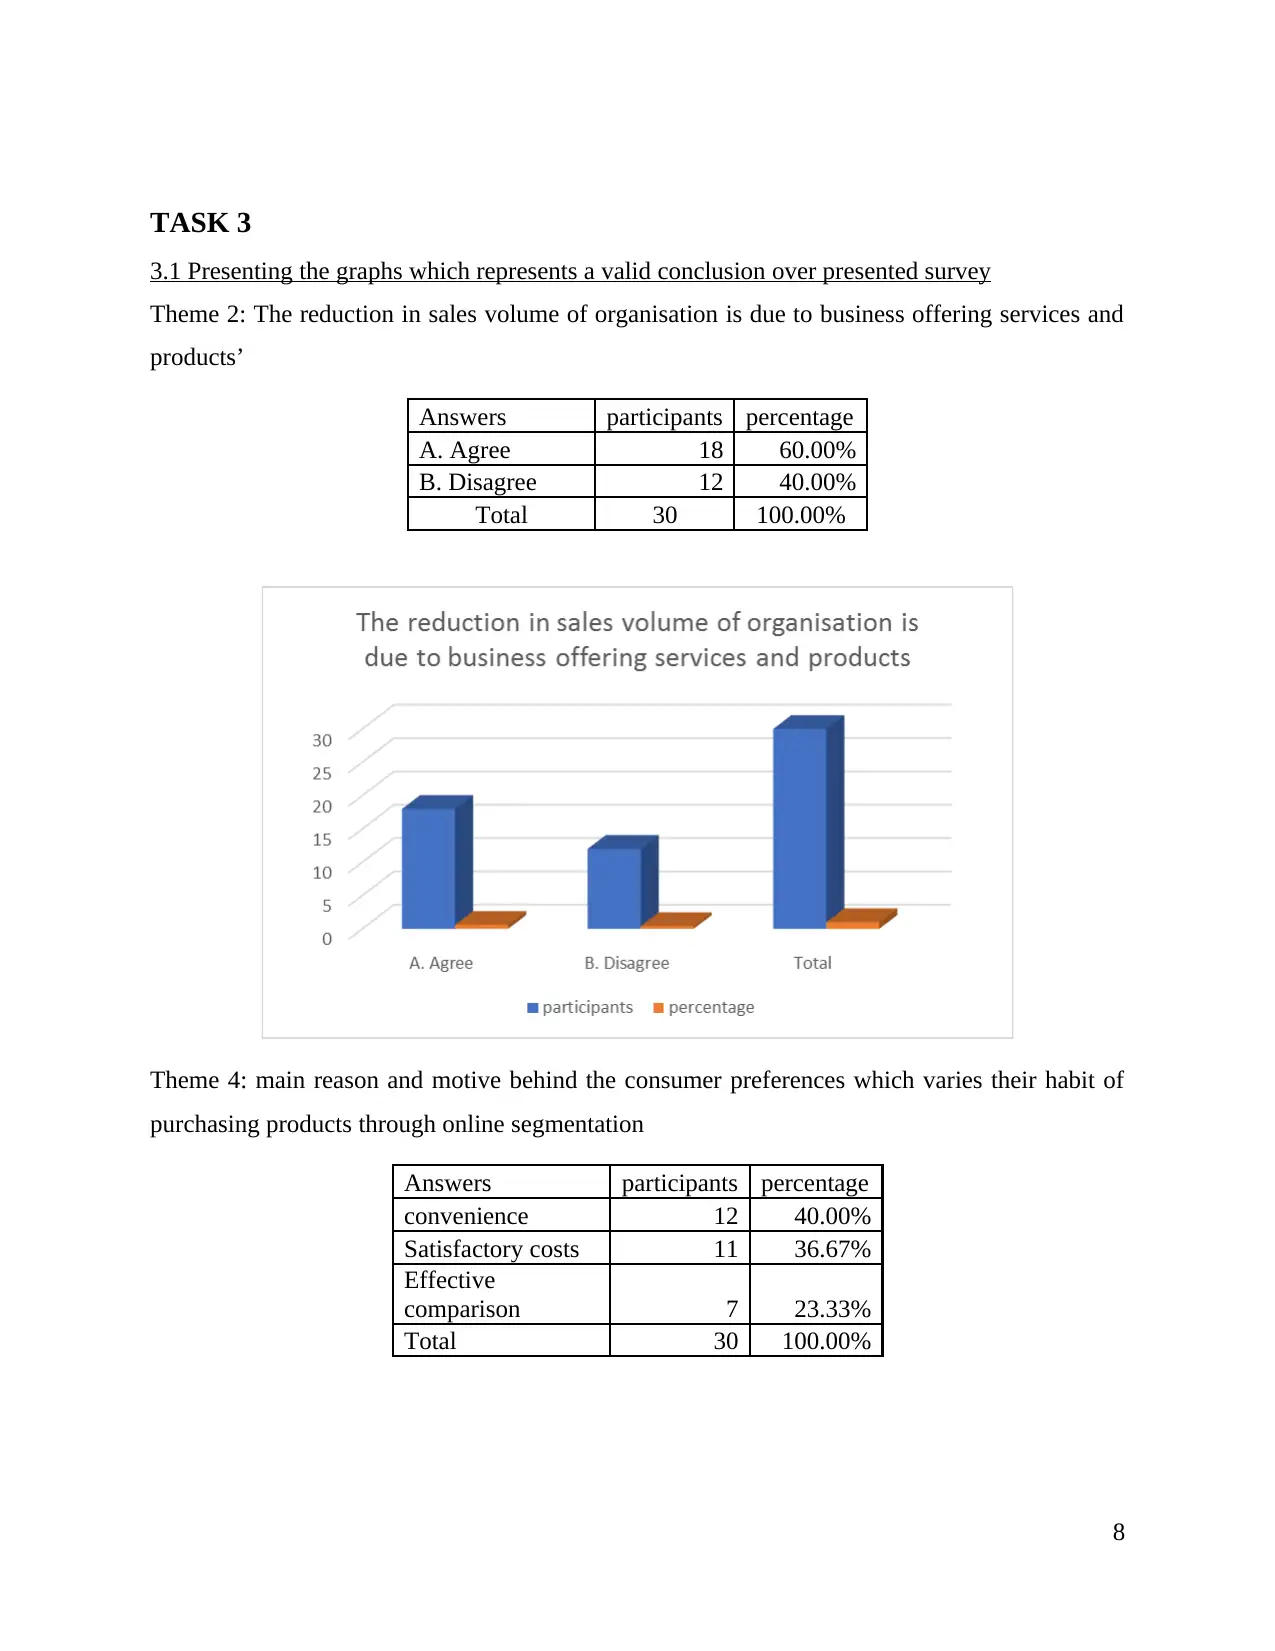
3.1 Presenting the graphs which represents a valid conclusion over presented survey
Theme 2: The reduction in sales volume of organisation is due to business offering services and
products’
Answers participants percentage
A. Agree 18 60.00%
B. Disagree 12 40.00%
Total 30 100.00%
Theme 4: main reason and motive behind the consumer preferences which varies their habit of
purchasing products through online segmentation
Answers participants percentage
convenience 12 40.00%
Satisfactory costs 11 36.67%
Effective
comparison 7 23.33%
Total 30 100.00%
8
Paraphrase This Document
Need a fresh take? Get an instant paraphrase of this document with our AI Paraphraser

Theme 6: the factors which provokes industries to operate the online business instead of shops
and malls
Answers participants percentage
Cost efficient 9 30.00%
Large numbers
of consumers 8 26.67%
Higher
profitability
during season 7 23.33%
Effective offers
to generate
adequate
revenue 6 20.00%
Total 30 100.00%
9
and malls
Answers participants percentage
Cost efficient 9 30.00%
Large numbers
of consumers 8 26.67%
Higher
profitability
during season 7 23.33%
Effective offers
to generate
adequate
revenue 6 20.00%
Total 30 100.00%
9
3.2 Preparing an analysis of sales and profits retain by a business through Trend line graph
To identify assorted changes in the revenue and gains of business for making effective
analysis over the factors which will be effective and adequate as to analyse the sales revenue
retention by retail businesses over the period (Laudon and Laudon, 2015). Therefore, it will be
helpful to the business professionals to have all the relevant information regarding the
profitability and growth after impacts of technical changes in the entity.
Year Sales Cost Profit
2010 15000 4000 11000
2011 15600 4500 11100
2012 16800 5200 11600
2013 17500 5600 11900
2014 17600 5000 12600
2015 16600 4300 12300
2016 16400 4200 12200
2017 15900 4600 11300
2018 15500 3800 11700
10
⊘ This is a preview!⊘
Do you want full access?
Subscribe today to unlock all pages.
Trusted by 1+ million students worldwide
1 out of 22
Related Documents


Your All-in-One AI-Powered Toolkit for Academic Success.
+13062052269
info@desklib.com
Available 24*7 on WhatsApp / Email
![[object Object]](/_next/static/media/star-bottom.7253800d.svg)
Unlock your academic potential
Copyright © 2020–2026 A2Z Services. All Rights Reserved. Developed and managed by ZUCOL.