Consumer Preference and Market Analysis for Fresh Juice Drinks
VerifiedAdded on 2019/12/03
|20
|3882
|59
Report
AI Summary
This report provides a comprehensive analysis of the fresh juice market, focusing on consumer behavior and market trends for ABC, a fresh juice manufacturer and retailer. The report encompasses primary and secondary research to assess consumer preferences, attitudes, and buying behavior towards fresh juice products. It details the methodologies employed, including survey design and sampling techniques, and summarizes secondary data such as sales and profit figures. The analysis includes statistical measures like mean, median, standard deviation, quartiles, percentiles, and correlation coefficients to derive valid conclusions and inform business decisions. Furthermore, the report covers the use of spreadsheet graphs, trend line creation for market forecasting, and information processing tools for project planning and financial decision-making. The findings highlight key consumer preferences, market trends, and financial performance metrics, providing actionable insights for ABC's business strategy.

BDM
Paraphrase This Document
Need a fresh take? Get an instant paraphrase of this document with our AI Paraphraser
Table of Contents
INTRODUCTION...........................................................................................................................1
TASK 1............................................................................................................................................1
1.1 Plan for the primary and secondary research to assess the consumer preference, attitude
and buying behavior...............................................................................................................1
1.2 Survey methodology and sampling frame used in order to carry out the research..........2
1.3 Designing of Questionnaire..............................................................................................2
TASK 2............................................................................................................................................3
2.1 Summarizing the secondary data in order to create information for decision making.....3
2.2 Analysis of the results to draw valid conclusion..............................................................4
2.3 Analysis of the data by using measures of dispersion for the decision making...............7
2.4 Use of quartiles, percentiles and correlation coefficient in the business decision making8
TASK 3............................................................................................................................................9
3.1 Producing graph by using spreadsheet and drawing the valid conclusion based upon it.9
3.2 Creating the trend line to forecast the market for the fresh juice drink..........................10
3.3 Business presentation.....................................................................................................11
3.4 Producing of formal business report for the fresh juice drink market............................11
TASK 4..........................................................................................................................................12
4.1 Using suitable information processing tools..................................................................12
4.2 Preparation of the activities for the project plan and determination of the critical path 12
4.3 Use of financial tools in decision making aspects..........................................................15
CONCLUSION..............................................................................................................................16
REFERENCES..............................................................................................................................17
INTRODUCTION
Business decision making can be defined as a process in which finance manager of an
organization selects the best option among the several alternatives. Optimum utilization of
financial resources is highly dependent upon the decision taken by the finance manager. Thus,
finance manager plays a vital role in attaining success in the dynamic business environment
(Anderson and et.al, 2015). The present report will help ABC, a fresh juice manufacturer and
retailer, in assessing the emerging trend in relation to the new juice product. This report depicts
the primary and secondary research which helps organization in assessing the consumer
preference, attitude and buying behavior towards the fresh juice product. Besides this, it will also
develop the understanding about the trend line which helps organization in assessing the future
sales pattern. Further, it will help in understanding the information processing tools which
support organization in making suitable decision.
TASK 1
1.1 Plan for the primary and secondary research to assess the consumer preference, attitude and
buying behavior
ABC fresh juice manufacturer undertakes both primary and secondary research in order
to assess the profile, preference, attitude and buying behavior of the customers. Primary and
secondary research both provides assistance to researcher in assessing the market potential for
the fresh juice product. Plan for the primary and secondary data collection are enumerated
below:
Plan for the primary data collection: In order to collect primary data, researcher
undertakes survey technique which helps in collecting the suitable data that addresses the
research problem. Researcher conducts survey by preparing an appropriate questionnaire. For
survey, researcher needs to select the sample size upon which survey will be conducted. After
the selection of sample size, researcher will conduct survey with the help of questionnaire. By
including both close and open ended questions, researcher will be able to assess the consumer
attitude and preference towards the fresh juice drink.
Plan for the secondary data collection: Along with the primary data, secondary data is also
collected by the researcher which helps in assessing the buying behavior of customers towards
the fresh juice. Secondary data consists of that information which is already collected by the
1
⊘ This is a preview!⊘
Do you want full access?
Subscribe today to unlock all pages.
Trusted by 1+ million students worldwide
other researcher for their own research purpose (Badri and et.al, 2015). There are several sources
which can be used by researcher in their research study. Secondary data includes sources such as
books, journals, research papers and government sources which will provide assistance to the
researcher in collecting suitable data. Library has the wide stuff of the books, research papers
and articles which are published by another researcher (Zsambok and Klein, 2014). In addition to
this, government also publishes periodical reports which provide deeper insight about the current
market position, trend and development.
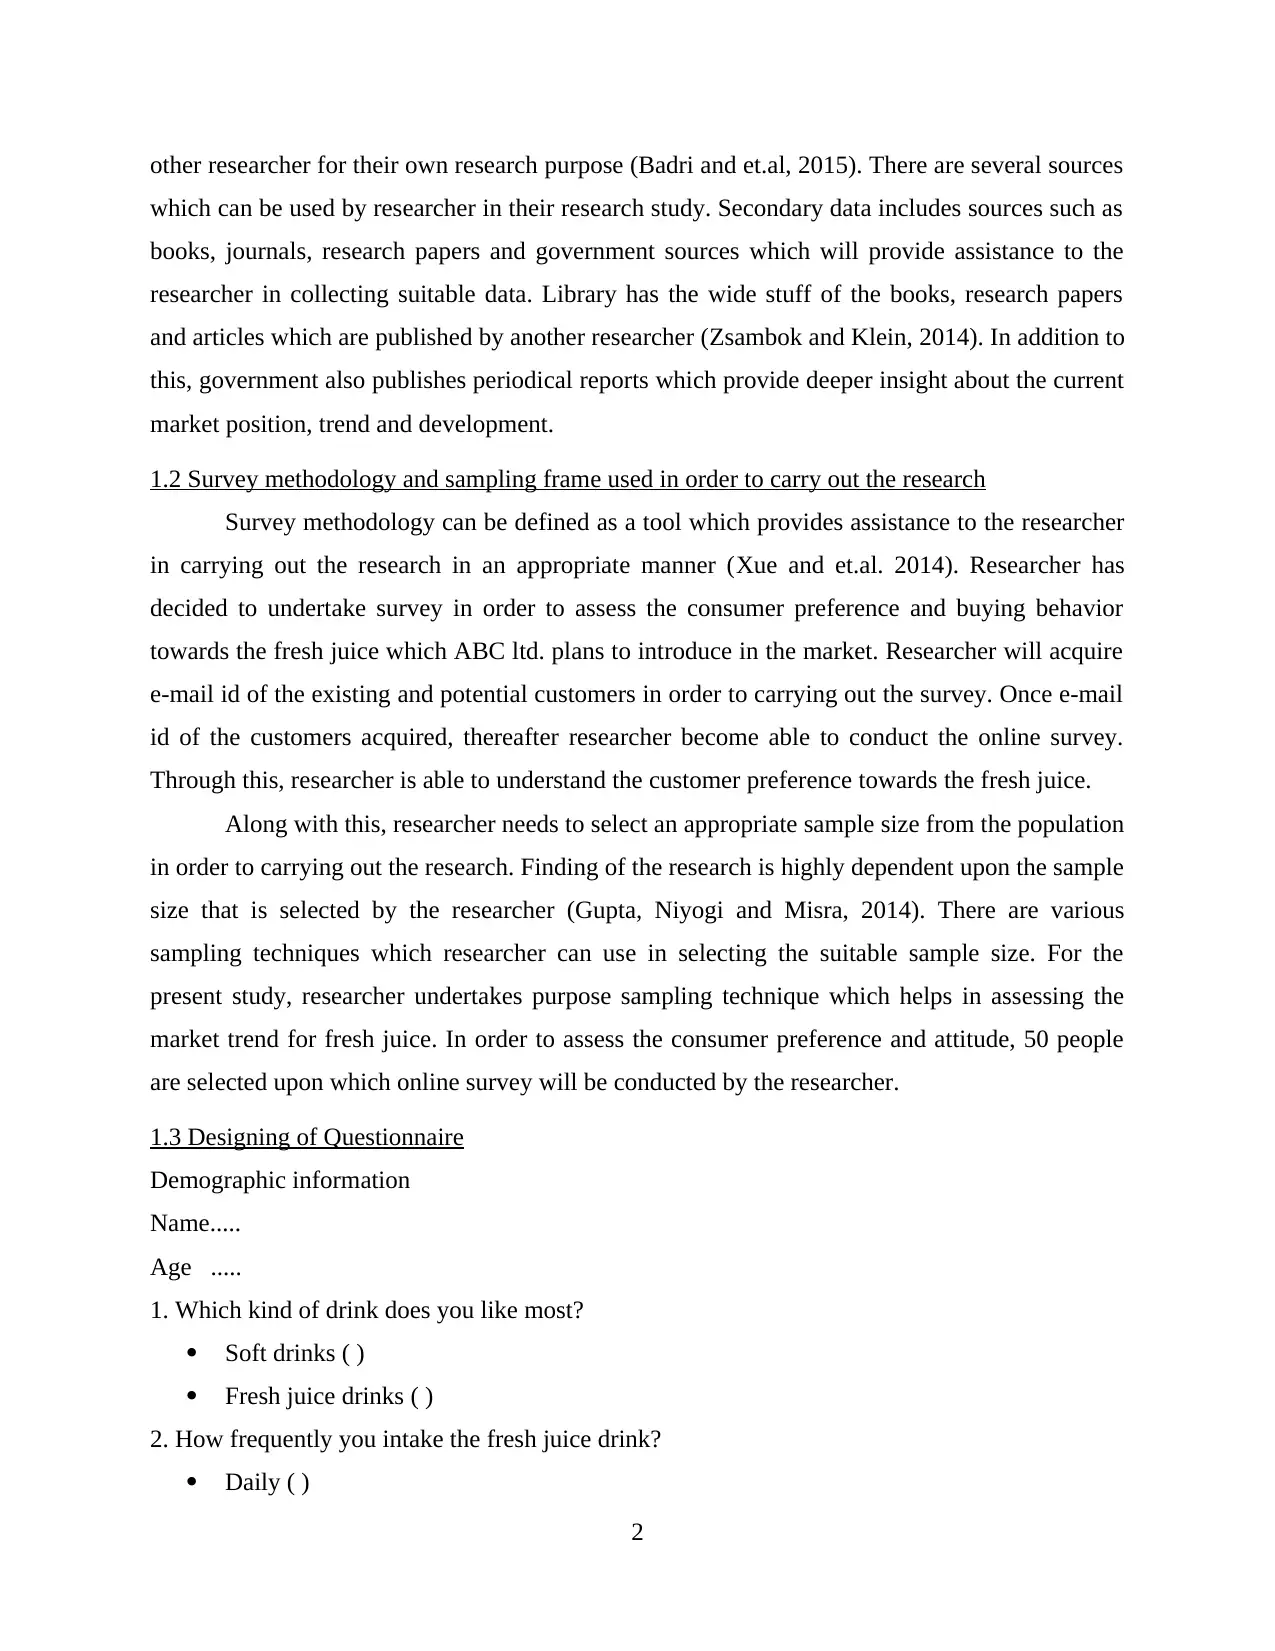
1.2 Survey methodology and sampling frame used in order to carry out the research
Survey methodology can be defined as a tool which provides assistance to the researcher
in carrying out the research in an appropriate manner (Xue and et.al. 2014). Researcher has
decided to undertake survey in order to assess the consumer preference and buying behavior
towards the fresh juice which ABC ltd. plans to introduce in the market. Researcher will acquire
e-mail id of the existing and potential customers in order to carrying out the survey. Once e-mail
id of the customers acquired, thereafter researcher become able to conduct the online survey.
Through this, researcher is able to understand the customer preference towards the fresh juice.
Along with this, researcher needs to select an appropriate sample size from the population
in order to carrying out the research. Finding of the research is highly dependent upon the sample
size that is selected by the researcher (Gupta, Niyogi and Misra, 2014). There are various
sampling techniques which researcher can use in selecting the suitable sample size. For the
present study, researcher undertakes purpose sampling technique which helps in assessing the
market trend for fresh juice. In order to assess the consumer preference and attitude, 50 people
are selected upon which online survey will be conducted by the researcher.
1.3 Designing of Questionnaire
Demographic information
Name.....
Age .....
1. Which kind of drink does you like most?
Soft drinks ( )
Fresh juice drinks ( )
2. How frequently you intake the fresh juice drink?
Daily ( )
2
which can be used by researcher in their research study. Secondary data includes sources such as
books, journals, research papers and government sources which will provide assistance to the
researcher in collecting suitable data. Library has the wide stuff of the books, research papers
and articles which are published by another researcher (Zsambok and Klein, 2014). In addition to
this, government also publishes periodical reports which provide deeper insight about the current
market position, trend and development.
1.2 Survey methodology and sampling frame used in order to carry out the research
Survey methodology can be defined as a tool which provides assistance to the researcher
in carrying out the research in an appropriate manner (Xue and et.al. 2014). Researcher has
decided to undertake survey in order to assess the consumer preference and buying behavior
towards the fresh juice which ABC ltd. plans to introduce in the market. Researcher will acquire
e-mail id of the existing and potential customers in order to carrying out the survey. Once e-mail
id of the customers acquired, thereafter researcher become able to conduct the online survey.
Through this, researcher is able to understand the customer preference towards the fresh juice.
Along with this, researcher needs to select an appropriate sample size from the population
in order to carrying out the research. Finding of the research is highly dependent upon the sample
size that is selected by the researcher (Gupta, Niyogi and Misra, 2014). There are various
sampling techniques which researcher can use in selecting the suitable sample size. For the
present study, researcher undertakes purpose sampling technique which helps in assessing the
market trend for fresh juice. In order to assess the consumer preference and attitude, 50 people
are selected upon which online survey will be conducted by the researcher.
1.3 Designing of Questionnaire
Demographic information
Name.....
Age .....
1. Which kind of drink does you like most?
Soft drinks ( )
Fresh juice drinks ( )
2. How frequently you intake the fresh juice drink?
Daily ( )
2
Paraphrase This Document
Need a fresh take? Get an instant paraphrase of this document with our AI Paraphraser
Twice in a day ( )
On an alternate basis ( )
Weekly ( )
3. Which feature influences you more while making purchase decision in the respect of fresh
juice drink?
Quality ( )
Price ( )
Ingredients of the juice ( )
4. How much do you prefer to spend for the fresh juice drink?
< 10£ ( )
15£ ( )
<15£ ( )
5. Do you satisfied with the existing products and services which are offered by ABC ltd.?
Satisfied ( )
Moderately satisfied( )
Highly satisfied ( )
Dissatisfied ( )
6. Which brand first comes in your mind while you purchase the fresh juice?
7. Which flavor do you like more in the juice product?
8. Any suggestion which you want to give the company in relation to the juice product.....
TASK 2
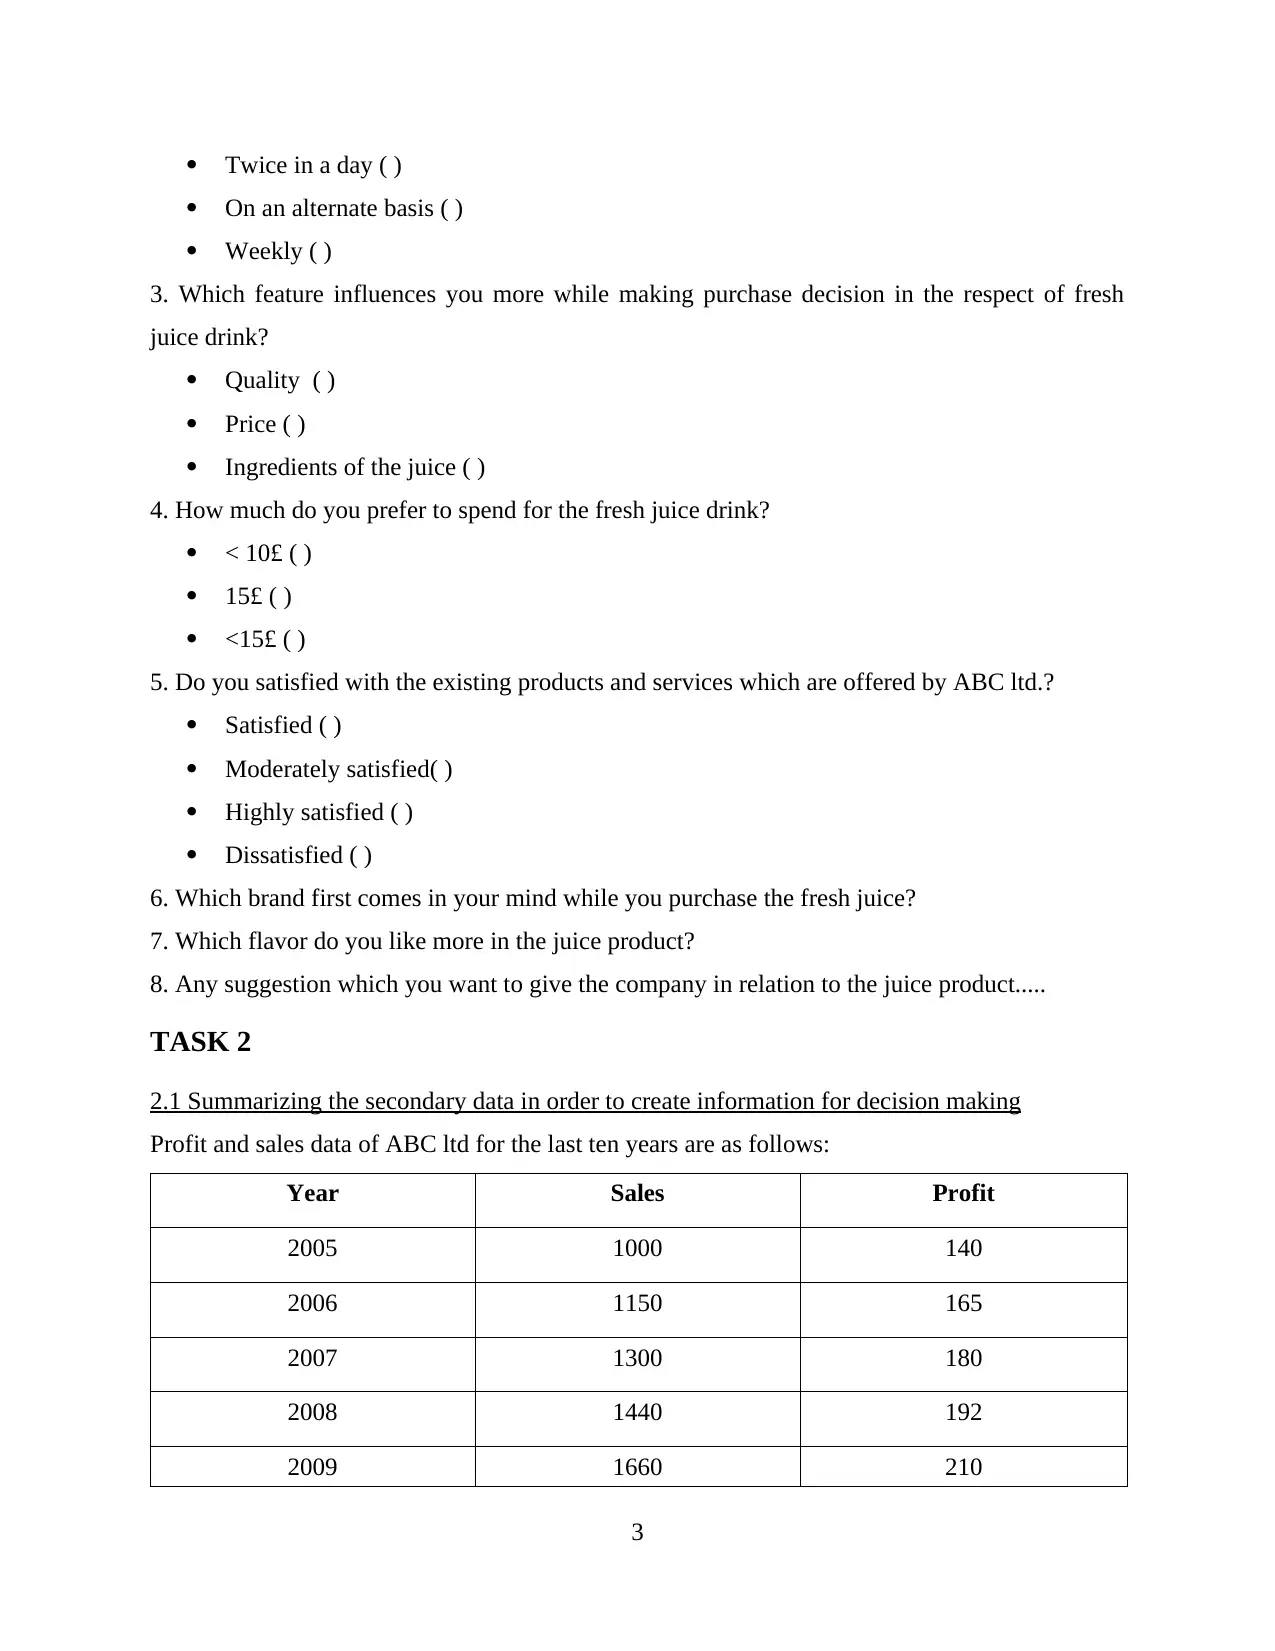
2.1 Summarizing the secondary data in order to create information for decision making
Profit and sales data of ABC ltd for the last ten years are as follows:
Year Sales Profit
2005 1000 140
2006 1150 165
2007 1300 180
2008 1440 192
2009 1660 210
3
On an alternate basis ( )
Weekly ( )
3. Which feature influences you more while making purchase decision in the respect of fresh
juice drink?
Quality ( )
Price ( )
Ingredients of the juice ( )
4. How much do you prefer to spend for the fresh juice drink?
< 10£ ( )
15£ ( )
<15£ ( )
5. Do you satisfied with the existing products and services which are offered by ABC ltd.?
Satisfied ( )
Moderately satisfied( )
Highly satisfied ( )
Dissatisfied ( )
6. Which brand first comes in your mind while you purchase the fresh juice?
7. Which flavor do you like more in the juice product?
8. Any suggestion which you want to give the company in relation to the juice product.....
TASK 2
2.1 Summarizing the secondary data in order to create information for decision making
Profit and sales data of ABC ltd for the last ten years are as follows:
Year Sales Profit
2005 1000 140
2006 1150 165
2007 1300 180
2008 1440 192
2009 1660 210
3
2010 1750 225
2011 1880 240
2012 1990 265
2013 2120 280
2014 2300 305
Mean 1659
Standard error 135.82
Median 1705
On the basis of above mentioned descriptive analysis, it has been interpreted that mean
sales of an organization is 1659. On other hand, a sale of ABC ltd. is in the middle of the 10
years is 1705. Thus, sales which ABC has got in mind of the 10 years are higher than the
average sales of an organization. It clearly states that organization has made little bit changes in
their policies and strategies of an organization.
2.2 Analysis of the results to draw valid conclusion
Analysis of the primary data on the basis of the derived results is as follows:
Which kind of drink does you like most?
Elements Responses In %
Soft drinks 20 40.00%
Fresh juice drinks 30 60.00%
Total 50 100.00%
4
⊘ This is a preview!⊘
Do you want full access?
Subscribe today to unlock all pages.
Trusted by 1+ million students worldwide
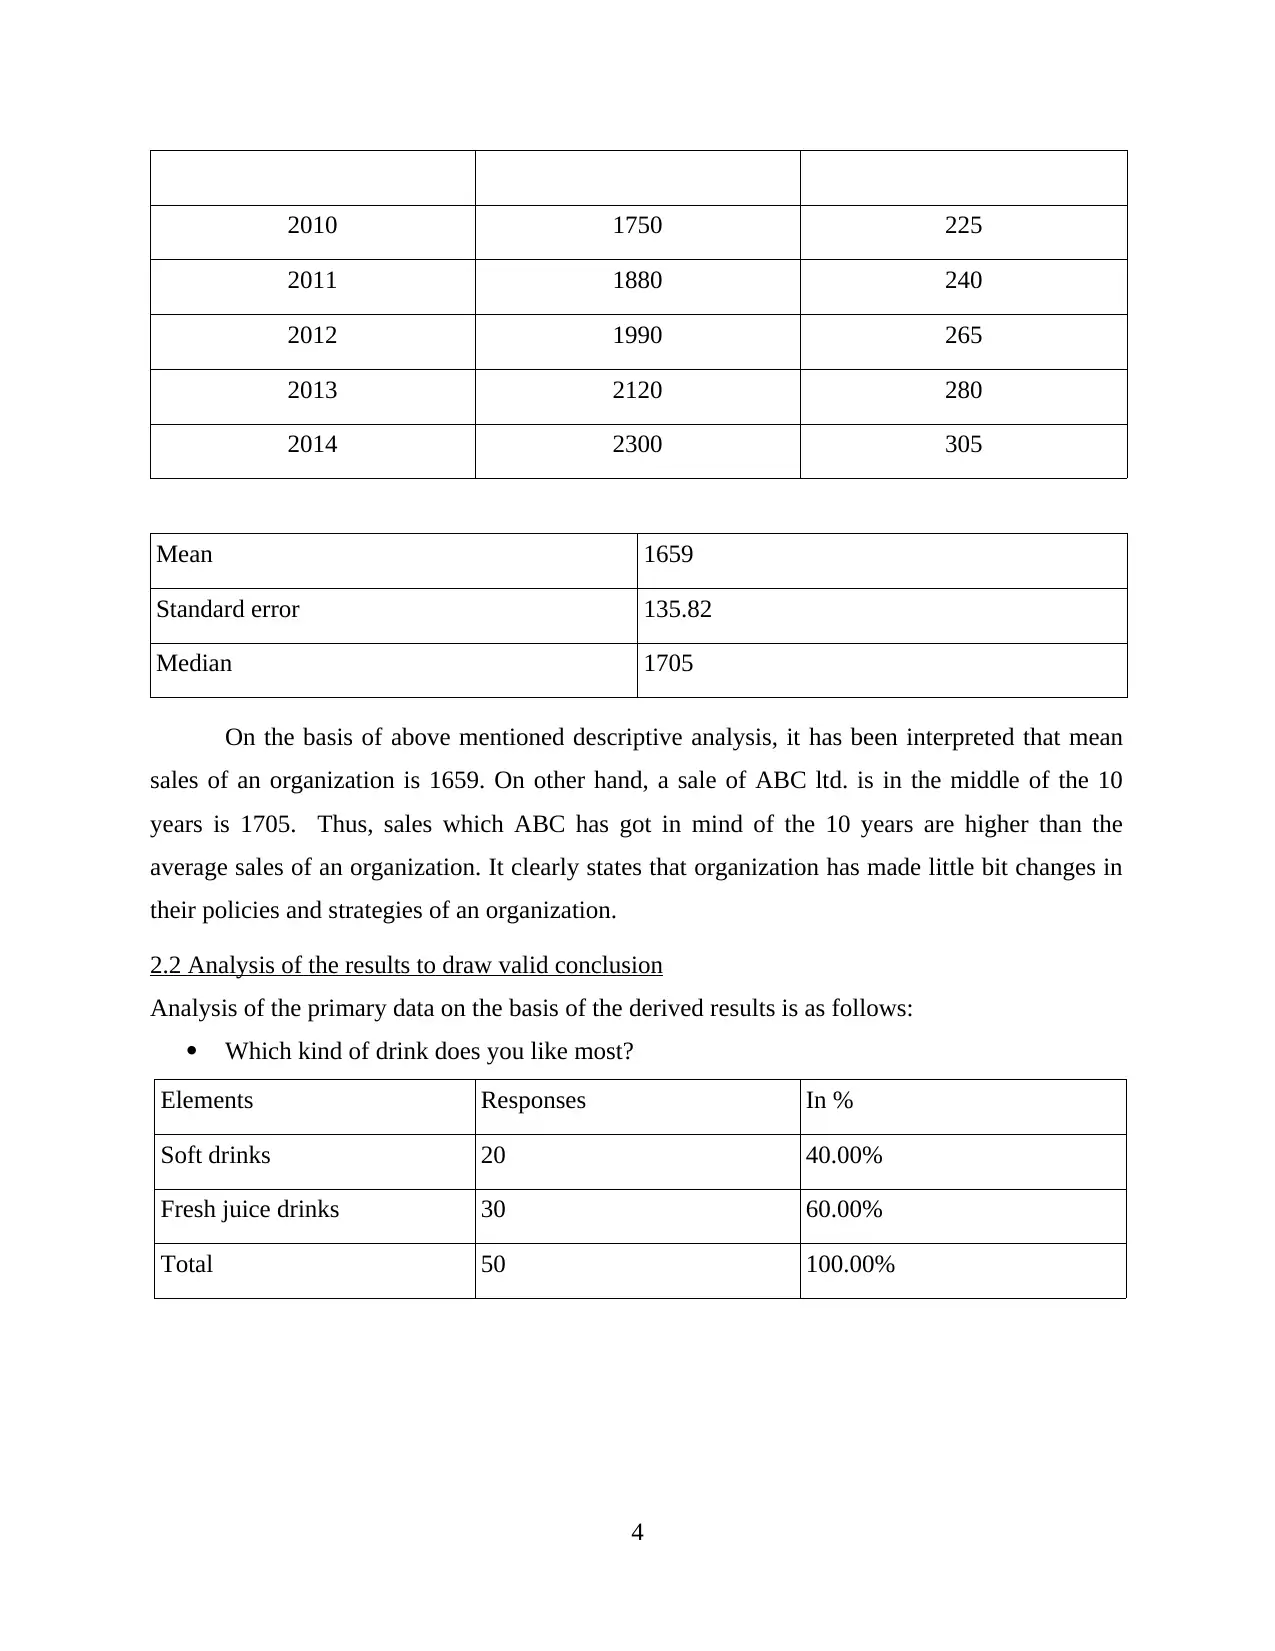
On the basis of the above mentioned result, it has been assessed that 60% of the
customers like fresh juice drink. On other hand, 40% customers like soft drinks rather than the
fresh juice. As per this aspect, it can be stated that market trend for the fresh juice is good.
Which feature influences you more while making purchase decision in the respect of the
fresh juice drink?
Elements Responses In %
Quality 18 36.00%
Price 10 20.00%
Ingredient of the juice 22 44.00%
Total 50 100.00%
5
Soft drinks Fresh juice drinks
0.00%
10.00%
20.00%
30.00%
40.00%
50.00%
60.00%
70.00%
Paraphrase This Document
Need a fresh take? Get an instant paraphrase of this document with our AI Paraphraser
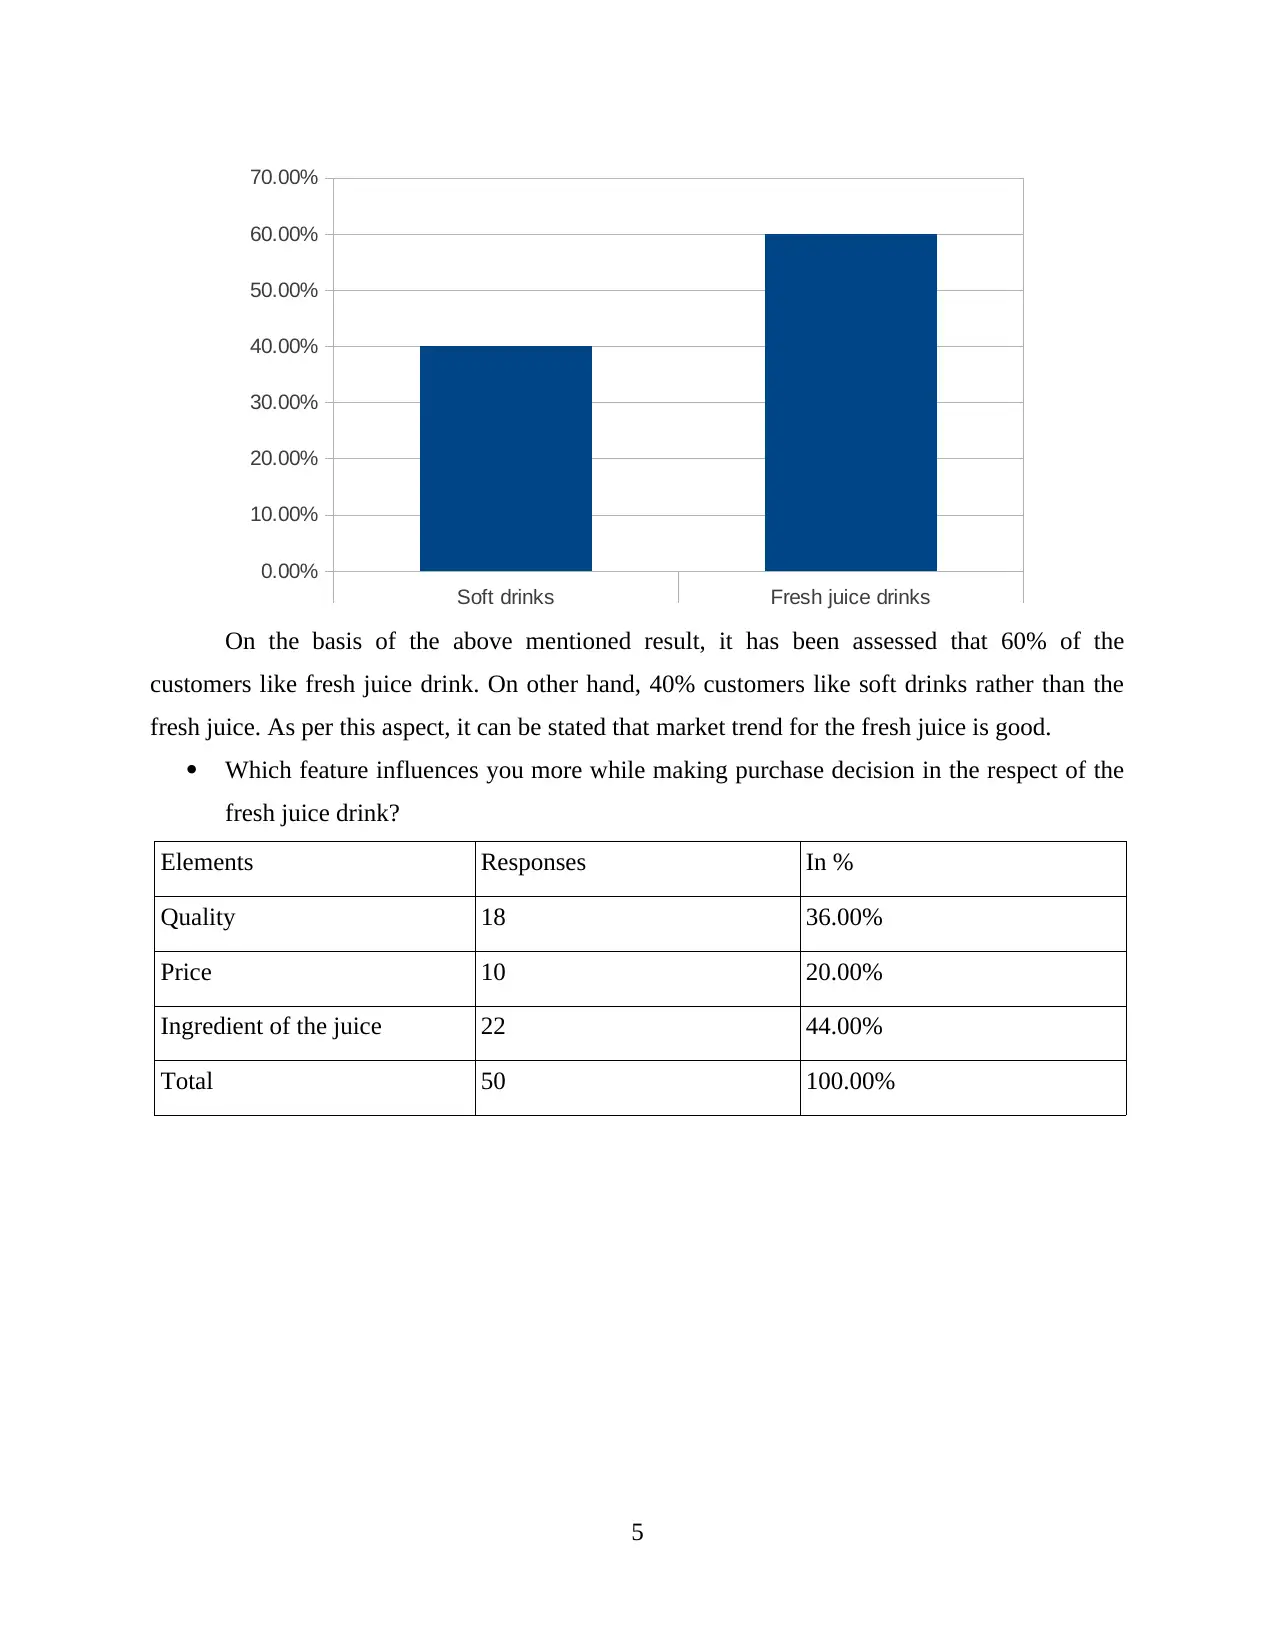
As per the above result, it has been interpreted that large number of customers are
influenced from the ingredients which are used by the manufacturer in fresh juice. In contrary to
this, price is one of the main factors which influence the purchasing decision of 20% customers.
In addition to this, 36% customers are influenced from quality of the fresh juice.
Do you satisfied with the existing products and services which are offered by ABC ltd.?
Elements Responses In %
Satisfied 10 20.00%
Moderately satisfied 12 24.00%
Highly satisfied 25 50.00%
Dissatisfied 3 6.00%
Total 50 100.00%
6
Quality Price Ingredient of the juice
0.00%
5.00%
10.00%
15.00%
20.00%
25.00%
30.00%
35.00%
40.00%
45.00%
50.00%
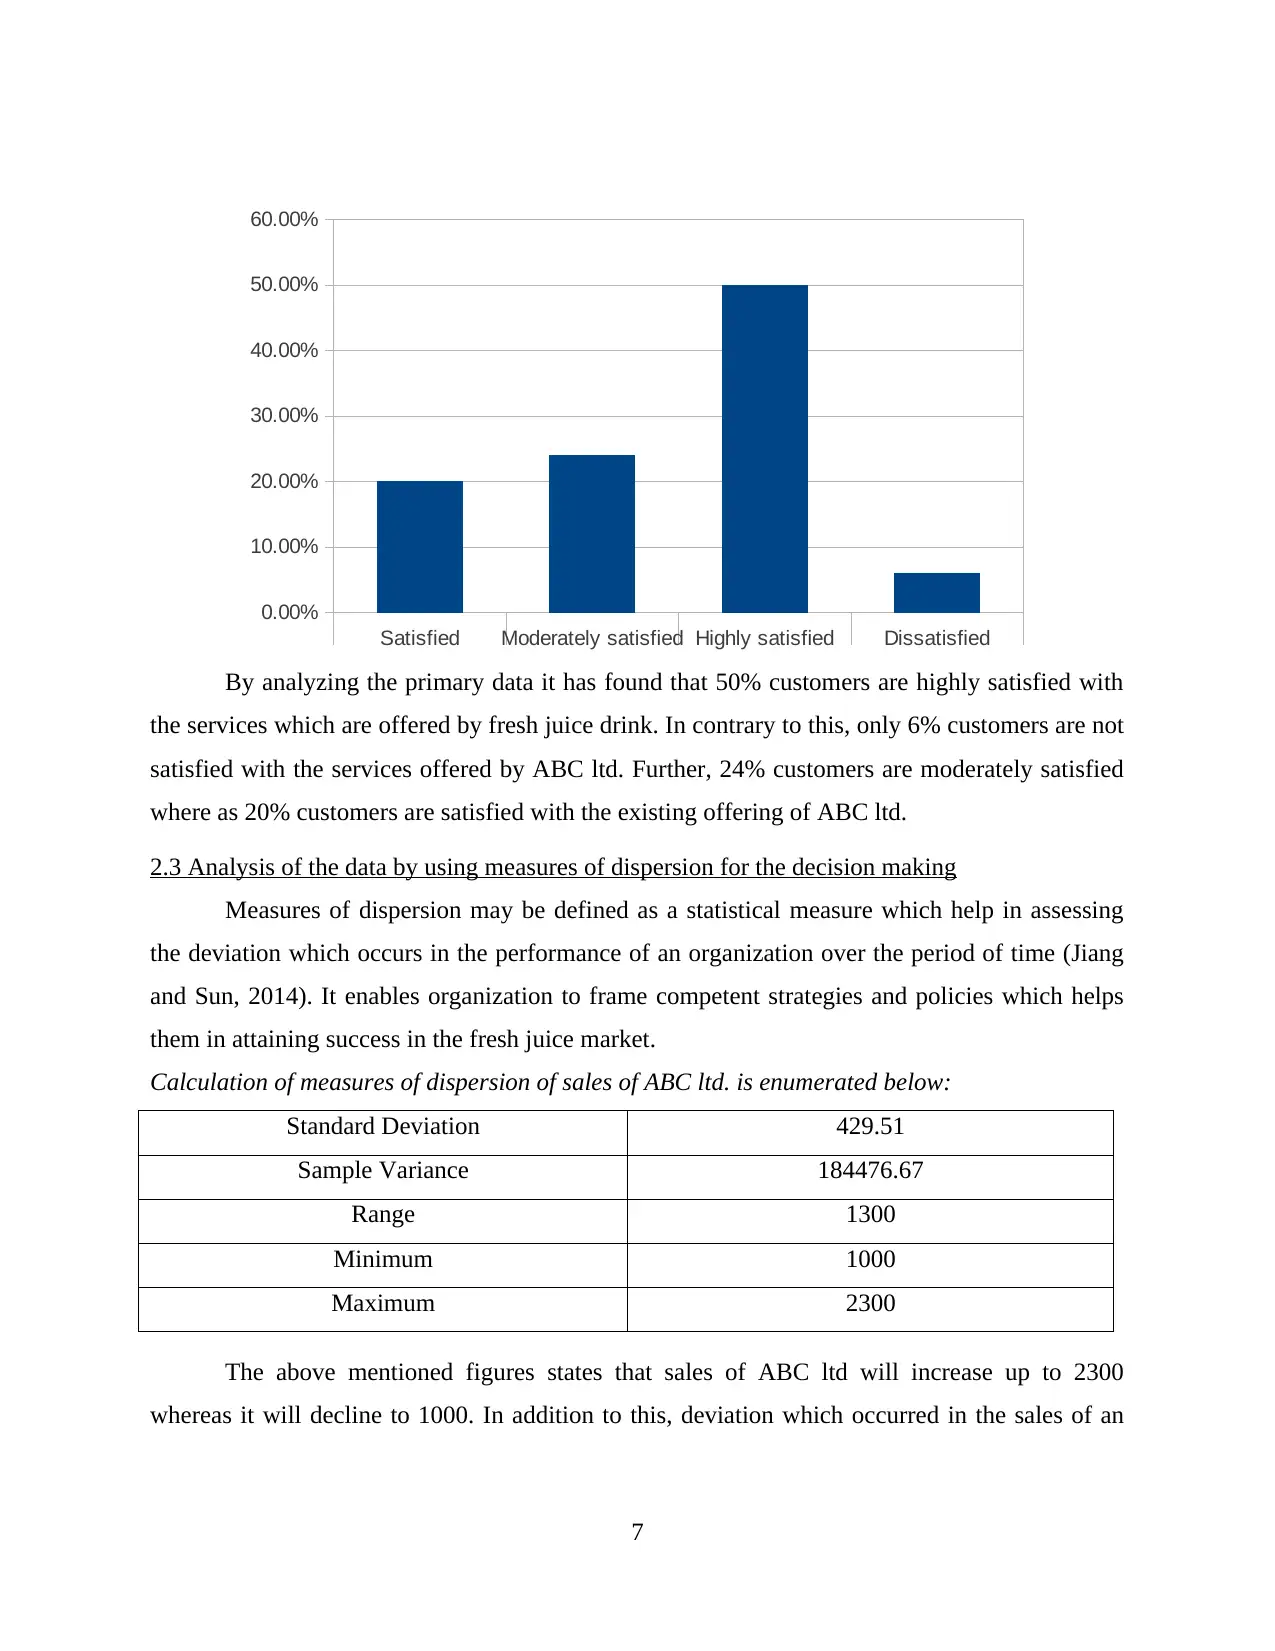
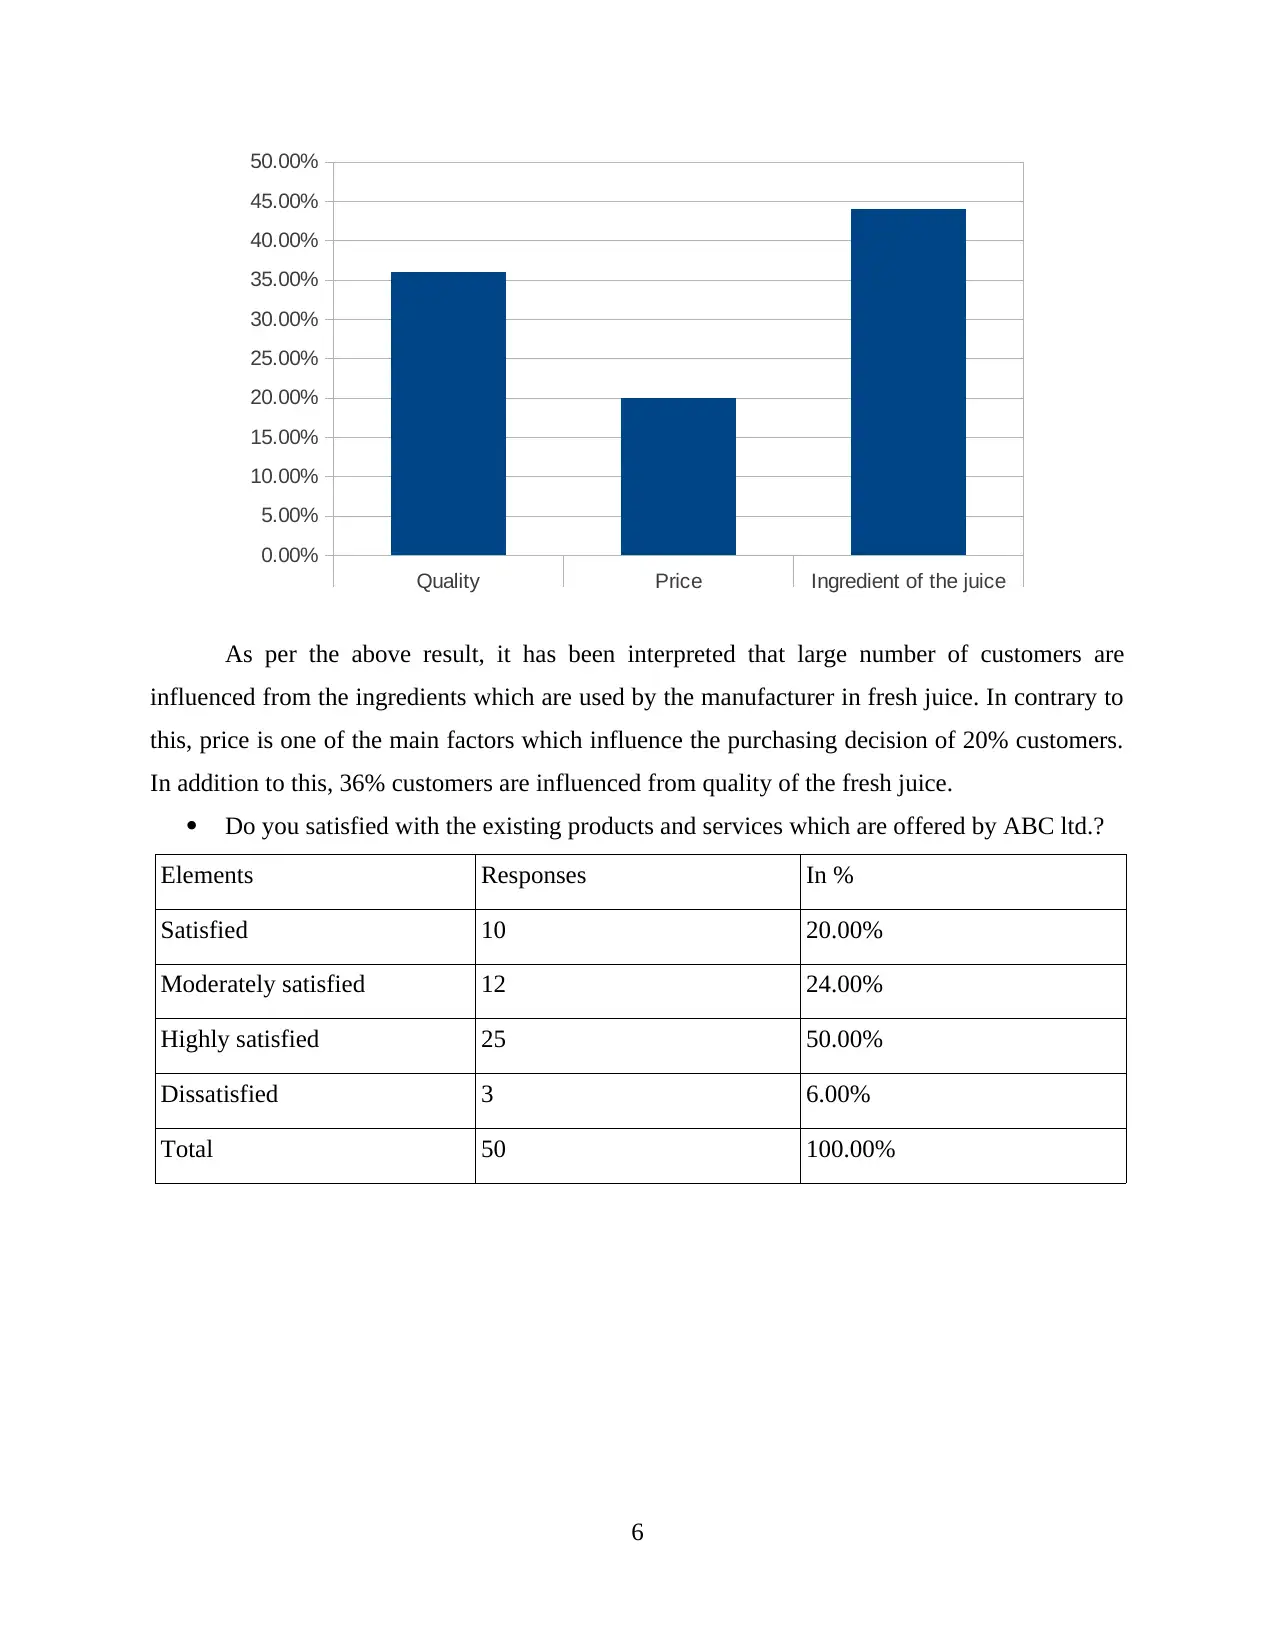
By analyzing the primary data it has found that 50% customers are highly satisfied with
the services which are offered by fresh juice drink. In contrary to this, only 6% customers are not
satisfied with the services offered by ABC ltd. Further, 24% customers are moderately satisfied
where as 20% customers are satisfied with the existing offering of ABC ltd.
2.3 Analysis of the data by using measures of dispersion for the decision making
Measures of dispersion may be defined as a statistical measure which help in assessing
the deviation which occurs in the performance of an organization over the period of time (Jiang
and Sun, 2014). It enables organization to frame competent strategies and policies which helps
them in attaining success in the fresh juice market.
Calculation of measures of dispersion of sales of ABC ltd. is enumerated below:
Standard Deviation 429.51
Sample Variance 184476.67
Range 1300
Minimum 1000
Maximum 2300
The above mentioned figures states that sales of ABC ltd will increase up to 2300
whereas it will decline to 1000. In addition to this, deviation which occurred in the sales of an
7
Satisfied Moderately satisfied Highly satisfied Dissatisfied
0.00%
10.00%
20.00%
30.00%
40.00%
50.00%
60.00%
⊘ This is a preview!⊘
Do you want full access?
Subscribe today to unlock all pages.
Trusted by 1+ million students worldwide
organization is 429.51. It provides deeper insight to an organization about the extent to which
sales will deviate in relation to the other factors.
Calculation of measures of dispersion of profit of ABC ltd. is enumerated below:
Standard Deviation 52.9
Sample Variance 2798.18
Range 165
Minimum 140
Maximum 305
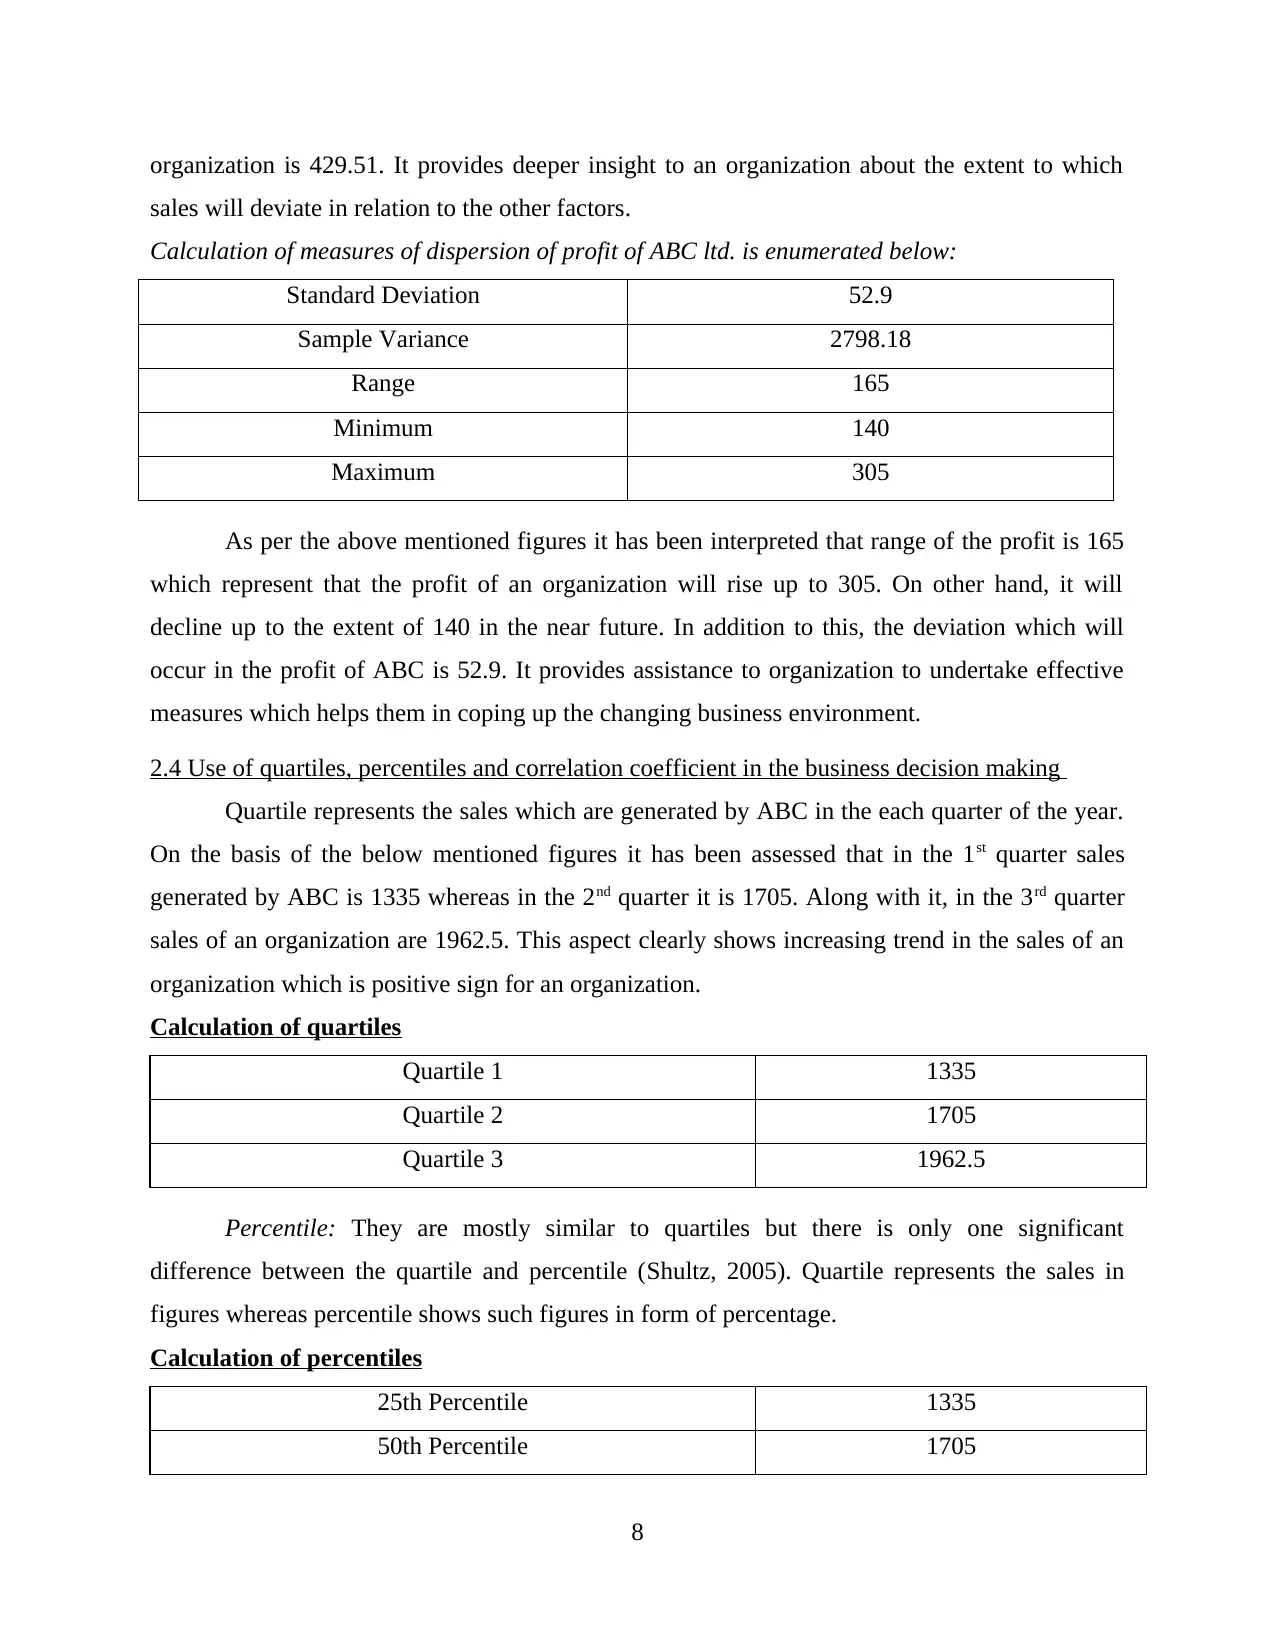
As per the above mentioned figures it has been interpreted that range of the profit is 165
which represent that the profit of an organization will rise up to 305. On other hand, it will
decline up to the extent of 140 in the near future. In addition to this, the deviation which will
occur in the profit of ABC is 52.9. It provides assistance to organization to undertake effective
measures which helps them in coping up the changing business environment.
2.4 Use of quartiles, percentiles and correlation coefficient in the business decision making
Quartile represents the sales which are generated by ABC in the each quarter of the year.
On the basis of the below mentioned figures it has been assessed that in the 1st quarter sales
generated by ABC is 1335 whereas in the 2nd quarter it is 1705. Along with it, in the 3rd quarter
sales of an organization are 1962.5. This aspect clearly shows increasing trend in the sales of an
organization which is positive sign for an organization.
Calculation of quartiles
Quartile 1 1335
Quartile 2 1705
Quartile 3 1962.5
Percentile: They are mostly similar to quartiles but there is only one significant
difference between the quartile and percentile (Shultz, 2005). Quartile represents the sales in
figures whereas percentile shows such figures in form of percentage.
Calculation of percentiles
25th Percentile 1335
50th Percentile 1705
8
sales will deviate in relation to the other factors.
Calculation of measures of dispersion of profit of ABC ltd. is enumerated below:
Standard Deviation 52.9
Sample Variance 2798.18
Range 165
Minimum 140
Maximum 305
As per the above mentioned figures it has been interpreted that range of the profit is 165
which represent that the profit of an organization will rise up to 305. On other hand, it will
decline up to the extent of 140 in the near future. In addition to this, the deviation which will
occur in the profit of ABC is 52.9. It provides assistance to organization to undertake effective
measures which helps them in coping up the changing business environment.
2.4 Use of quartiles, percentiles and correlation coefficient in the business decision making
Quartile represents the sales which are generated by ABC in the each quarter of the year.
On the basis of the below mentioned figures it has been assessed that in the 1st quarter sales
generated by ABC is 1335 whereas in the 2nd quarter it is 1705. Along with it, in the 3rd quarter
sales of an organization are 1962.5. This aspect clearly shows increasing trend in the sales of an
organization which is positive sign for an organization.
Calculation of quartiles
Quartile 1 1335
Quartile 2 1705
Quartile 3 1962.5
Percentile: They are mostly similar to quartiles but there is only one significant
difference between the quartile and percentile (Shultz, 2005). Quartile represents the sales in
figures whereas percentile shows such figures in form of percentage.
Calculation of percentiles
25th Percentile 1335
50th Percentile 1705
8
Paraphrase This Document
Need a fresh take? Get an instant paraphrase of this document with our AI Paraphraser
75th Percentile 1962.5
Correlation: It is the statistical tool which states the relationship between two or more
variables. It helps organization in assessing the impact of changes in one variable over which are
highly associated with each other (Maremmani and et.al, 2015).
Co-relationship between sales and profitability
Correlation Coefficient
Sales Profit
Sales 1
Profit 0.99 1
The above mentioned calculation states that there is highly positive correlation between
the sales and profit of an organization. Correlation between sales and profit of ABC is .99 which
represents that sales and profit will raise or decline in the same direction in the near future.
TASK 3
3.1 Producing graph by using spreadsheet and drawing the valid conclusion based upon it
Graphical representation refers to the visual display of data or statistical results. It is one
the effective way which facilitates better understanding towards the results rather than the other
form (Pyles, 2014).
Year Sales Profit
2005 1000 140
2006 1150 165
2007 1300 180
2008 1440 192
2009 1660 210
2010 1750 225
2011 1880 240
2012 1990 265
2013 2120 280
9
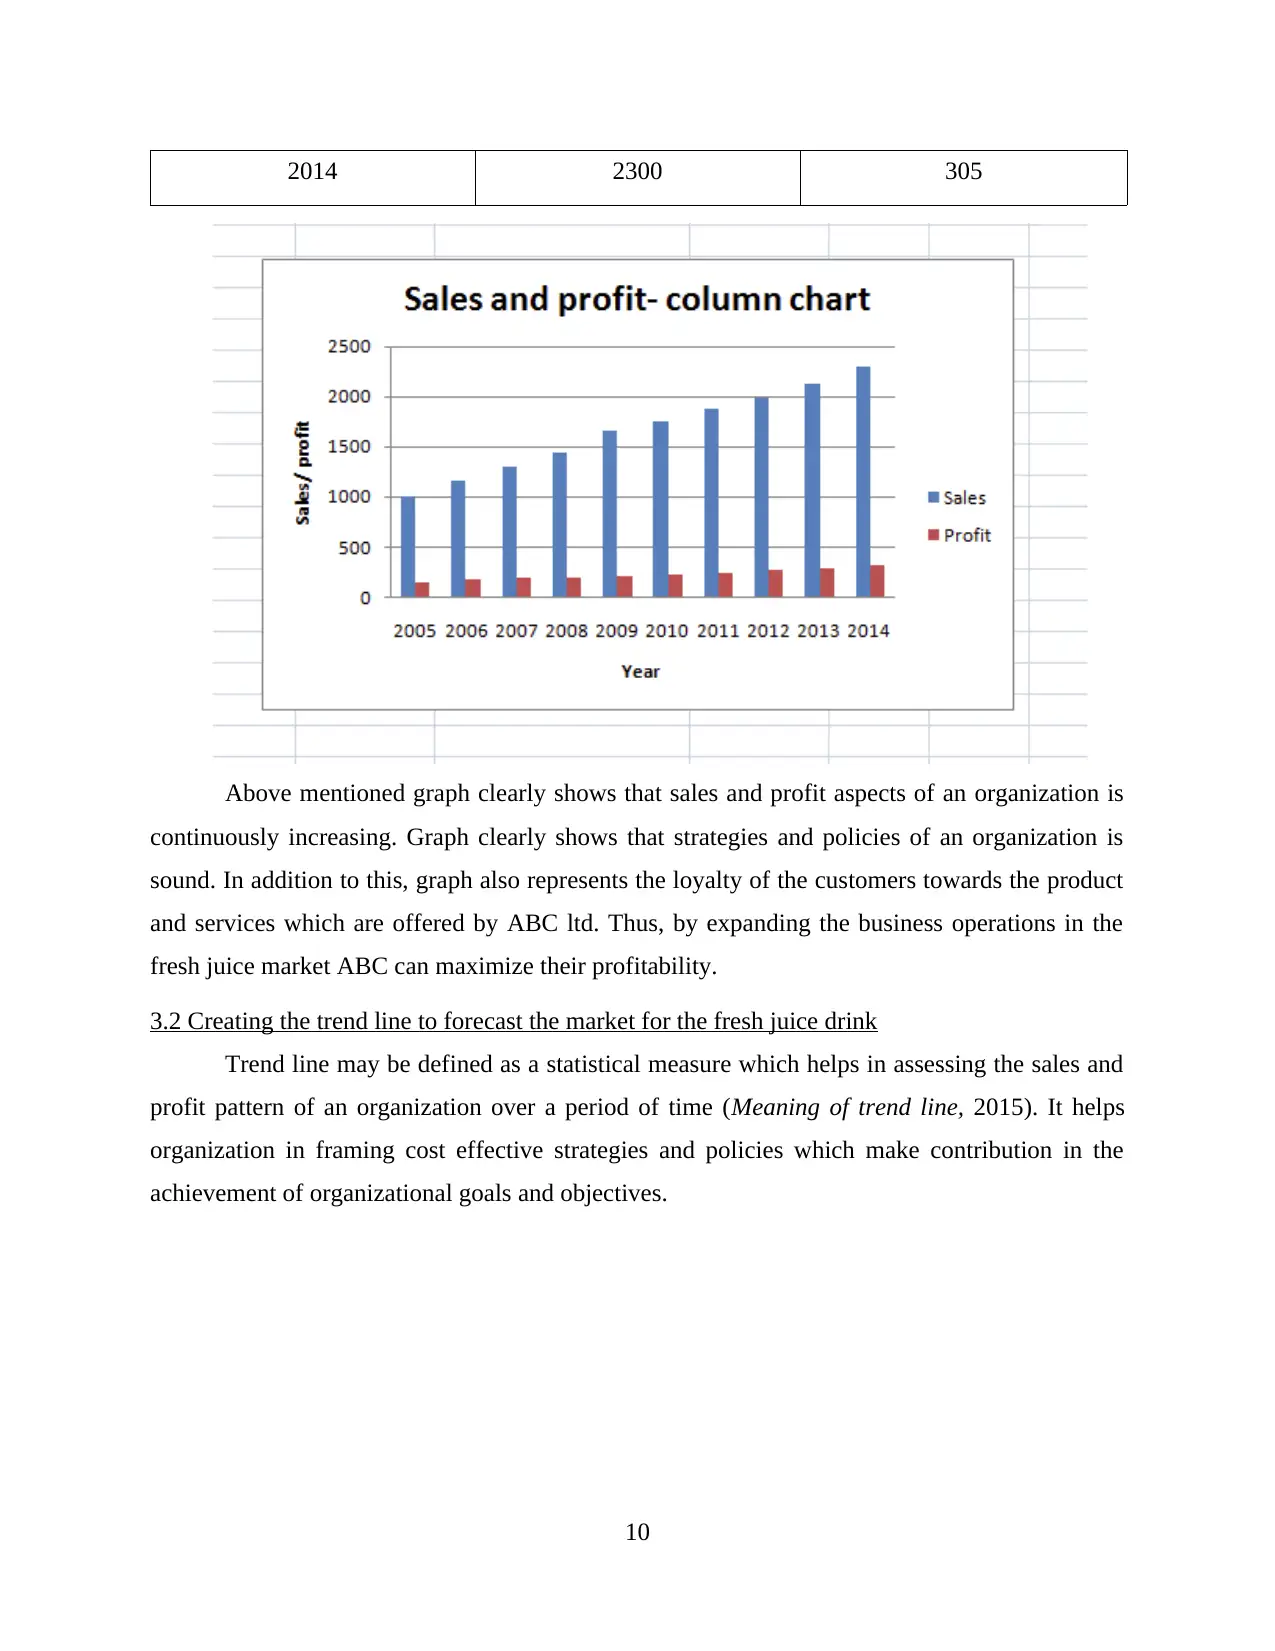
2014 2300 305
Above mentioned graph clearly shows that sales and profit aspects of an organization is
continuously increasing. Graph clearly shows that strategies and policies of an organization is
sound. In addition to this, graph also represents the loyalty of the customers towards the product
and services which are offered by ABC ltd. Thus, by expanding the business operations in the
fresh juice market ABC can maximize their profitability.
3.2 Creating the trend line to forecast the market for the fresh juice drink
Trend line may be defined as a statistical measure which helps in assessing the sales and
profit pattern of an organization over a period of time (Meaning of trend line, 2015). It helps
organization in framing cost effective strategies and policies which make contribution in the
achievement of organizational goals and objectives.
10
⊘ This is a preview!⊘
Do you want full access?
Subscribe today to unlock all pages.
Trusted by 1+ million students worldwide
1 out of 20
Related Documents


Your All-in-One AI-Powered Toolkit for Academic Success.
+13062052269
info@desklib.com
Available 24*7 on WhatsApp / Email
![[object Object]](/_next/static/media/star-bottom.7253800d.svg)
Unlock your academic potential
Copyright © 2020–2026 A2Z Services. All Rights Reserved. Developed and managed by ZUCOL.